| Param | Original file | Final file |
|---|---|---|
| Filename | modeM0/AS1A04_115T02_9000001900_12941cztM0_level2.evt | modeM0/AS1A04_115T02_9000001900_12941cztM0_level2_quad_clean.evt |
| Size (bytes) | 595,969,920 | 64,958,400 |
| Size | 568.4 MB | 61.9 MB |
| Events in quadrant A | 3,946,495 | 388,966 |
| Events in quadrant B | 5,039,160 | 352,858 |
| Events in quadrant C | 3,337,770 | 397,418 |
| Events in quadrant D | 5,280,350 | 369,024 |
| Mode SS | |||
|---|---|---|---|
| Quadrant | BADHDUFLAG | Total packets | Discarded packets |
| A | 0 | 132 | 0 |
| B | 0 | 132 | 0 |
| C | 0 | 132 | 0 |
| D | 0 | 132 | 0 |
| Mode M9 | |||
|---|---|---|---|
| Quadrant | BADHDUFLAG | Total packets | Discarded packets |
| A | 0 | 15 | 0 |
| B | 0 | 15 | 0 |
| C | 0 | 15 | 0 |
| D | 0 | 16 | 0 |
| Mode M0 | |||
|---|---|---|---|
| Quadrant | BADHDUFLAG | Total packets | Discarded packets |
| A | 0 | 16002 | 3 |
| B | 0 | 18931 | 2 |
| C | 0 | 13831 | 2 |
| D | 0 | 19825 | 2 |
| Quadrant | Total seconds | Saturated seconds | Saturation percentage |
|---|---|---|---|
| A | 6572 | 196 | 2.982349% |
| B | 6572 | 804 | 12.233719% |
| C | 6572 | 114 | 1.734632% |
| D | 6572 | 766 | 11.655508% |
Noise dominated data is calculated using 1-second bins in cleaned event files. If a bin has >2000 counts, and if more than 50% of those come from <1% of pixels, then it is considered to be noise-dominated and hence unusable.
| Quadrant | # 1 sec bins | Bins with >0 counts | Bins with >2000 counts | High rate bins dominated by noise | Noise dominated (total time) | Noise dominated (detector-on time) | Marked lightcurve |
|---|---|---|---|---|---|---|---|
| A | 7758 | 6574 | 19 | 19 | 0.24% | 0.29% | 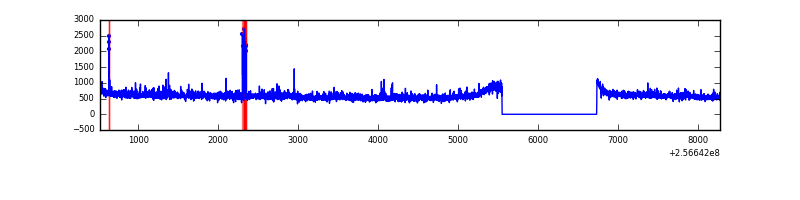 |
| B | 7758 | 6574 | 473 | 473 | 6.10% | 7.20% | 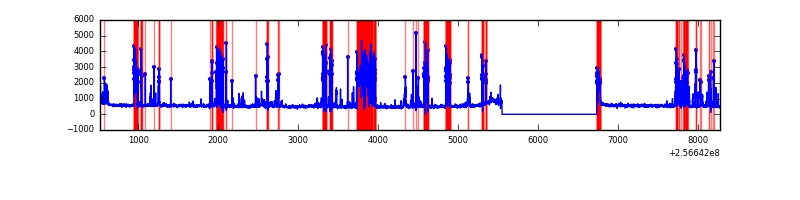 |
| C | 7758 | 6574 | 0 | 0 | 0.00% | 0.00% | 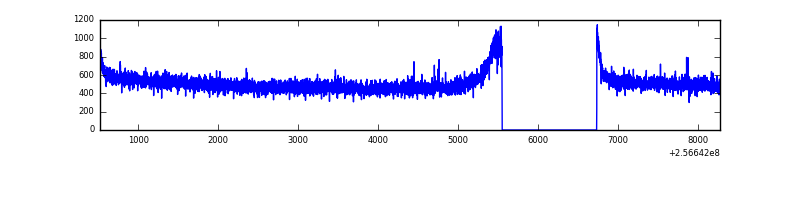 |
| D | 7758 | 6574 | 559 | 559 | 7.21% | 8.50% | 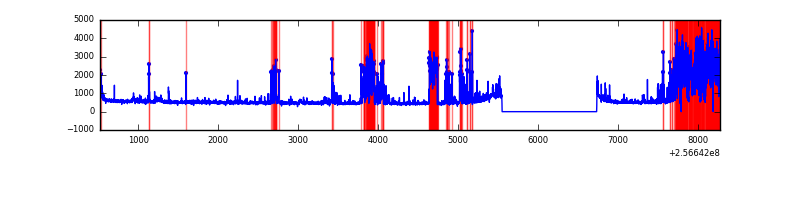 |
Top three noisy pixels from each quadrant. If the there are fewer than three noisy pixels in the level2.evt file, extra rows are filled as -1
| Pixel properties | Quadrant properties | ||||||
|---|---|---|---|---|---|---|---|
| Quadrant | DetID | PixID | Counts | Sigma | Mean | Median | Sigma |
| A | 15 | 239 | 312571 | 1758.24 | 879 | 862 | 177.3 |
| A | 1 | 162 | 82563 | 460.85 | 879 | 862 | 177.3 |
| A | 15 | 223 | 44026 | 243.47 | 879 | 862 | 177.3 |
| B | 4 | 239 | 1411794 | 9163.5 | 815 | 796 | 154.0 |
| B | 3 | 64 | 343217 | 2223.8 | 815 | 796 | 154.0 |
| B | 0 | 219 | 27652 | 174.41 | 815 | 796 | 154.0 |
| C | 4 | 112 | 6621 | 29.24 | 854 | 859 | 197.1 |
| C | 13 | 61 | 6107 | 26.63 | 854 | 859 | 197.1 |
| C | 3 | 202 | 2093 | 6.26 | 854 | 859 | 197.1 |
| D | 12 | 110 | 1152189 | 5904.54 | 820 | 799 | 195.0 |
| D | 10 | 157 | 687943 | 3523.8 | 820 | 799 | 195.0 |
| D | 1 | 52 | 242629 | 1240.15 | 820 | 799 | 195.0 |
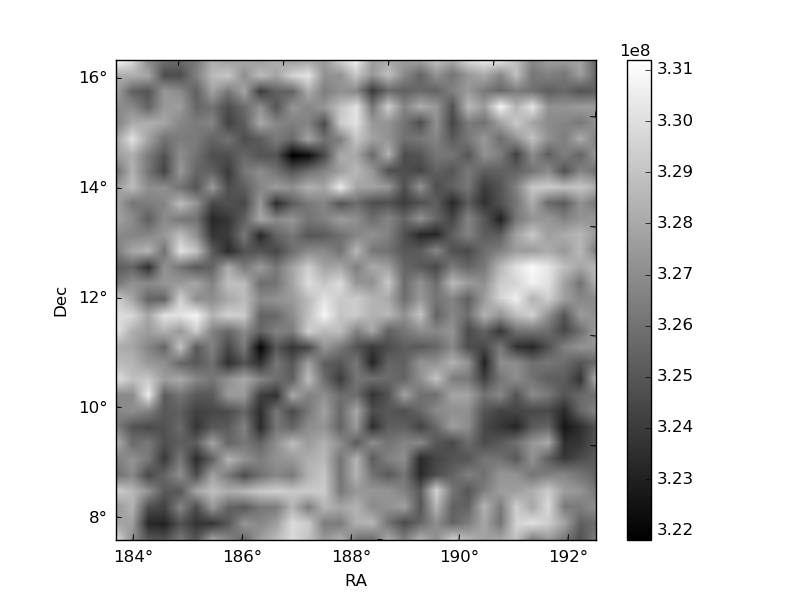
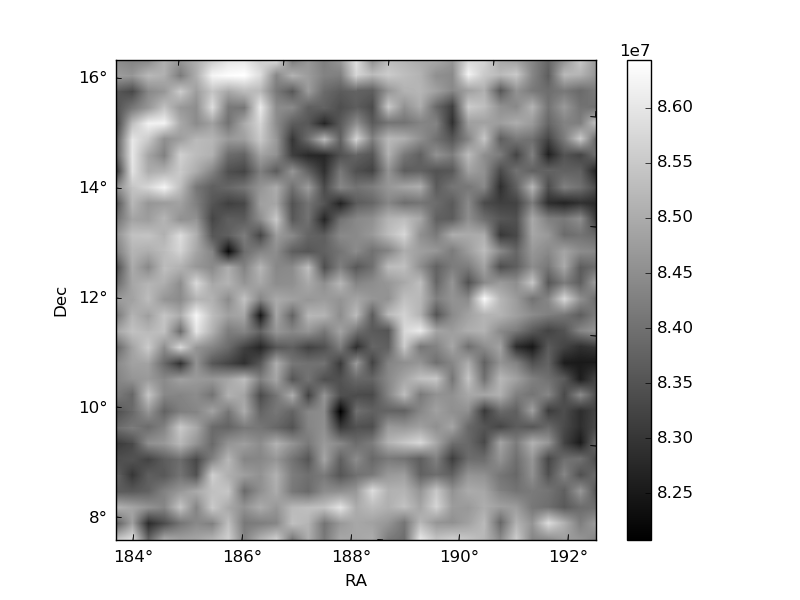
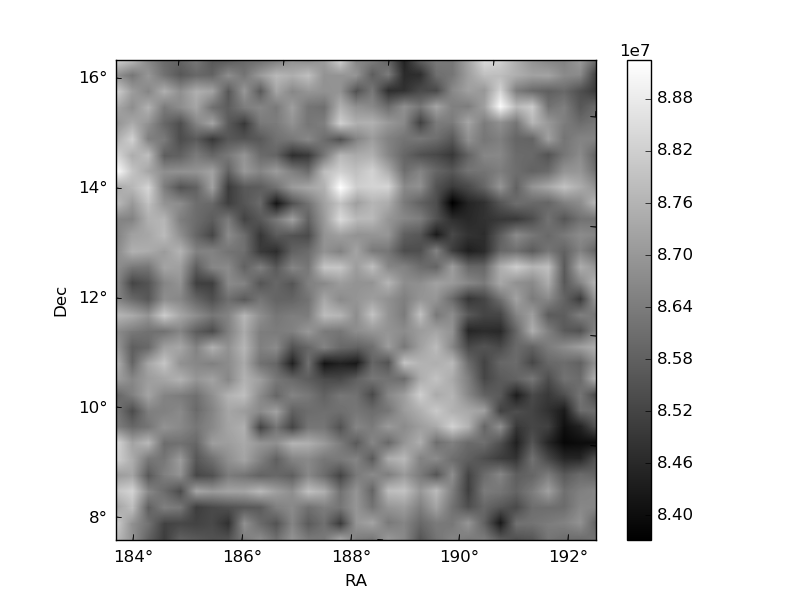
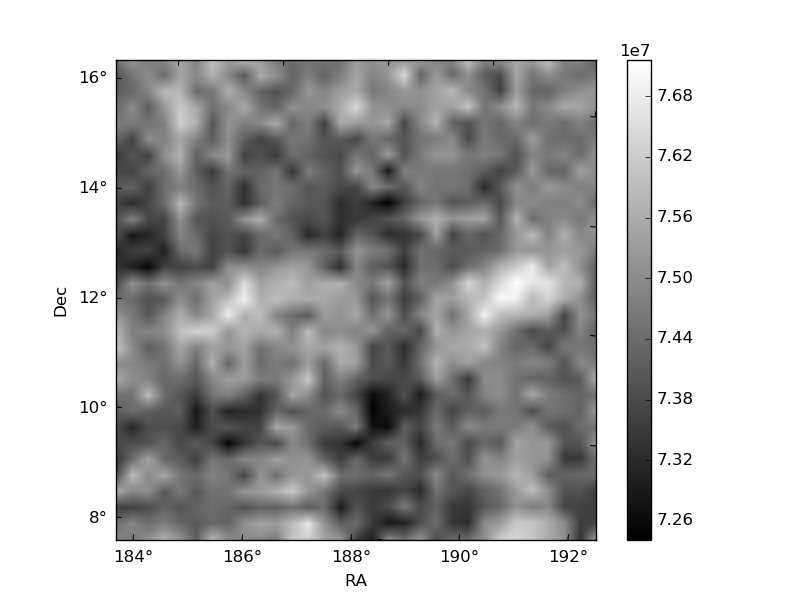
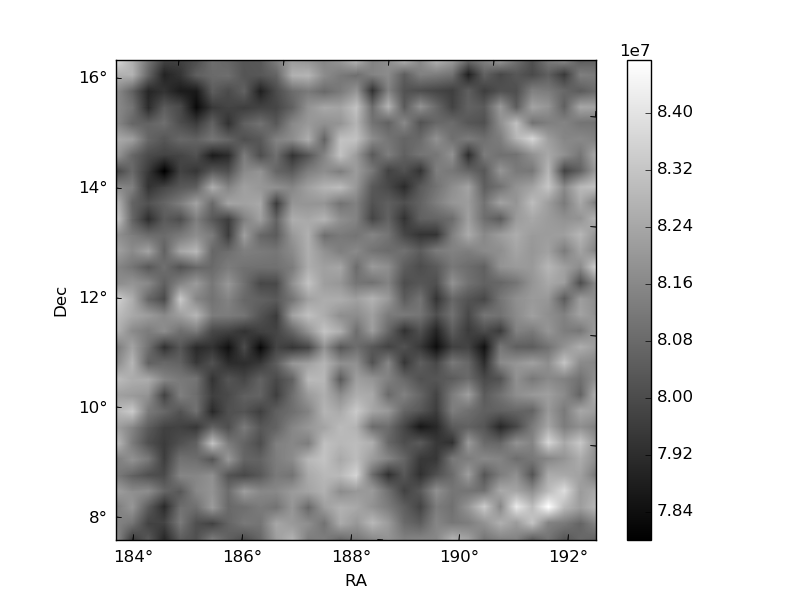
Histogram calculated using DETX and DETY for each event in the final _common_clean file
| Quadrant A | 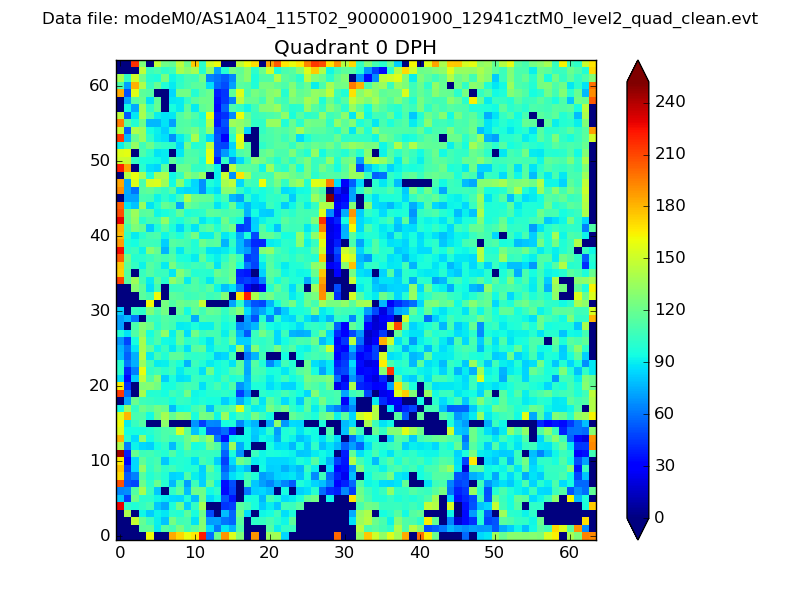 |
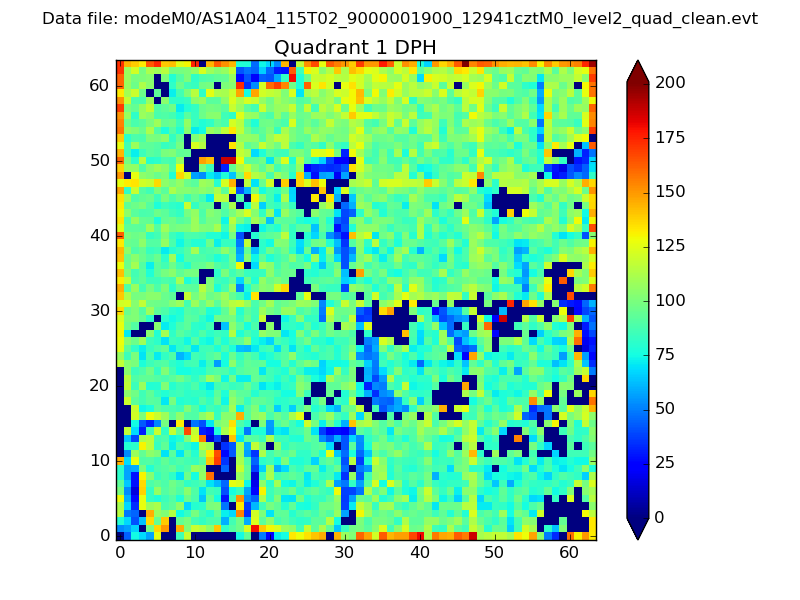 |
Quadrant B |
|---|---|---|---|
| Quadrant D | 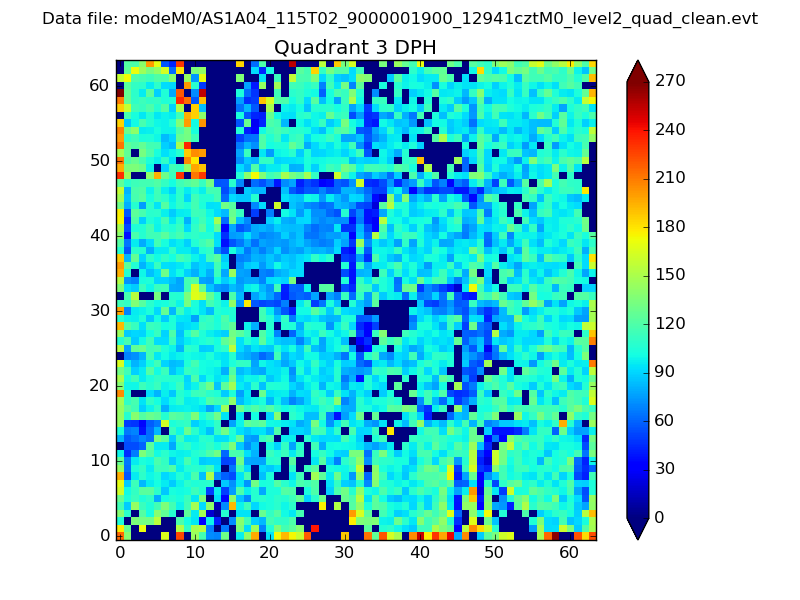 |
 |
Quadrant C |
| Plot type | Count rate plots | Images |
|---|---|---|
| Comparison with Poisson distribution Blue bars denote a histogram of data divided into 1 sec bins. Red curve is a Poisson curve with rate = median count rate of data. |
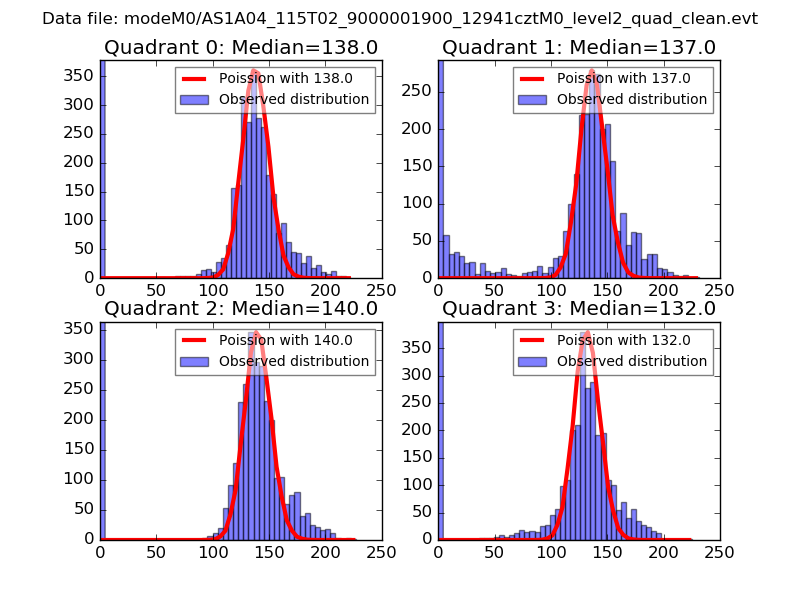 |
 |
| Quadrant-wise count rates Data is divided into 100 sec bins |
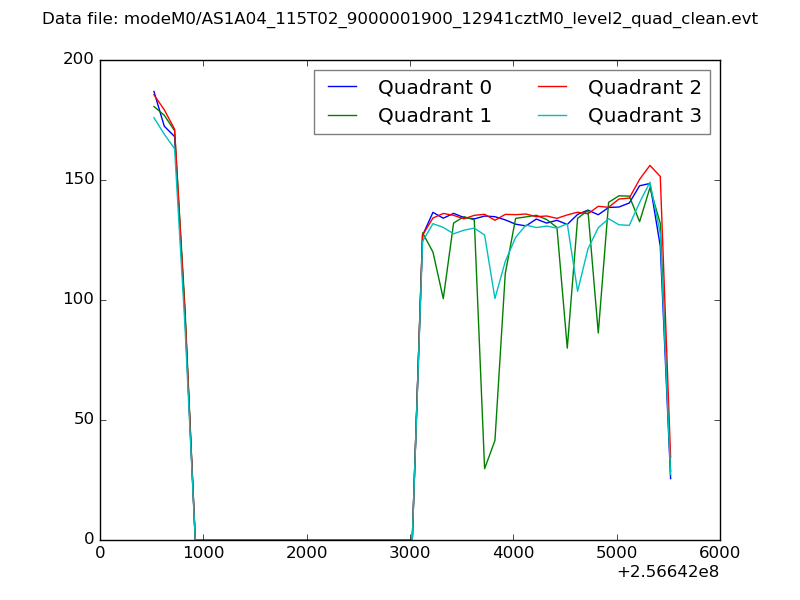 |
|
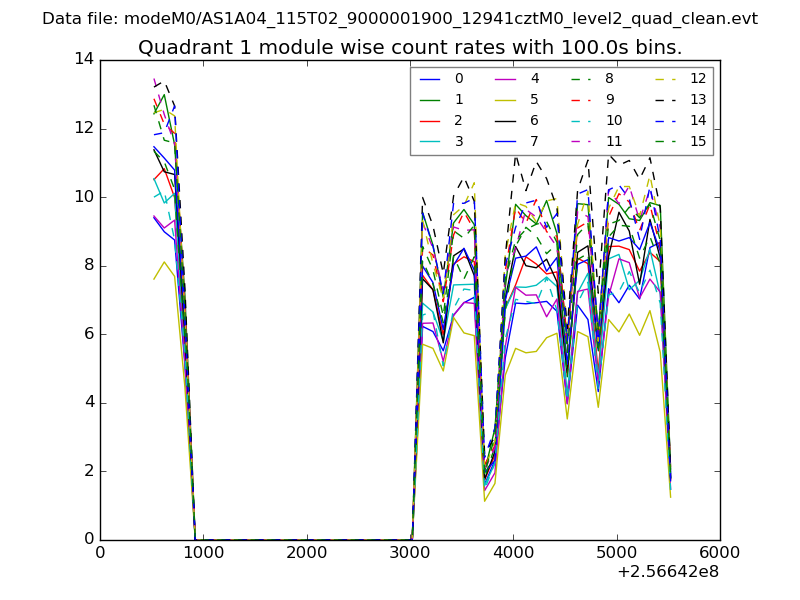
| Module-wise count rates for Quadrant A Data is divided into 100 sec bins |
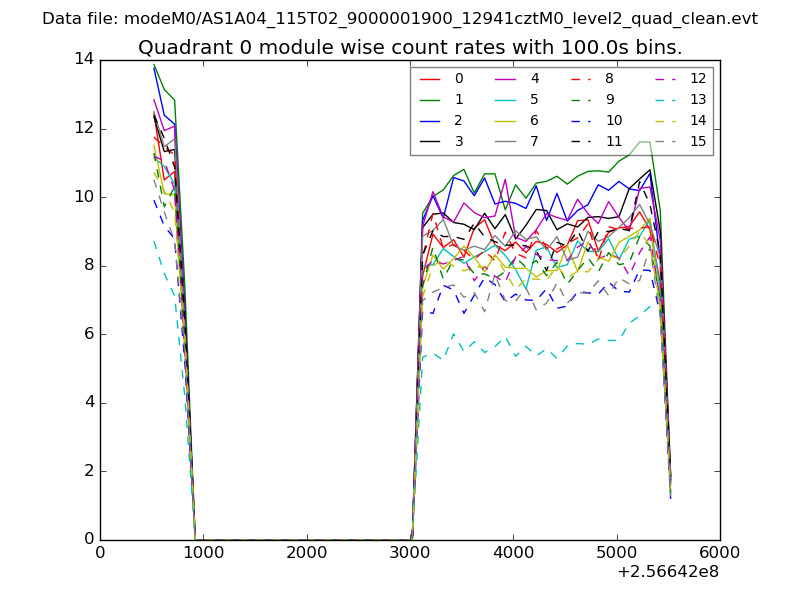 |
 |
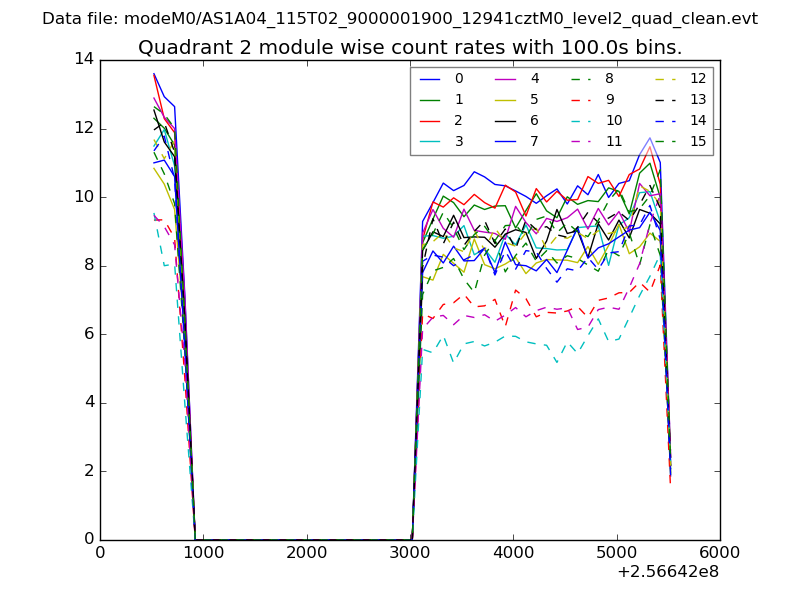
| Module-wise count rates for Quadrant B Data is divided into 100 sec bins |
 |
 |
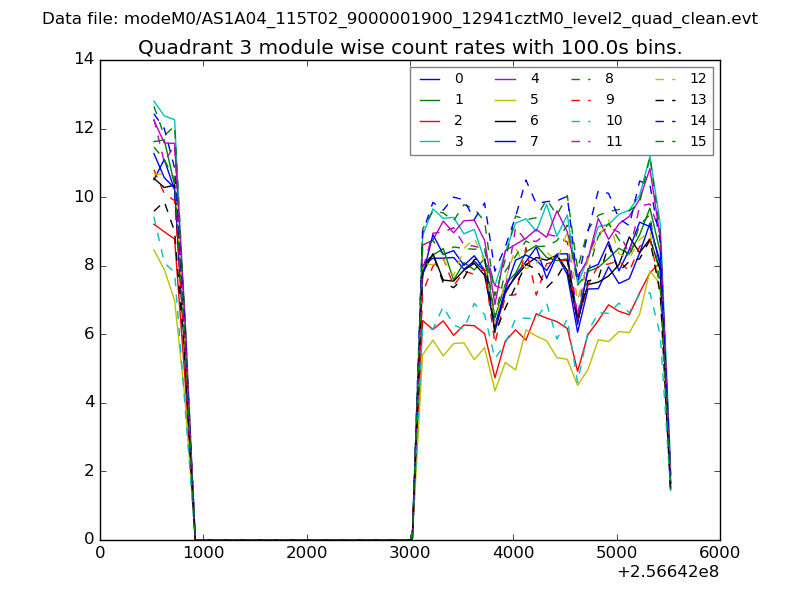
| Module-wise count rates for Quadrant C Data is divided into 100 sec bins |
 |
 |
| Module-wise count rates for Quadrant D Data is divided into 100 sec bins |
 |
 |
| Parameter | Plot |
|---|---|
| CZT HV Monitor | 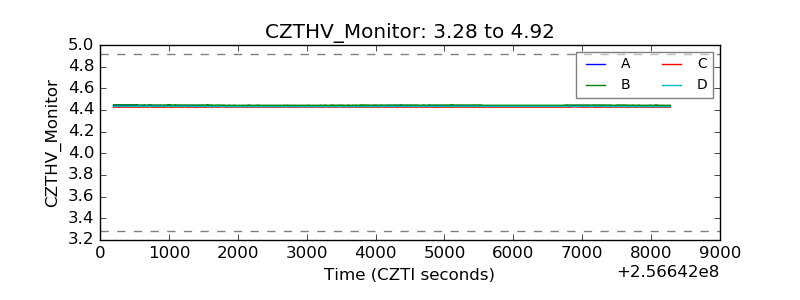 |
| D_VDD | 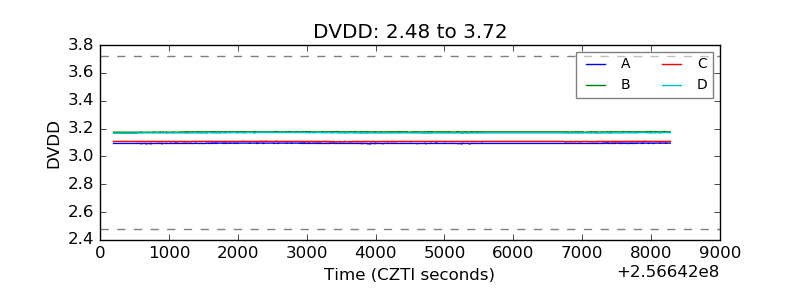 |
| Temperature 1 |  |
| Veto HV Monitor | 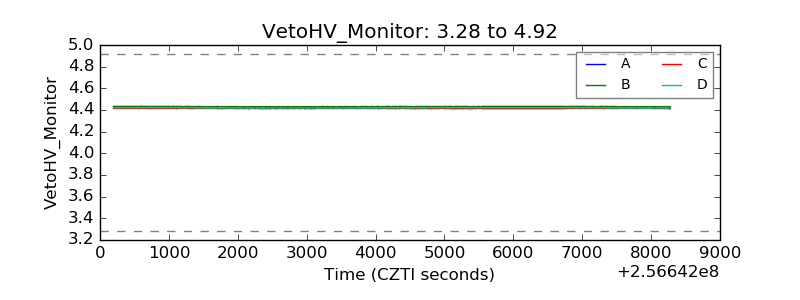 |
| Veto LLD | 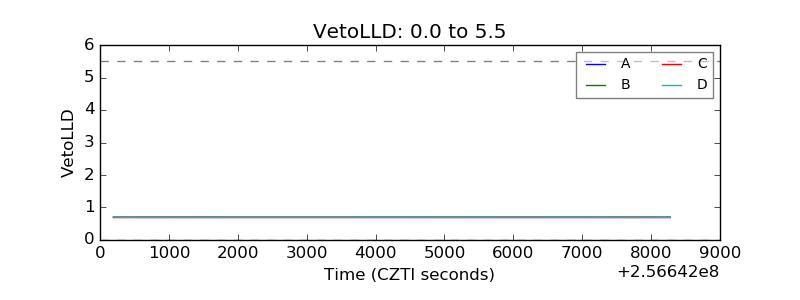 |
| Alpha Counter | 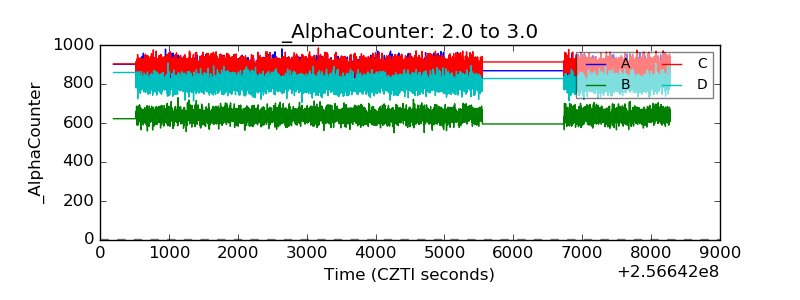 |
| _CPM_Rate | 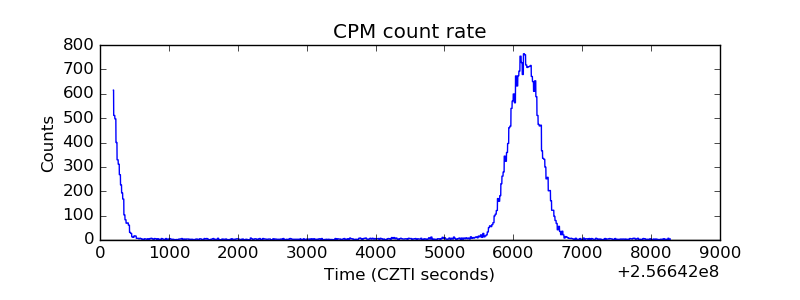 |
| CZT Counter |  |
| +2.5 Volts monitor | 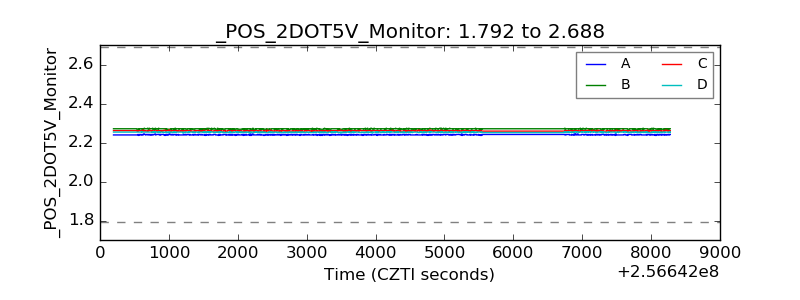 |
| +5 Volts monitor |  |
| _ROLL_ROT | 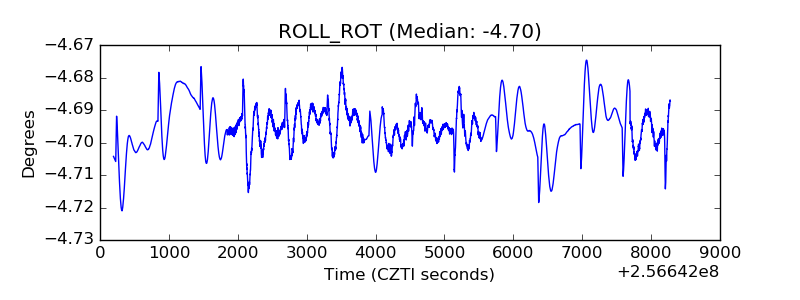 |
| _Roll_DEC | 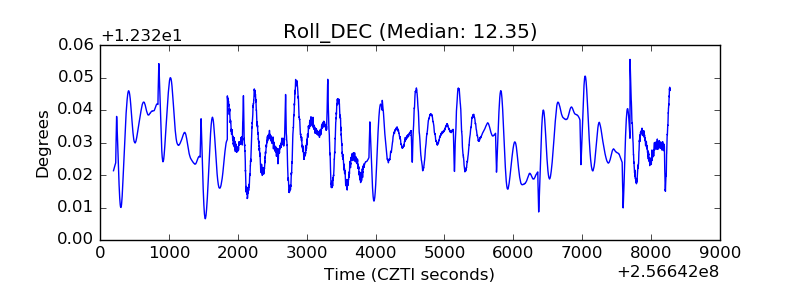 |
| _Roll_RA | 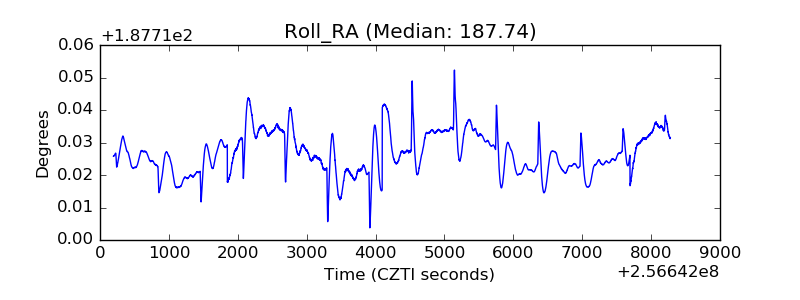 |
| Veto Counter | 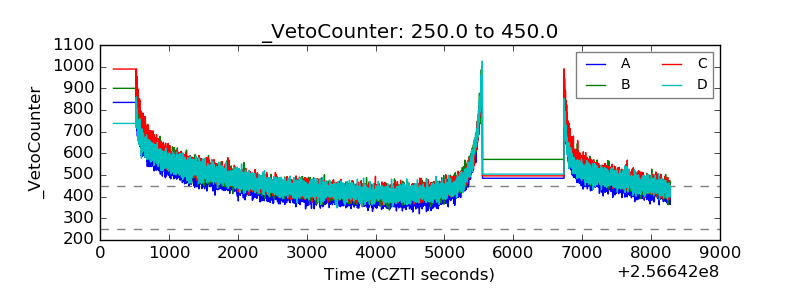 |