| Param | Original file | Final file |
|---|---|---|
| Filename | modeM0/AS1A04_115T02_9000001900_12945cztM0_level2.evt | modeM0/AS1A04_115T02_9000001900_12945cztM0_level2_quad_clean.evt |
| Size (bytes) | 646,205,760 | 85,438,080 |
| Size | 616.3 MB | 81.5 MB |
| Events in quadrant A | 3,764,048 | 538,847 |
| Events in quadrant B | 5,412,390 | 508,936 |
| Events in quadrant C | 3,336,133 | 544,483 |
| Events in quadrant D | 6,563,394 | 486,836 |
| Mode SS | |||
|---|---|---|---|
| Quadrant | BADHDUFLAG | Total packets | Discarded packets |
| A | 0 | 148 | 0 |
| B | 0 | 148 | 0 |
| C | 0 | 148 | 0 |
| D | 0 | 148 | 0 |
| Mode M9 | |||
|---|---|---|---|
| Quadrant | BADHDUFLAG | Total packets | Discarded packets |
| A | 0 | 2 | 0 |
| B | 0 | 2 | 0 |
| C | 0 | 2 | 0 |
| D | 0 | 2 | 0 |
| Mode M0 | |||
|---|---|---|---|
| Quadrant | BADHDUFLAG | Total packets | Discarded packets |
| A | 0 | 15973 | 3 |
| B | 0 | 20904 | 2 |
| C | 0 | 14871 | 2 |
| D | 0 | 24622 | 2 |
| Quadrant | Total seconds | Saturated seconds | Saturation percentage |
|---|---|---|---|
| A | 7291 | 81 | 1.110959% |
| B | 7291 | 1225 | 16.801536% |
| C | 7291 | 31 | 0.425182% |
| D | 7291 | 983 | 13.482376% |
Noise dominated data is calculated using 1-second bins in cleaned event files. If a bin has >2000 counts, and if more than 50% of those come from <1% of pixels, then it is considered to be noise-dominated and hence unusable.
| Quadrant | # 1 sec bins | Bins with >0 counts | Bins with >2000 counts | High rate bins dominated by noise | Noise dominated (total time) | Noise dominated (detector-on time) | Marked lightcurve |
|---|---|---|---|---|---|---|---|
| A | 7517 | 7294 | 3 | 3 | 0.04% | 0.04% | 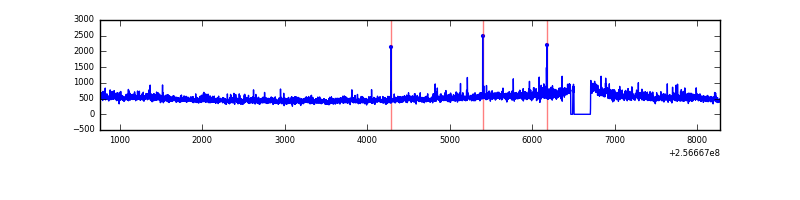 |
| B | 7517 | 7294 | 529 | 529 | 7.04% | 7.25% | 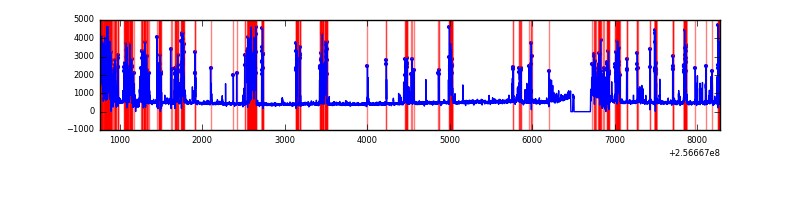 |
| C | 7517 | 7294 | 0 | 0 | 0.00% | 0.00% | 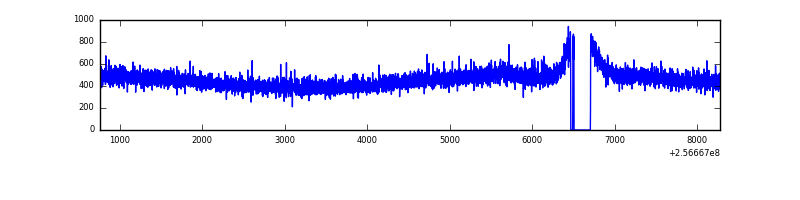 |
| D | 7517 | 7294 | 765 | 765 | 10.18% | 10.49% | 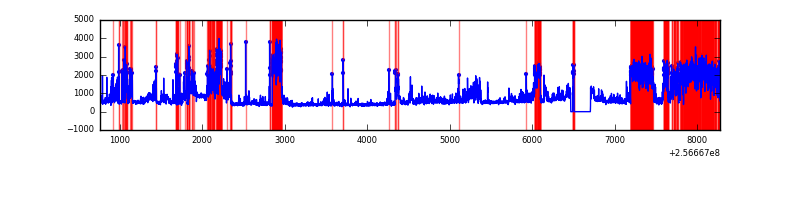 |
Top three noisy pixels from each quadrant. If the there are fewer than three noisy pixels in the level2.evt file, extra rows are filled as -1
| Pixel properties | Quadrant properties | ||||||
|---|---|---|---|---|---|---|---|
| Quadrant | DetID | PixID | Counts | Sigma | Mean | Median | Sigma |
| A | 1 | 162 | 143264 | 789.1 | 876 | 855 | 180.5 |
| A | 1 | 178 | 67972 | 371.9 | 876 | 855 | 180.5 |
| A | 1 | 161 | 59357 | 324.16 | 876 | 855 | 180.5 |
| B | 4 | 239 | 2215396 | 14872.19 | 774 | 756 | 148.9 |
| B | 3 | 64 | 114641 | 764.78 | 774 | 756 | 148.9 |
| B | 0 | 214 | 26176 | 170.71 | 774 | 756 | 148.9 |
| C | 13 | 61 | 6190 | 26.76 | 855 | 858 | 199.2 |
| C | 8 | 222 | 3446 | 12.99 | 855 | 858 | 199.2 |
| C | 3 | 202 | 2099 | 6.23 | 855 | 858 | 199.2 |
| D | 1 | 52 | 3308795 | 16522.62 | 815 | 789 | 200.2 |
| D | 8 | 195 | 102638 | 508.71 | 815 | 789 | 200.2 |
| D | 10 | 157 | 38050 | 186.11 | 815 | 789 | 200.2 |
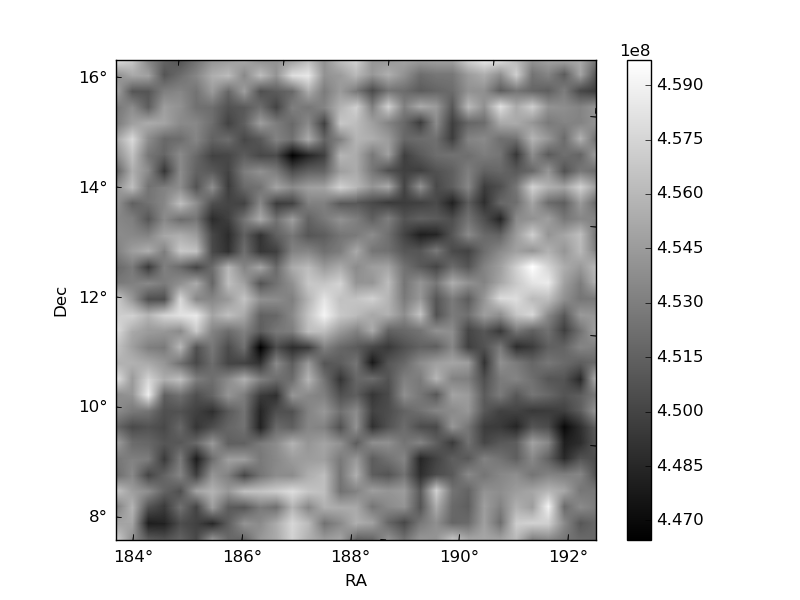
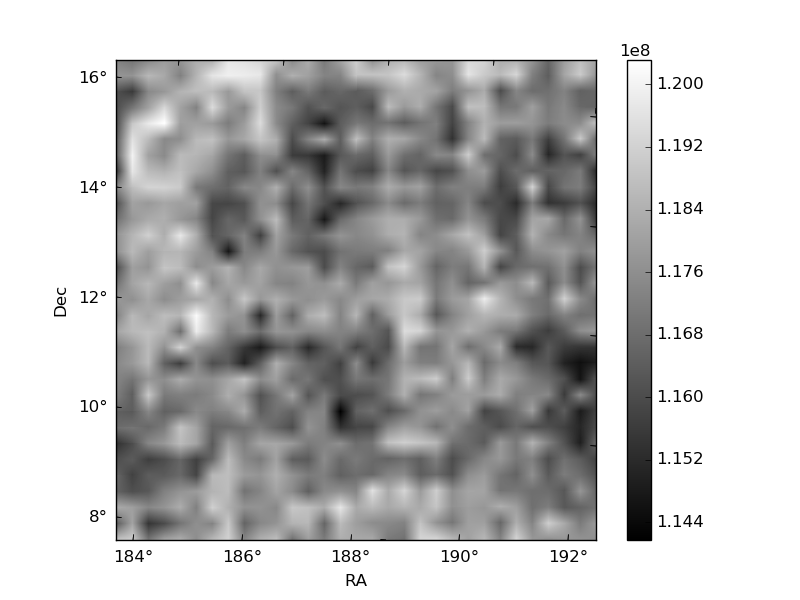
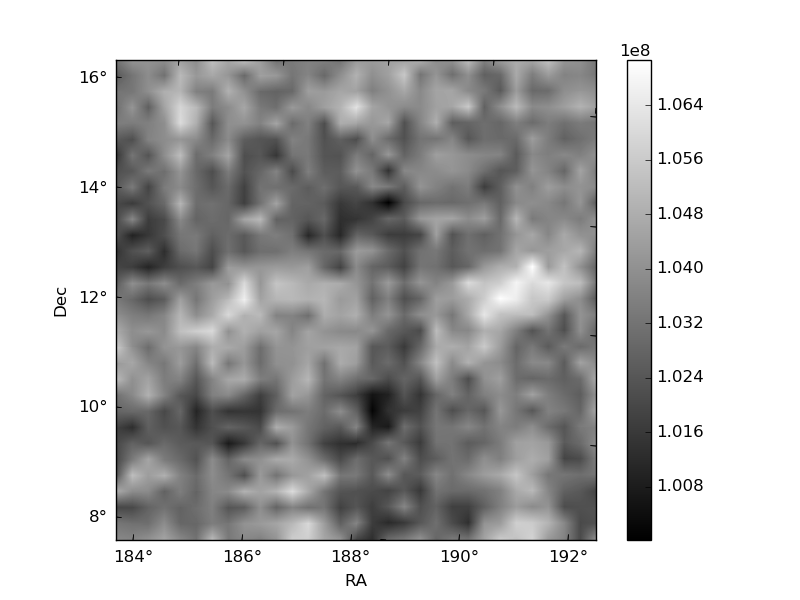
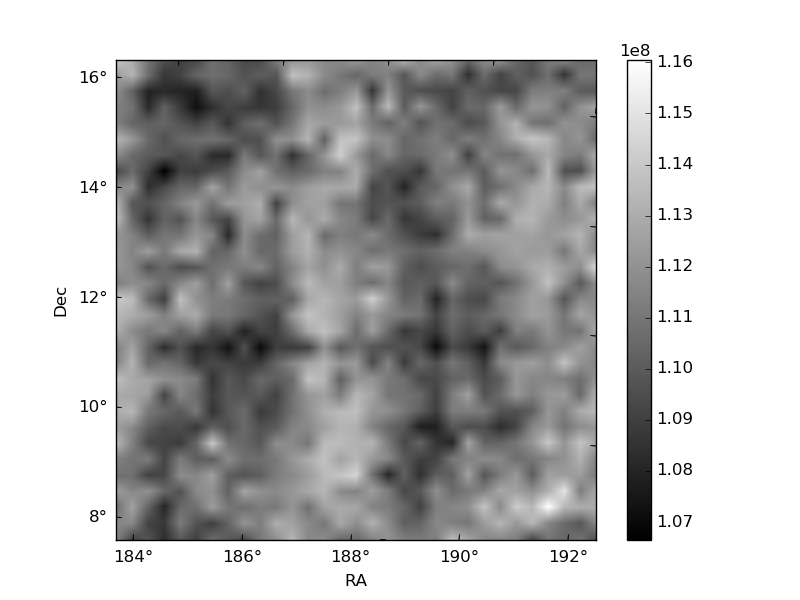
Histogram calculated using DETX and DETY for each event in the final _common_clean file
| Quadrant A | 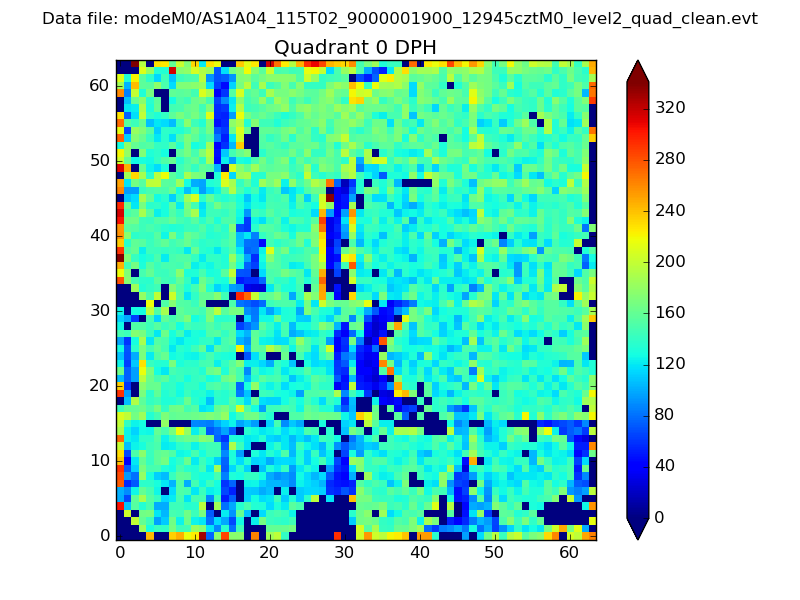 |
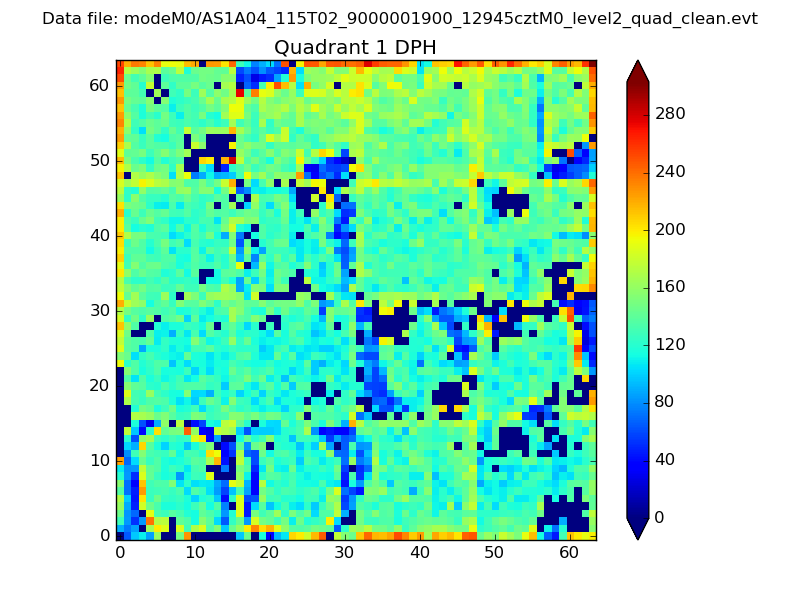 |
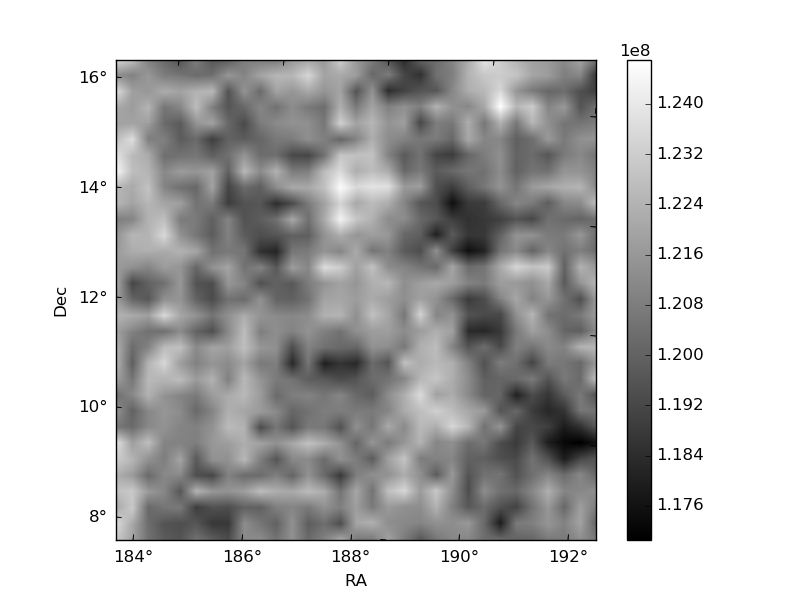
Quadrant B |
|---|---|---|---|
| Quadrant D | 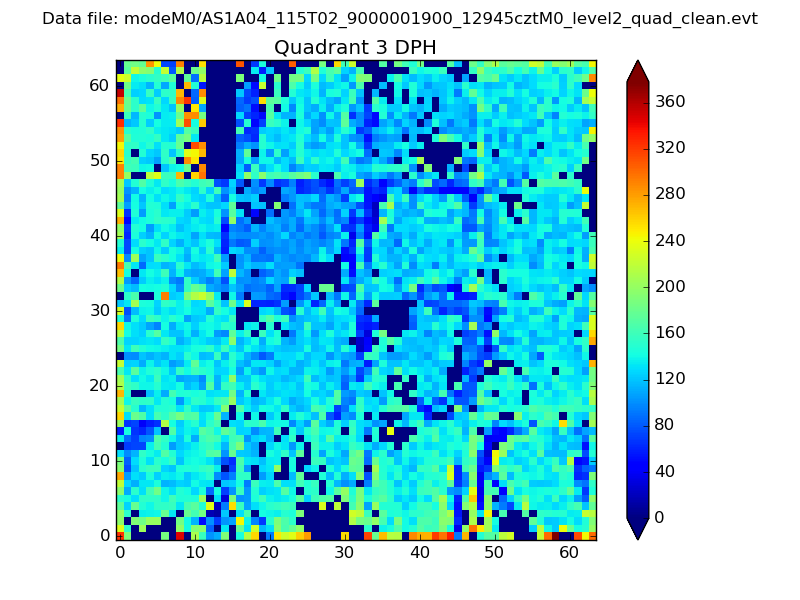 |
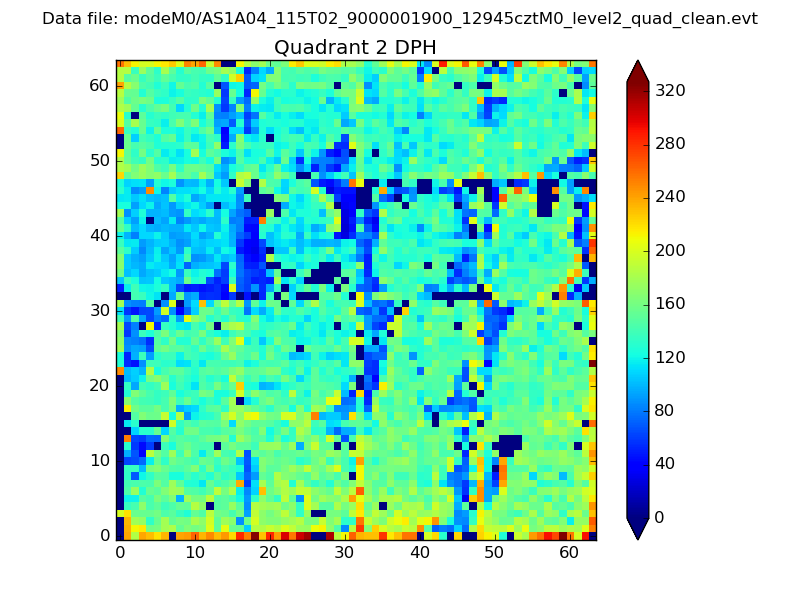 |
Quadrant C |
| Plot type | Count rate plots | Images |
|---|---|---|
| Comparison with Poisson distribution Blue bars denote a histogram of data divided into 1 sec bins. Red curve is a Poisson curve with rate = median count rate of data. |
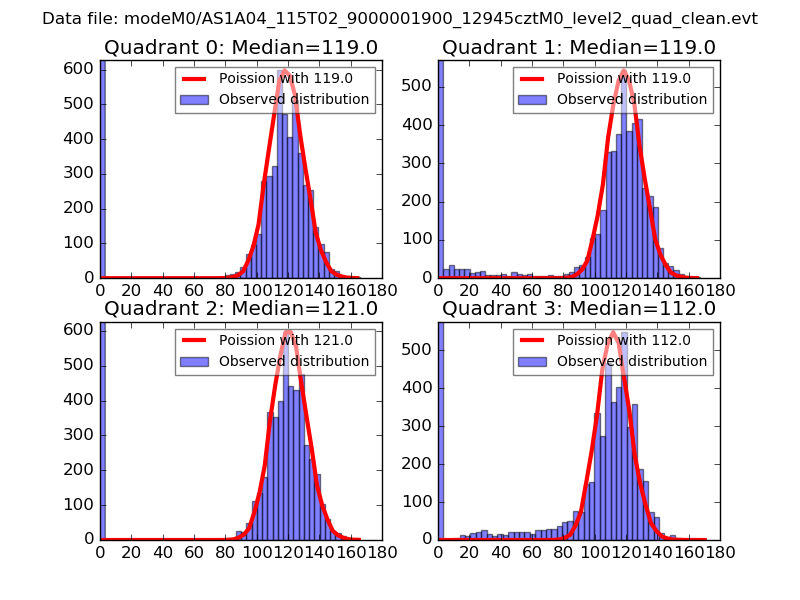 |
 |
| Quadrant-wise count rates Data is divided into 100 sec bins |
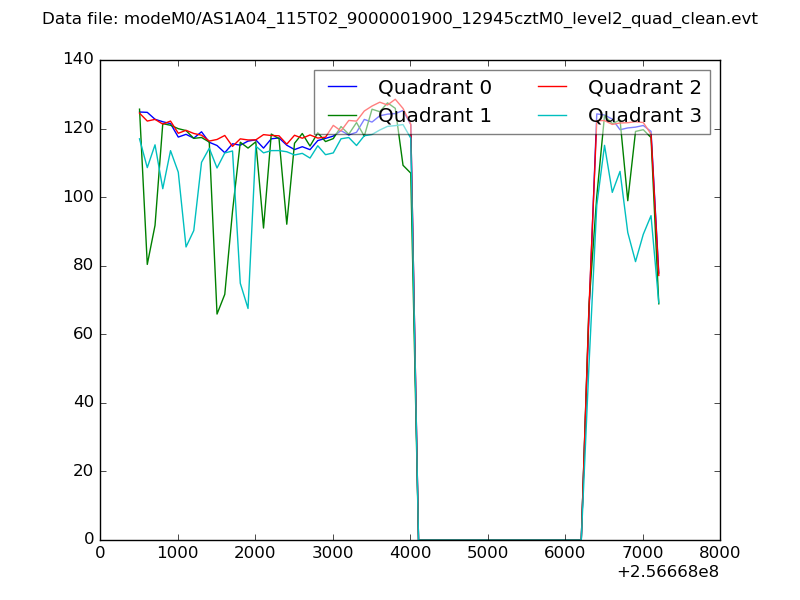 |
|
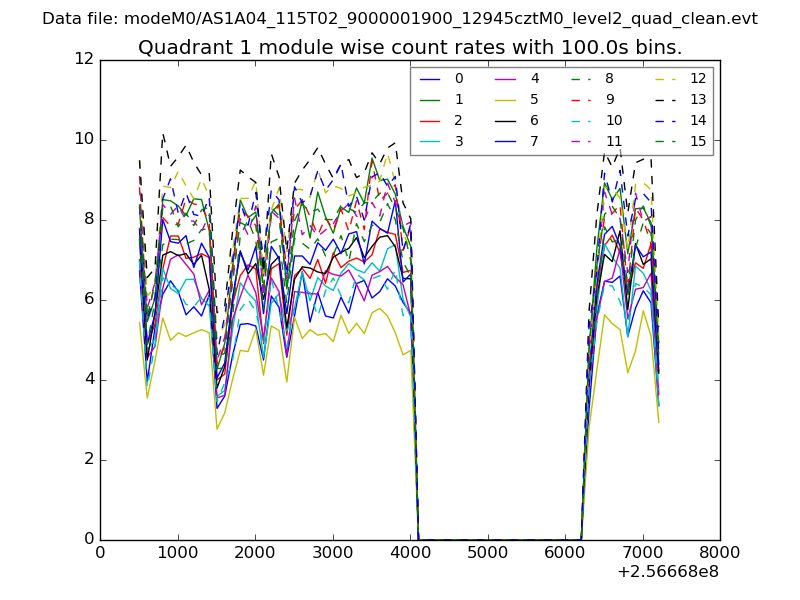
| Module-wise count rates for Quadrant A Data is divided into 100 sec bins |
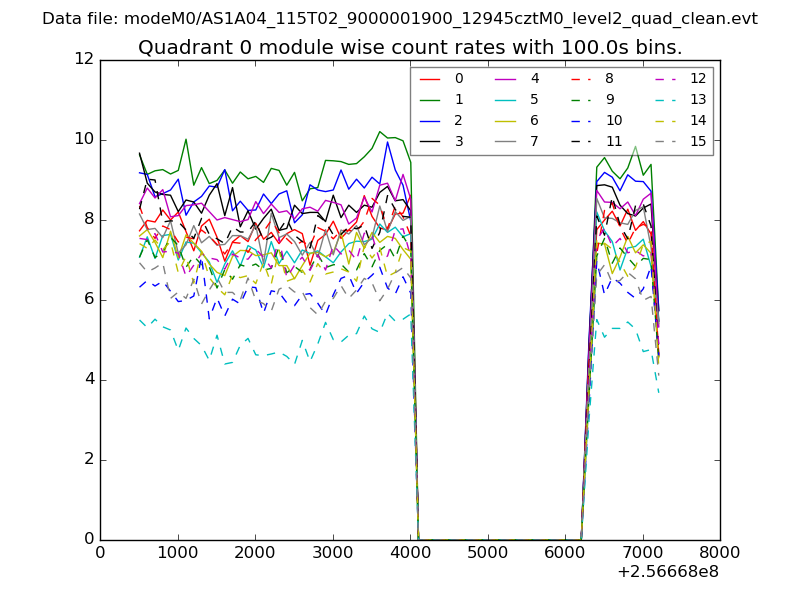 |
 |
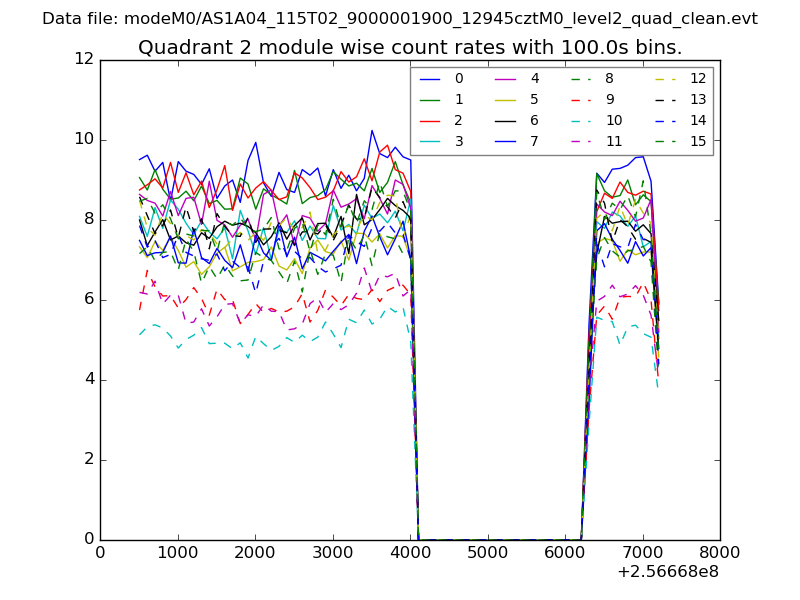
| Module-wise count rates for Quadrant B Data is divided into 100 sec bins |
 |
 |
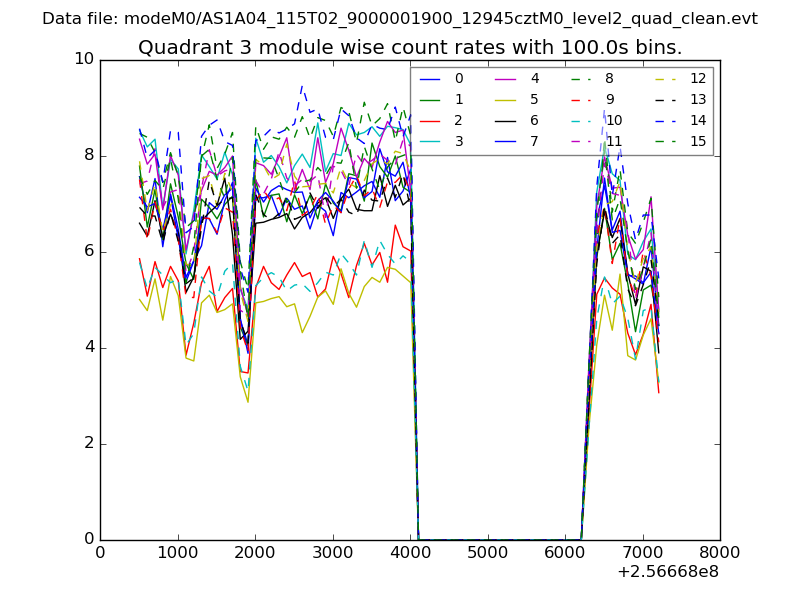
| Module-wise count rates for Quadrant C Data is divided into 100 sec bins |
 |
 |
| Module-wise count rates for Quadrant D Data is divided into 100 sec bins |
 |
 |
| Parameter | Plot |
|---|---|
| CZT HV Monitor | 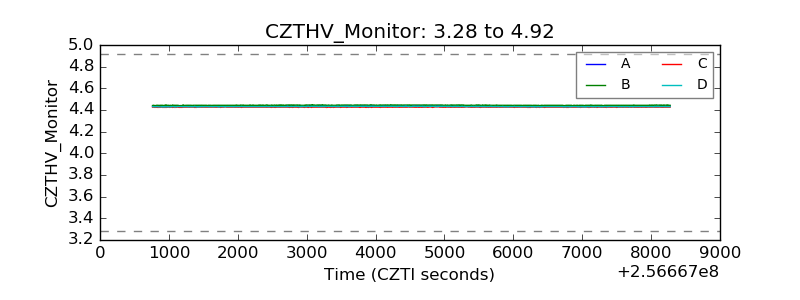 |
| D_VDD | 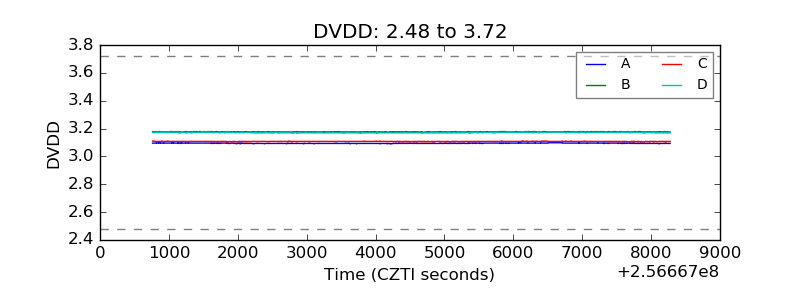 |
| Temperature 1 | 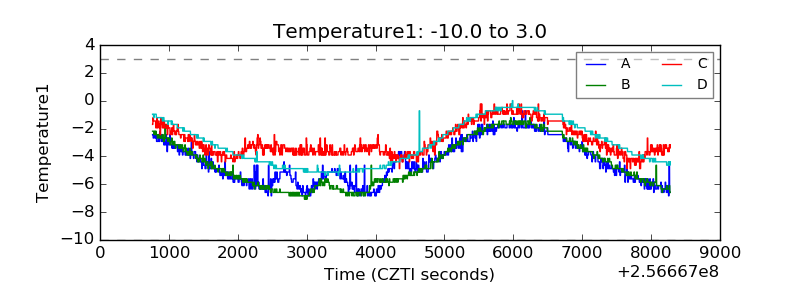 |
| Veto HV Monitor | 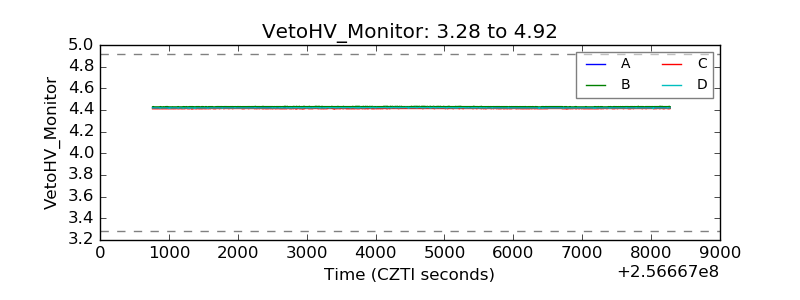 |
| Veto LLD | 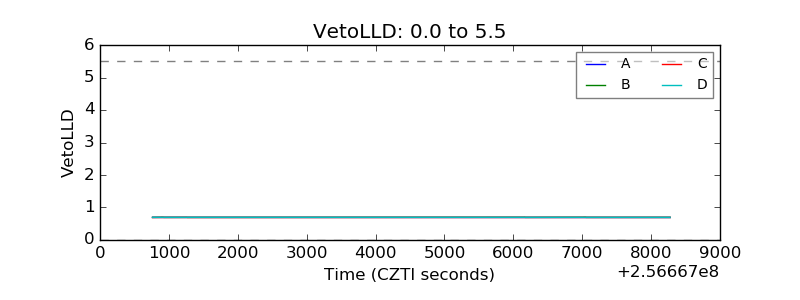 |
| Alpha Counter | 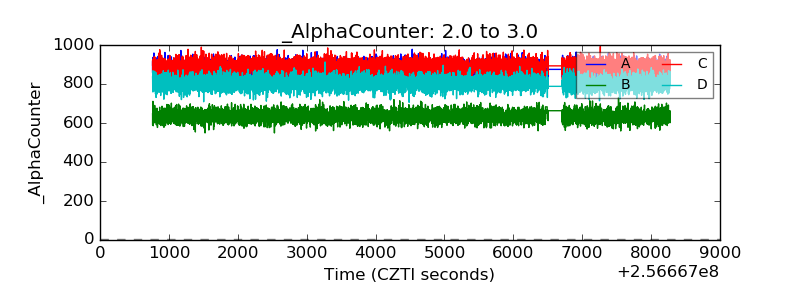 |
| _CPM_Rate | 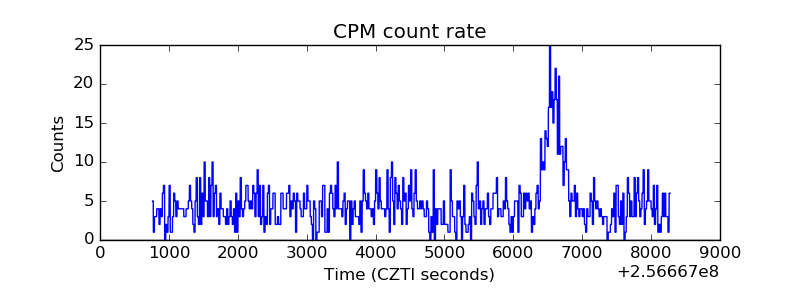 |
| CZT Counter | 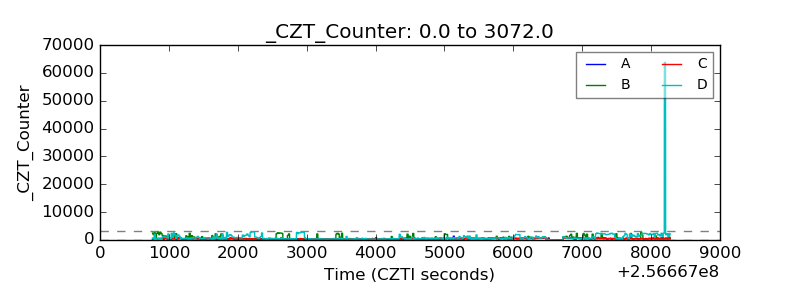 |
| +2.5 Volts monitor |  |
| +5 Volts monitor |  |
| _ROLL_ROT | 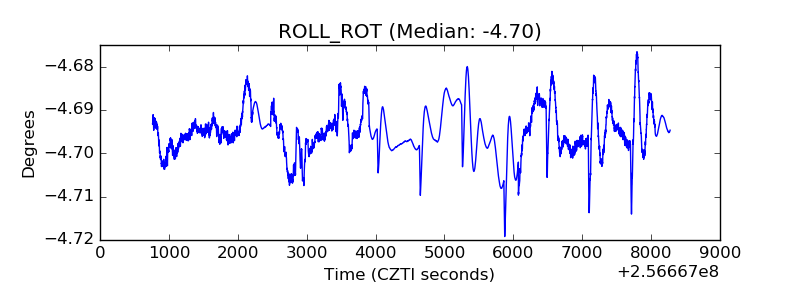 |
| _Roll_DEC |  |
| _Roll_RA | 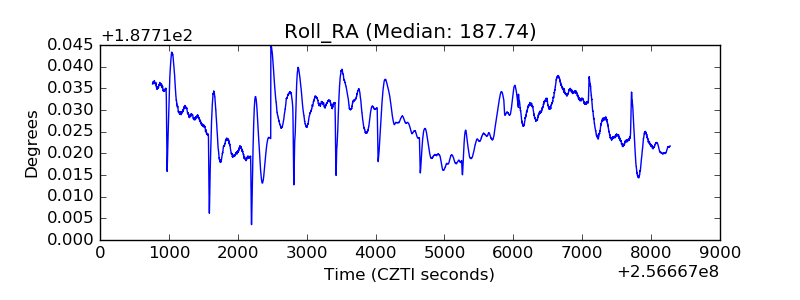 |
| Veto Counter | 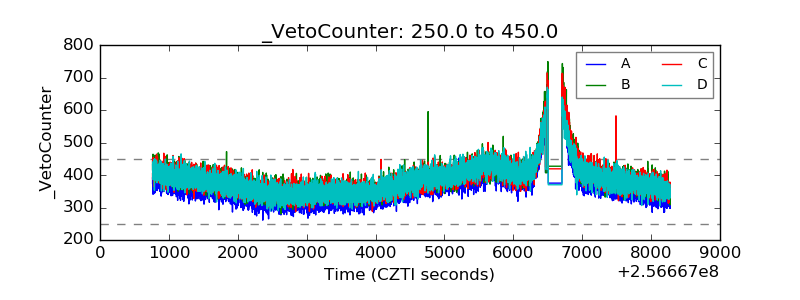 |