| Param | Original file | Final file |
|---|---|---|
| Filename | modeM0/AS1A04_115T02_9000001900_12949cztM0_level2.evt | modeM0/AS1A04_115T02_9000001900_12949cztM0_level2_quad_clean.evt |
| Size (bytes) | 1,652,132,160 | 206,308,800 |
| Size | 1.5 GB | 196.8 MB |
| Events in quadrant A | 9,567,812 | 1,305,174 |
| Events in quadrant B | 15,109,690 | 1,126,517 |
| Events in quadrant C | 8,462,032 | 1,323,530 |
| Events in quadrant D | 15,642,963 | 1,212,220 |
| Mode SS | |||
|---|---|---|---|
| Quadrant | BADHDUFLAG | Total packets | Discarded packets |
| A | 0 | 378 | 0 |
| B | 0 | 378 | 0 |
| C | 0 | 378 | 0 |
| D | 0 | 378 | 0 |
| Mode M9 | |||
|---|---|---|---|
| Quadrant | BADHDUFLAG | Total packets | Discarded packets |
| A | 0 | 21 | 0 |
| B | 0 | 21 | 0 |
| C | 0 | 21 | 0 |
| D | 0 | 21 | 0 |
| Mode M0 | |||
|---|---|---|---|
| Quadrant | BADHDUFLAG | Total packets | Discarded packets |
| A | 0 | 40645 | 5 |
| B | 0 | 57305 | 5 |
| C | 0 | 37957 | 5 |
| D | 0 | 59230 | 5 |
| Quadrant | Total seconds | Saturated seconds | Saturation percentage |
|---|---|---|---|
| A | 18568 | 166 | 0.894011% |
| B | 18568 | 3085 | 16.614606% |
| C | 18568 | 73 | 0.393150% |
| D | 18568 | 1989 | 10.711978% |
Noise dominated data is calculated using 1-second bins in cleaned event files. If a bin has >2000 counts, and if more than 50% of those come from <1% of pixels, then it is considered to be noise-dominated and hence unusable.
| Quadrant | # 1 sec bins | Bins with >0 counts | Bins with >2000 counts | High rate bins dominated by noise | Noise dominated (total time) | Noise dominated (detector-on time) | Marked lightcurve |
|---|---|---|---|---|---|---|---|
| A | 20639 | 18574 | 1 | 1 | 0.00% | 0.01% | 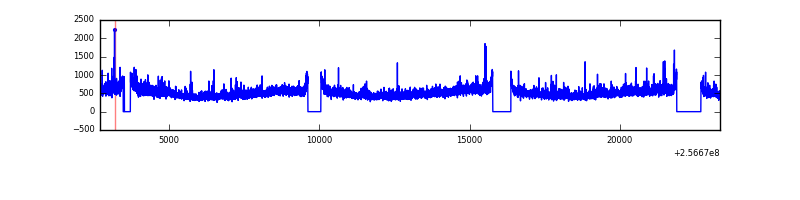 |
| B | 20639 | 18572 | 1728 | 1728 | 8.37% | 9.30% | 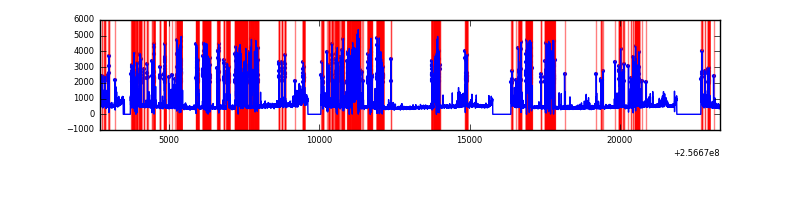 |
| C | 20639 | 18574 | 4 | 4 | 0.02% | 0.02% | 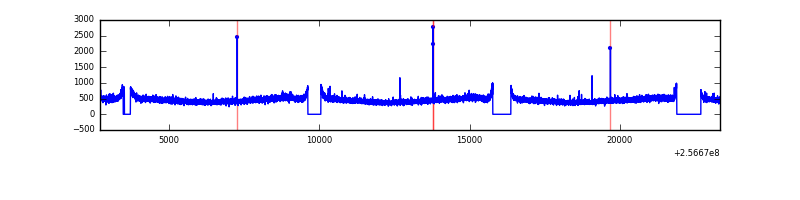 |
| D | 20639 | 18574 | 1748 | 1748 | 8.47% | 9.41% | 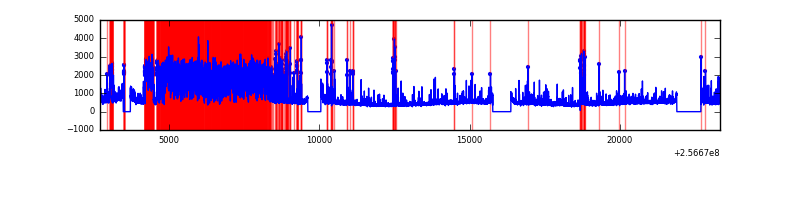 |
Top three noisy pixels from each quadrant. If the there are fewer than three noisy pixels in the level2.evt file, extra rows are filled as -1
| Pixel properties | Quadrant properties | ||||||
|---|---|---|---|---|---|---|---|
| Quadrant | DetID | PixID | Counts | Sigma | Mean | Median | Sigma |
| A | 1 | 162 | 265397 | 582.47 | 2229 | 2175 | 451.9 |
| A | 15 | 239 | 253640 | 556.45 | 2229 | 2175 | 451.9 |
| A | 1 | 178 | 125150 | 272.12 | 2229 | 2175 | 451.9 |
| B | 4 | 239 | 6278189 | 16277.34 | 2009 | 1953 | 385.6 |
| B | 3 | 64 | 739506 | 1912.83 | 2009 | 1953 | 385.6 |
| B | 0 | 214 | 61759 | 155.1 | 2009 | 1953 | 385.6 |
| C | 13 | 61 | 15705 | 27.1 | 2166 | 2178 | 499.2 |
| C | 14 | 234 | 13771 | 23.22 | 2166 | 2178 | 499.2 |
| C | 12 | 4 | 6742 | 9.14 | 2166 | 2178 | 499.2 |
| D | 1 | 52 | 7196644 | 14084.28 | 2104 | 2041 | 510.8 |
| D | 8 | 195 | 402608 | 784.16 | 2104 | 2041 | 510.8 |
| D | 2 | 234 | 69892 | 132.83 | 2104 | 2041 | 510.8 |
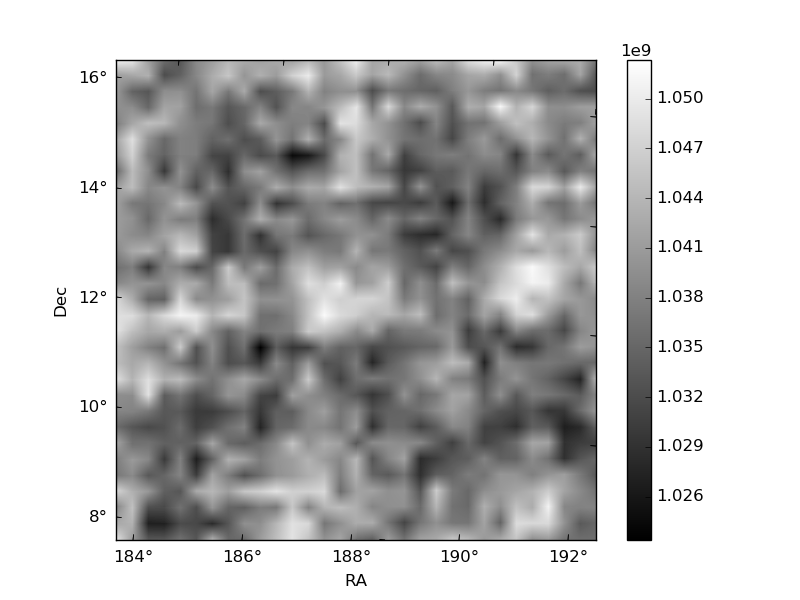
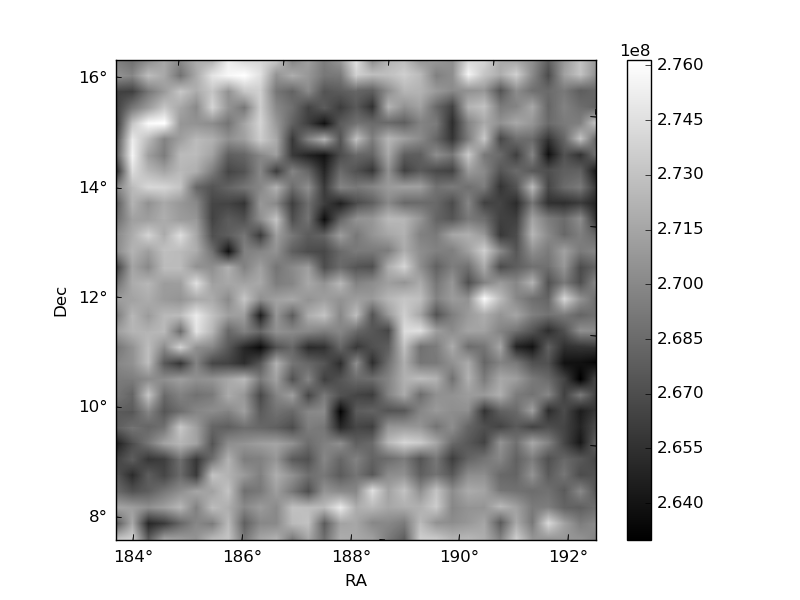
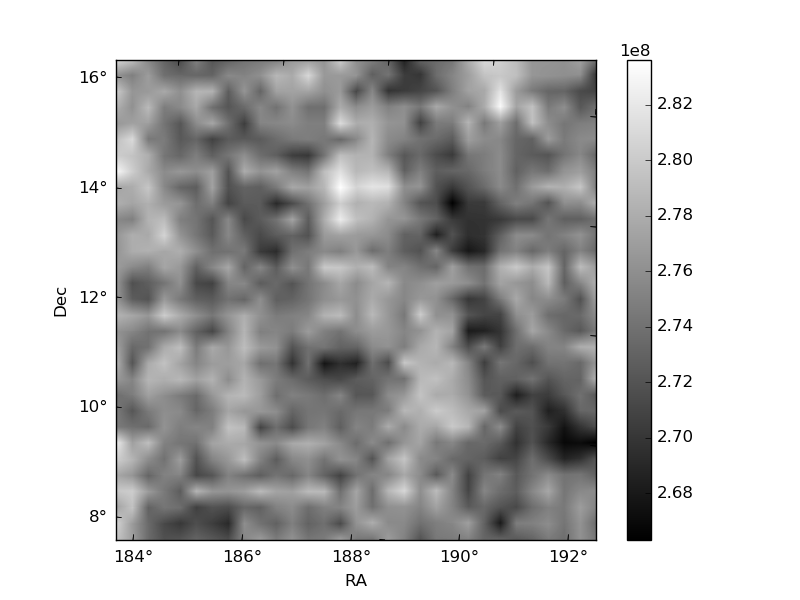
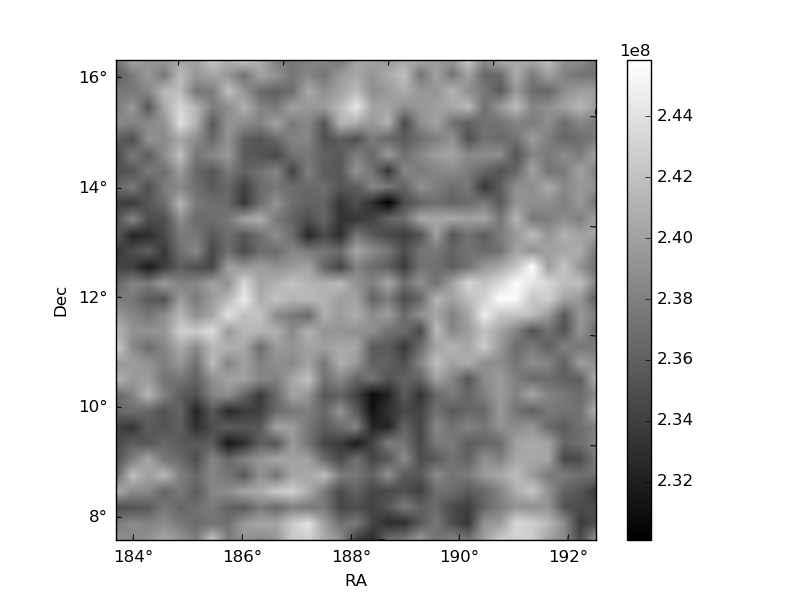
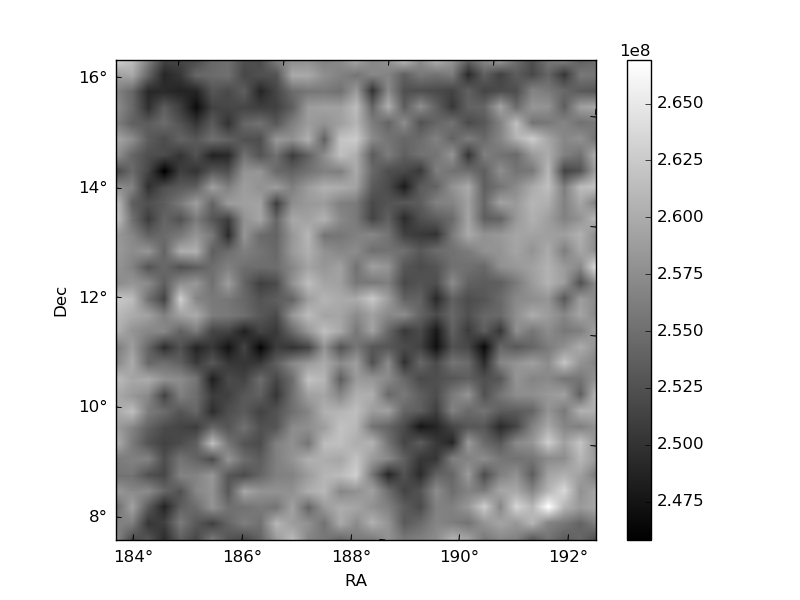
Histogram calculated using DETX and DETY for each event in the final _common_clean file
| Quadrant A | 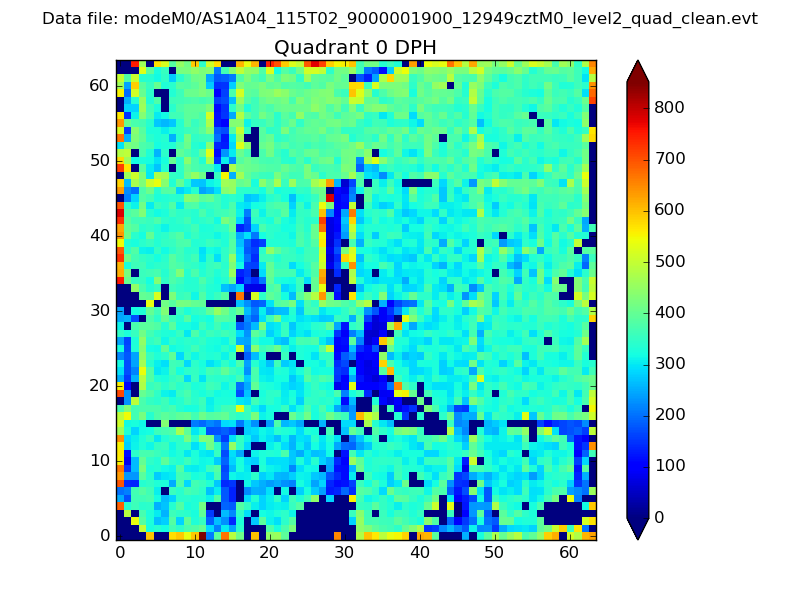 |
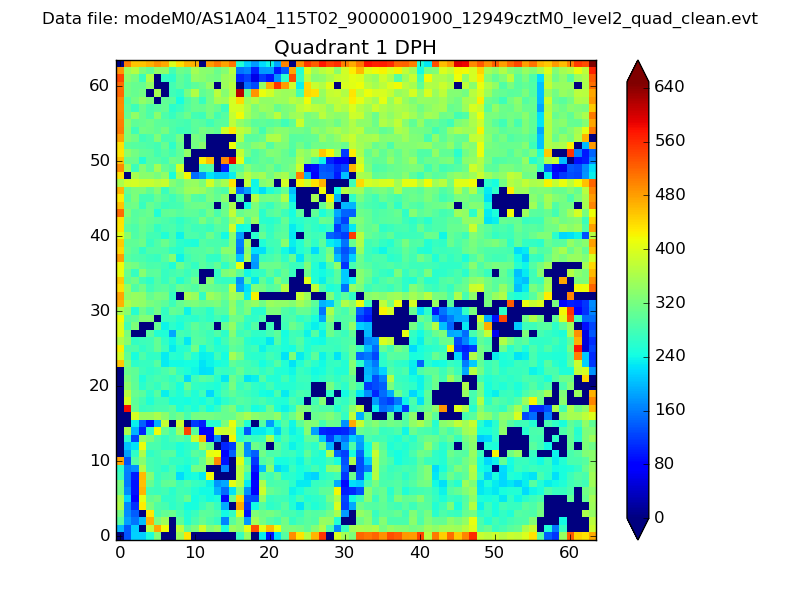 |
Quadrant B |
|---|---|---|---|
| Quadrant D | 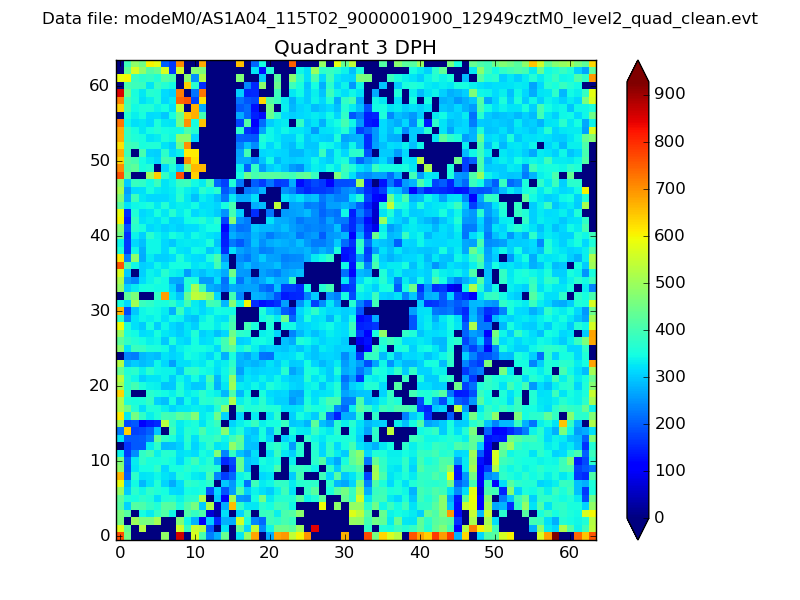 |
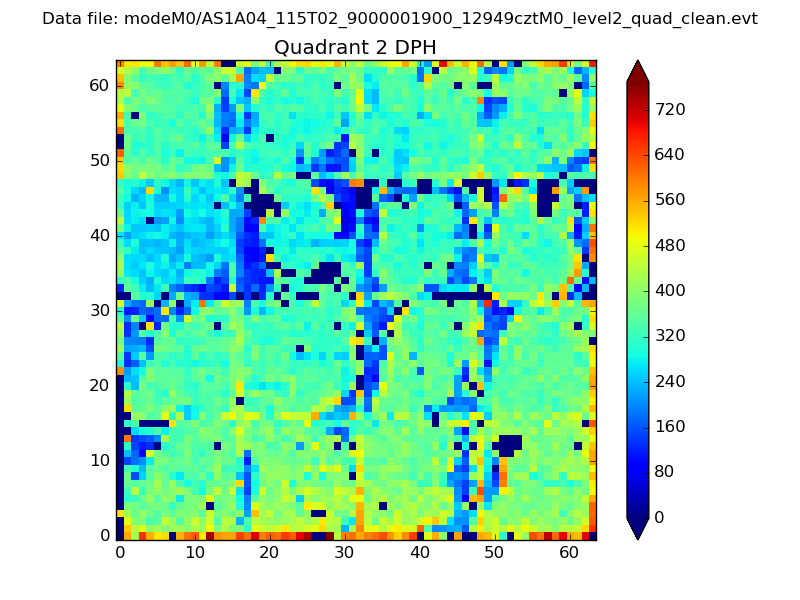 |
Quadrant C |
| Plot type | Count rate plots | Images |
|---|---|---|
| Comparison with Poisson distribution Blue bars denote a histogram of data divided into 1 sec bins. Red curve is a Poisson curve with rate = median count rate of data. |
 |
 |
| Quadrant-wise count rates Data is divided into 100 sec bins |
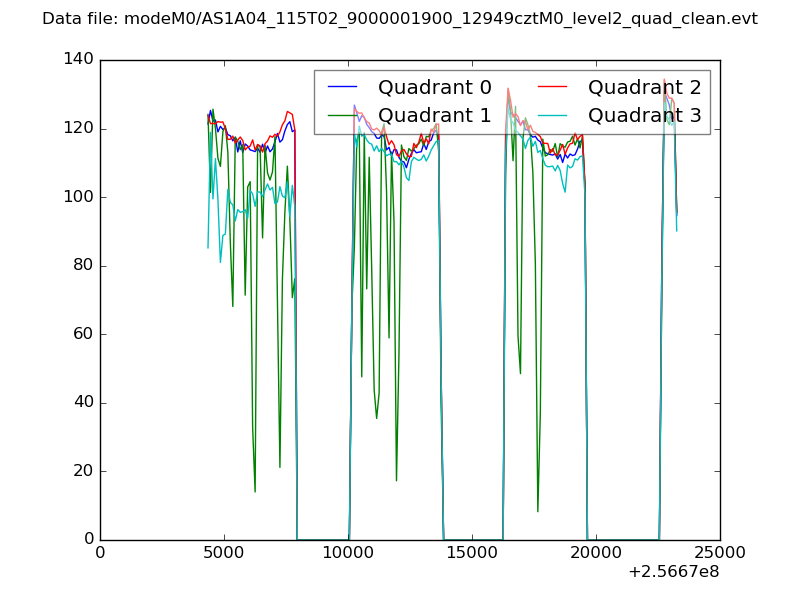 |
|
| Module-wise count rates for Quadrant A Data is divided into 100 sec bins |
 |
 |
| Module-wise count rates for Quadrant B Data is divided into 100 sec bins |
 |
 |
| Module-wise count rates for Quadrant C Data is divided into 100 sec bins |
 |
 |
| Module-wise count rates for Quadrant D Data is divided into 100 sec bins |
 |
 |
| Parameter | Plot |
|---|---|
| CZT HV Monitor | 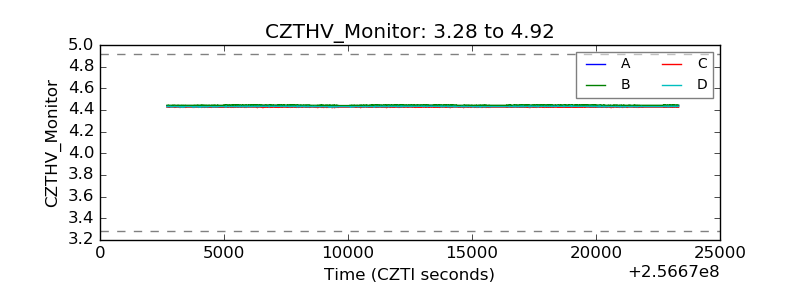 |
| D_VDD | 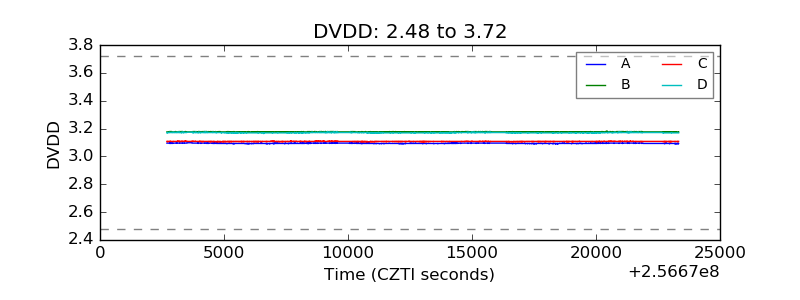 |
| Temperature 1 | 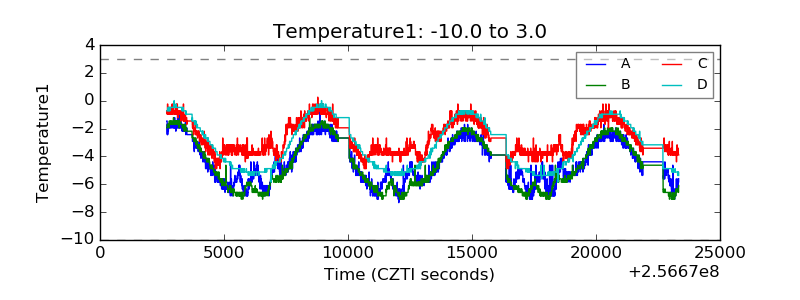 |
| Veto HV Monitor | 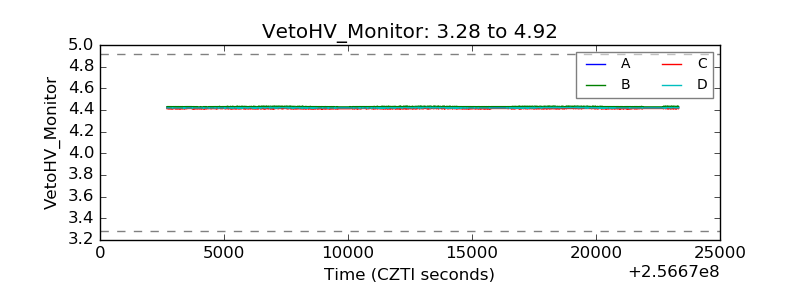 |
| Veto LLD | 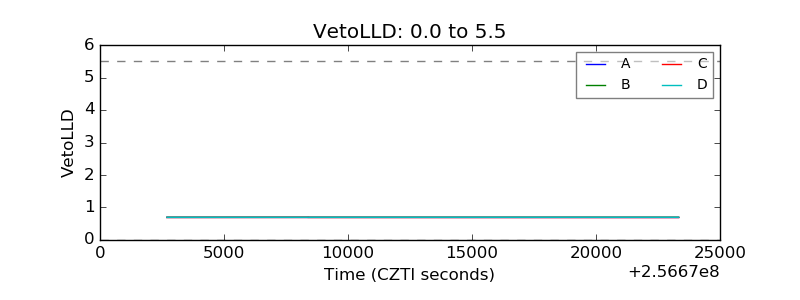 |
| Alpha Counter | 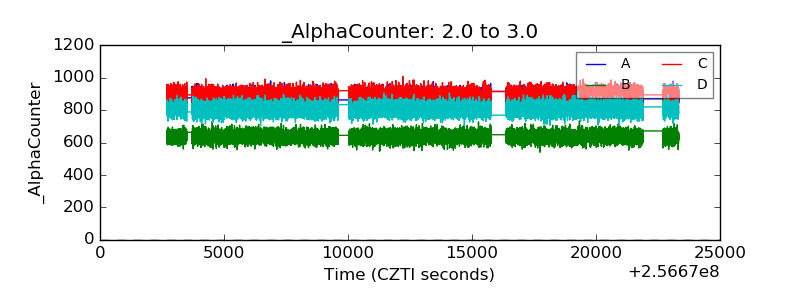 |
| _CPM_Rate | 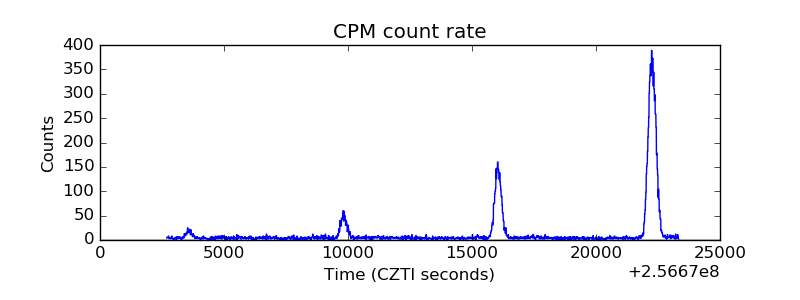 |
| CZT Counter | 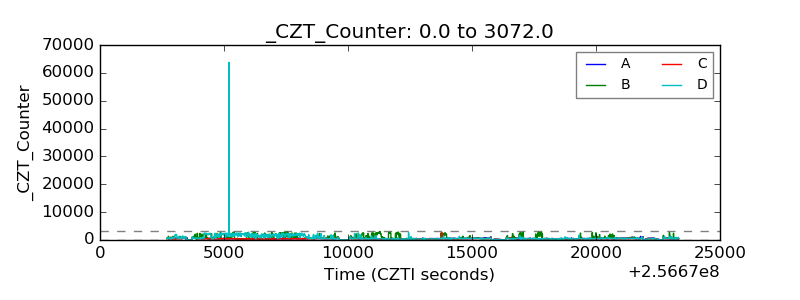 |
| +2.5 Volts monitor |  |
| +5 Volts monitor |  |
| _ROLL_ROT |  |
| _Roll_DEC | 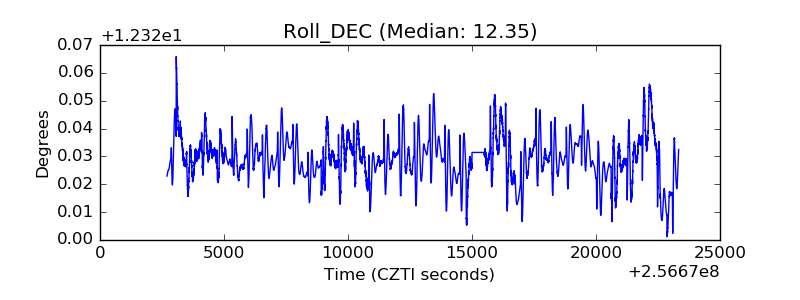 |
| _Roll_RA | 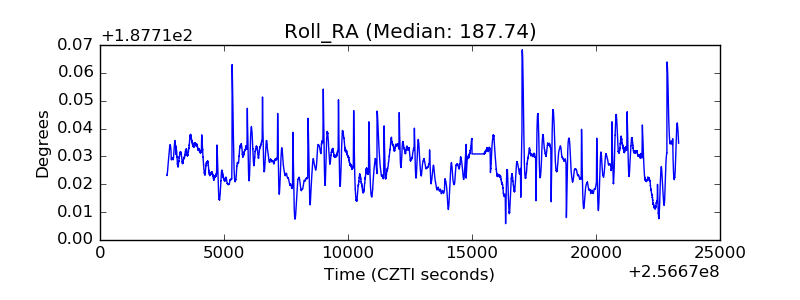 |
| Veto Counter |  |