| Param | Original file | Final file |
|---|---|---|
| Filename | modeM0/AS1A04_224T03_9000001898cztM0_level2.fits | modeM0/AS1A04_224T03_9000001898cztM0_level2_quad_clean.evt |
| Size (bytes) | 127,612,800 | 149,981,760 |
| Size | 121.7 MB | 143.0 MB |
| Events in quadrant A | 777,110 | 959,790 |
| Events in quadrant B | 684,148 | 843,486 |
| Events in quadrant C | 779,600 | 930,464 |
| Events in quadrant D | 680,116 | 865,554 |
| Mode M9 | |||
|---|---|---|---|
| Quadrant | BADHDUFLAG | Total packets | Discarded packets |
| A | 0 | 22 | 0 |
| B | 0 | 22 | 0 |
| C | 0 | 22 | 0 |
| D | 0 | 22 | 0 |
| Mode M0 | |||
|---|---|---|---|
| Quadrant | BADHDUFLAG | Total packets | Discarded packets |
| A | 0 | 33529 | 0 |
| B | 0 | 39847 | 0 |
| C | 0 | 28051 | 0 |
| D | 0 | 29285 | 0 |
| Mode SS | |||
|---|---|---|---|
| Quadrant | BADHDUFLAG | Total packets | Discarded packets |
| A | 0 | 278 | 0 |
| B | 0 | 278 | 0 |
| C | 0 | 278 | 0 |
| D | 0 | 278 | 0 |
| Quadrant | Total seconds | Saturated seconds | Saturation percentage |
|---|---|---|---|
| A | 13657 | 646 | 4.730175% |
| B | 13657 | 2169 | 15.881965% |
| C | 13657 | 283 | 2.072197% |
| D | 13657 | 324 | 2.372410% |
Noise dominated data is calculated using 1-second bins in cleaned event files. If a bin has >2000 counts, and if more than 50% of those come from <1% of pixels, then it is considered to be noise-dominated and hence unusable.
| Quadrant | # 1 sec bins | Bins with >0 counts | Bins with >2000 counts | High rate bins dominated by noise | Noise dominated (total time) | Noise dominated (detector-on time) | Marked lightcurve |
|---|---|---|---|---|---|---|---|
| A | 15707 | 13658 | 0 | 0 | 0.00% | 0.00% |  |
| B | 15706 | 13338 | 0 | 0 | 0.00% | 0.00% | 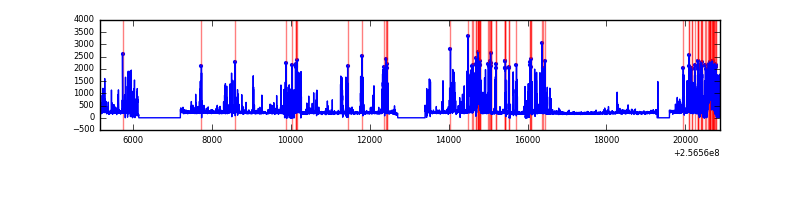 |
| C | 15707 | 13658 | 0 | 0 | 0.00% | 0.00% | 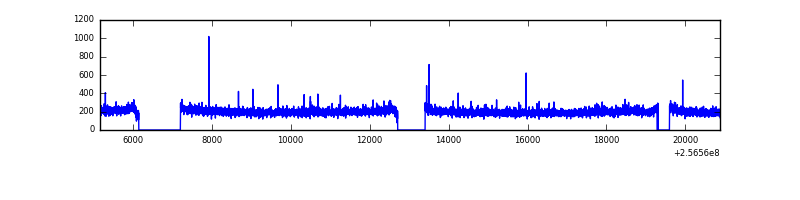 |
| D | 15707 | 13658 | 0 | 0 | 0.00% | 0.00% |  |
Top three noisy pixels from each quadrant. If the there are fewer than three noisy pixels in the level2.evt file, extra rows are filled as -1
| Pixel properties | Quadrant properties | ||||||
|---|---|---|---|---|---|---|---|
| Quadrant | DetID | PixID | Counts | Sigma | Mean | Median | Sigma |
| A | 14 | 188 | 795 | 11.75 | 201 | 190 | 51.5 |
| A | 0 | 29 | 780 | 11.46 | 201 | 190 | 51.5 |
| A | 14 | 204 | 667 | 9.26 | 201 | 190 | 51.5 |
| B | 2 | 9 | 592 | 11.2 | 180 | 173 | 37.4 |
| B | 3 | 17 | 447 | 7.33 | 180 | 173 | 37.4 |
| B | 2 | 8 | 446 | 7.3 | 180 | 173 | 37.4 |
| C | 1 | 81 | 594 | 7.34 | 206 | 192 | 54.7 |
| C | 1 | 80 | 584 | 7.16 | 206 | 192 | 54.7 |
| C | 1 | 65 | 518 | 5.95 | 206 | 192 | 54.7 |
| D | 6 | 231 | 528 | 6.69 | 193 | 176 | 52.6 |
| D | 4 | 246 | 520 | 6.53 | 193 | 176 | 52.6 |
| D | 10 | 189 | 512 | 6.38 | 193 | 176 | 52.6 |
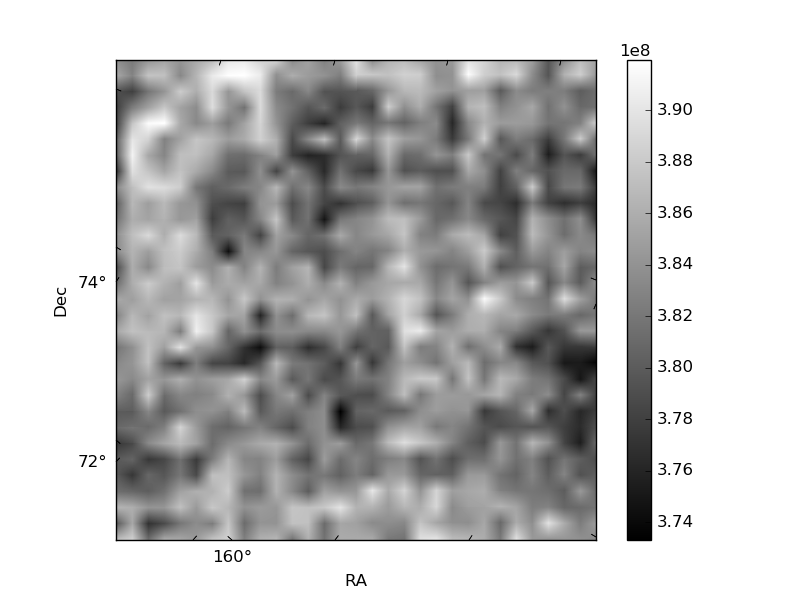
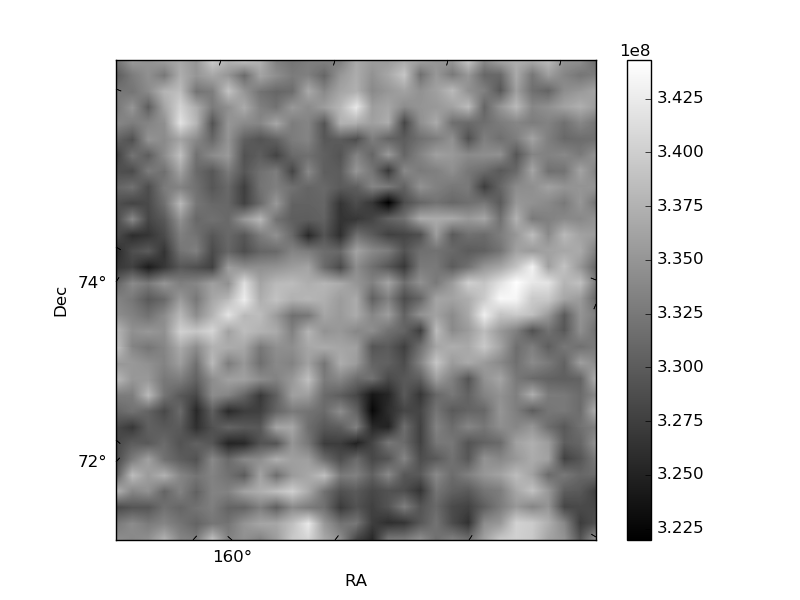
Histogram calculated using DETX and DETY for each event in the final _common_clean file
| Quadrant A |  |
 |
Quadrant B |
|---|---|---|---|
| Quadrant D |  |
 |
Quadrant C |
| Plot type | Count rate plots | Images |
|---|---|---|
| Comparison with Poisson distribution Blue bars denote a histogram of data divided into 1 sec bins. Red curve is a Poisson curve with rate = median count rate of data. |
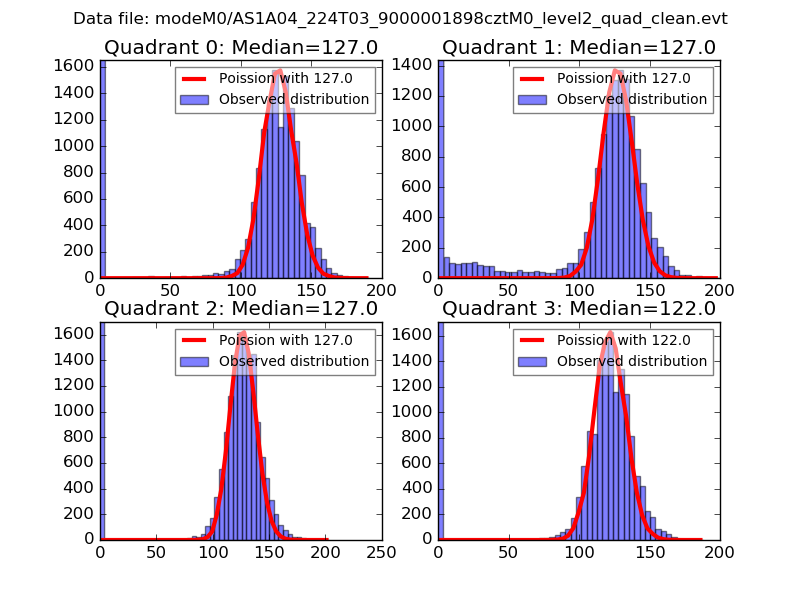 |
 |
| Quadrant-wise count rates Data is divided into 100 sec bins |
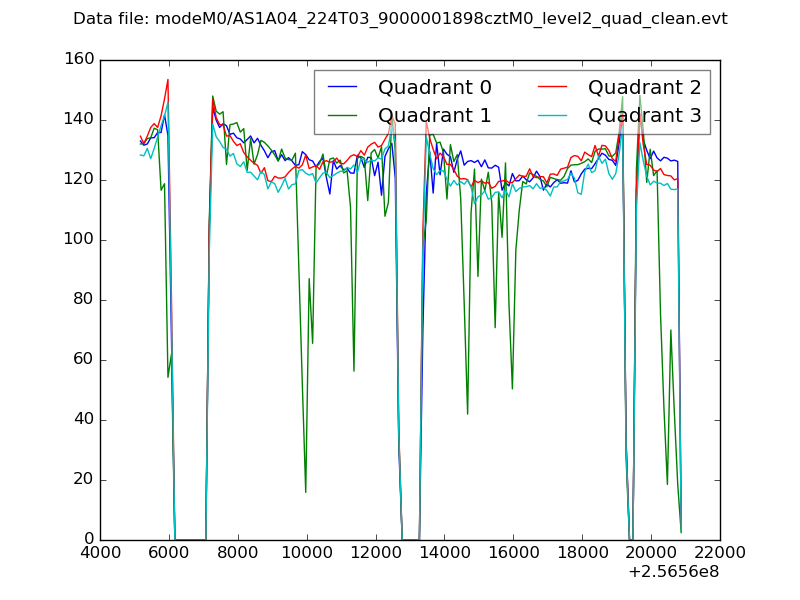 |
|
| Module-wise count rates for Quadrant A Data is divided into 100 sec bins |
 |
 |
| Module-wise count rates for Quadrant B Data is divided into 100 sec bins |
 |
 |
| Module-wise count rates for Quadrant C Data is divided into 100 sec bins |
 |
 |
| Module-wise count rates for Quadrant D Data is divided into 100 sec bins |
 |
 |
| Parameter | Plot |
|---|---|
| CZT HV Monitor |  |
| D_VDD |  |
| Temperature 1 |  |
| Veto HV Monitor | 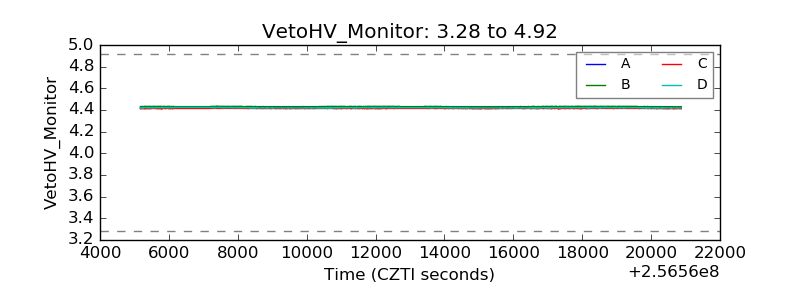 |
| Veto LLD |  |
| Alpha Counter | 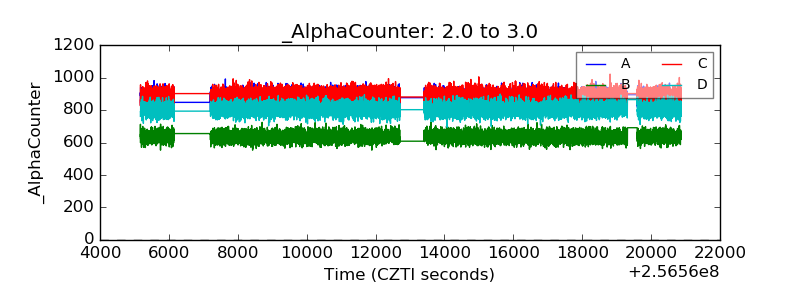 |
| _CPM_Rate |  |
| CZT Counter |  |
| +2.5 Volts monitor | 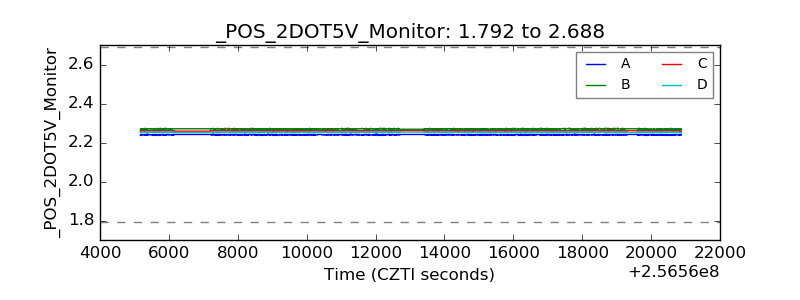 |
| +5 Volts monitor | 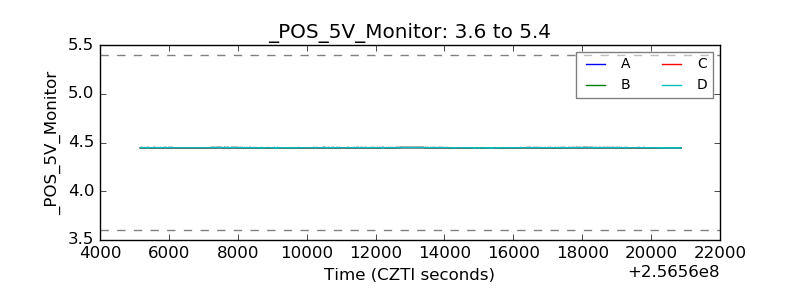 |
| _ROLL_ROT | 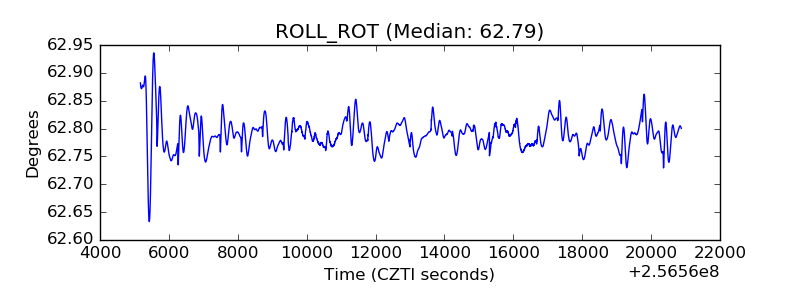 |
| _Roll_DEC | 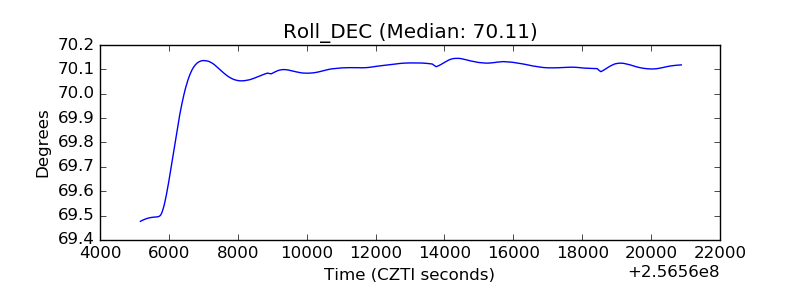 |
| _Roll_RA |  |
| Veto Counter |  |