| Param | Original file | Final file |
|---|---|---|
| Filename | modeM0/AS1A04_224T03_9000001898_12927cztM0_level2.evt | modeM0/AS1A04_224T03_9000001898_12927cztM0_level2_quad_clean.evt |
| Size (bytes) | 202,662,720 | 51,670,080 |
| Size | 193.3 MB | 49.3 MB |
| Events in quadrant A | 1,505,916 | 351,182 |
| Events in quadrant B | 1,782,467 | 338,032 |
| Events in quadrant C | 1,284,942 | 351,261 |
| Events in quadrant D | 1,384,690 | 336,827 |
| Mode M9 | |||
|---|---|---|---|
| Quadrant | BADHDUFLAG | Total packets | Discarded packets |
| A | 0 | 11 | 0 |
| B | 0 | 11 | 0 |
| C | 0 | 11 | 0 |
| D | 0 | 11 | 0 |
| Mode M0 | |||
|---|---|---|---|
| Quadrant | BADHDUFLAG | Total packets | Discarded packets |
| A | 0 | 6152 | 2 |
| B | 0 | 6889 | 1 |
| C | 0 | 5511 | 1 |
| D | 0 | 5837 | 1 |
| Mode SS | |||
|---|---|---|---|
| Quadrant | BADHDUFLAG | Total packets | Discarded packets |
| A | 0 | 54 | 0 |
| B | 0 | 54 | 0 |
| C | 0 | 54 | 0 |
| D | 0 | 54 | 0 |
| Quadrant | Total seconds | Saturated seconds | Saturation percentage |
|---|---|---|---|
| A | 2611 | 163 | 6.242819% |
| B | 2611 | 310 | 11.872846% |
| C | 2611 | 128 | 4.902336% |
| D | 2611 | 138 | 5.285331% |
Noise dominated data is calculated using 1-second bins in cleaned event files. If a bin has >2000 counts, and if more than 50% of those come from <1% of pixels, then it is considered to be noise-dominated and hence unusable.
| Quadrant | # 1 sec bins | Bins with >0 counts | Bins with >2000 counts | High rate bins dominated by noise | Noise dominated (total time) | Noise dominated (detector-on time) | Marked lightcurve |
|---|---|---|---|---|---|---|---|
| A | 3667 | 2613 | 0 | 0 | 0.00% | 0.00% | 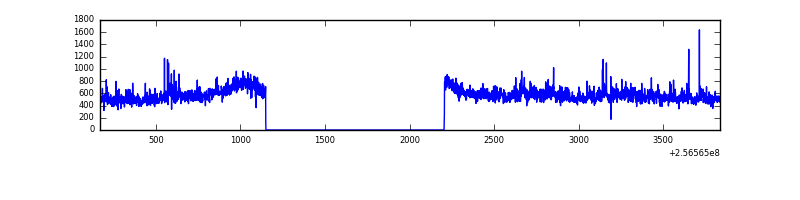 |
| B | 3667 | 2613 | 111 | 111 | 3.03% | 4.25% | 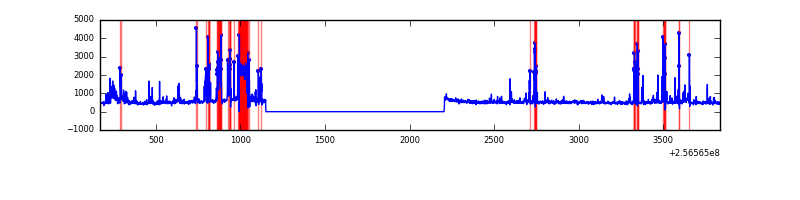 |
| C | 3667 | 2613 | 0 | 0 | 0.00% | 0.00% | 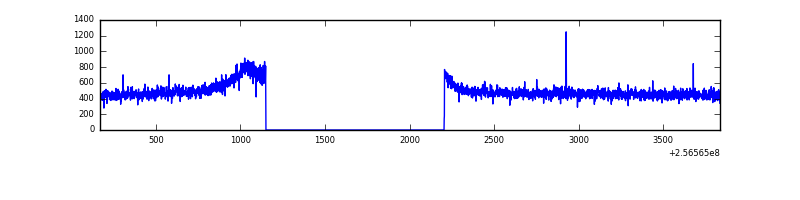 |
| D | 3667 | 2613 | 9 | 9 | 0.25% | 0.34% |  |
Top three noisy pixels from each quadrant. If the there are fewer than three noisy pixels in the level2.evt file, extra rows are filled as -1
| Pixel properties | Quadrant properties | ||||||
|---|---|---|---|---|---|---|---|
| Quadrant | DetID | PixID | Counts | Sigma | Mean | Median | Sigma |
| A | 15 | 239 | 52248 | 739.72 | 341 | 333 | 70.2 |
| A | 1 | 162 | 44827 | 633.98 | 341 | 333 | 70.2 |
| A | 12 | 189 | 37282 | 526.48 | 341 | 333 | 70.2 |
| B | 4 | 239 | 471616 | 7735.31 | 318 | 309 | 60.9 |
| B | 3 | 64 | 54127 | 883.29 | 318 | 309 | 60.9 |
| B | 0 | 214 | 12586 | 201.5 | 318 | 309 | 60.9 |
| C | 13 | 61 | 2380 | 27.11 | 328 | 327 | 75.7 |
| C | 12 | 4 | 1774 | 19.11 | 328 | 327 | 75.7 |
| C | 8 | 222 | 1568 | 16.39 | 328 | 327 | 75.7 |
| D | 1 | 52 | 71105 | 910.25 | 328 | 317 | 77.8 |
| D | 8 | 195 | 25175 | 319.65 | 328 | 317 | 77.8 |
| D | 10 | 157 | 22110 | 280.23 | 328 | 317 | 77.8 |
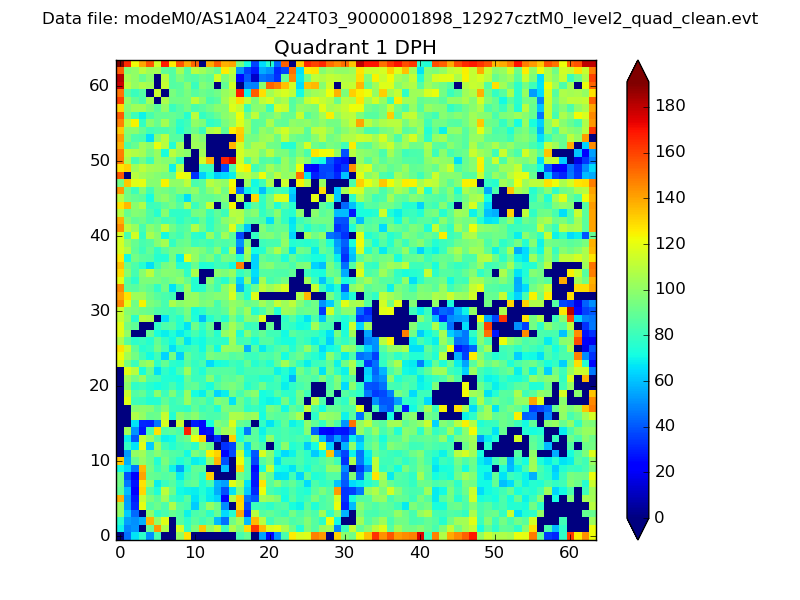
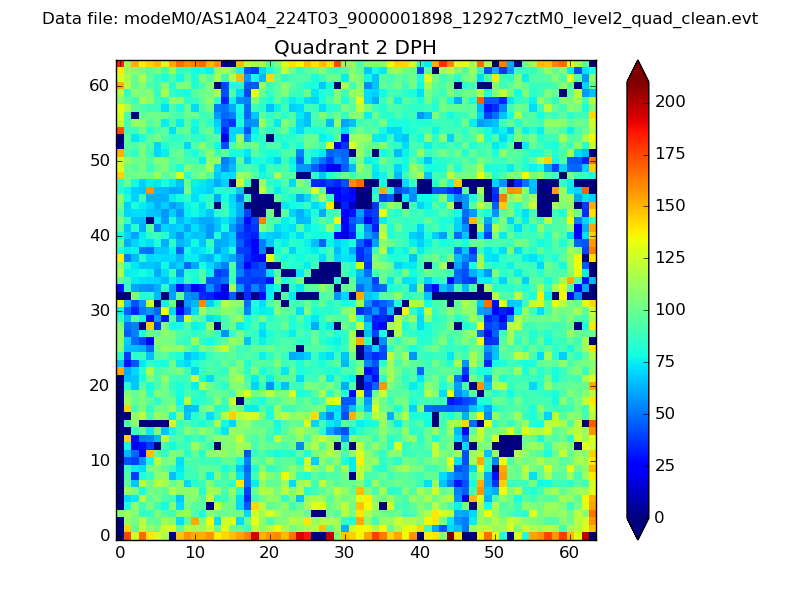
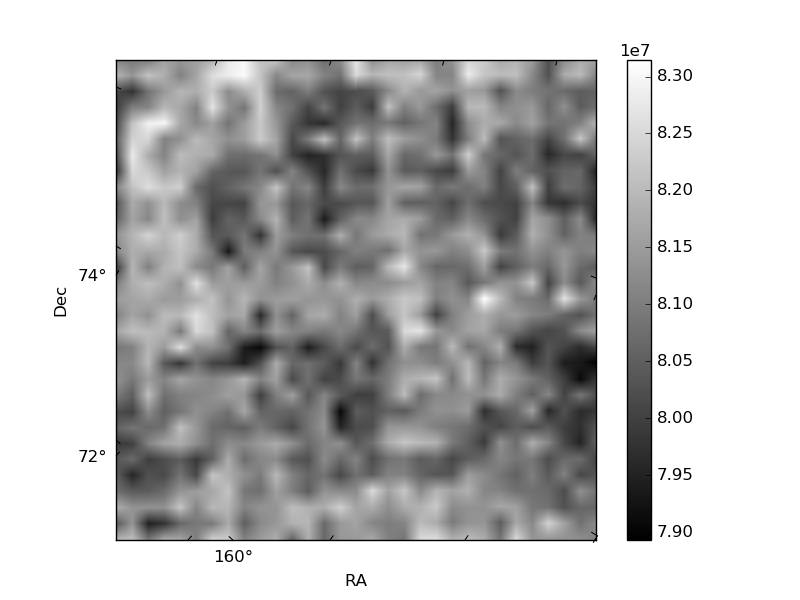
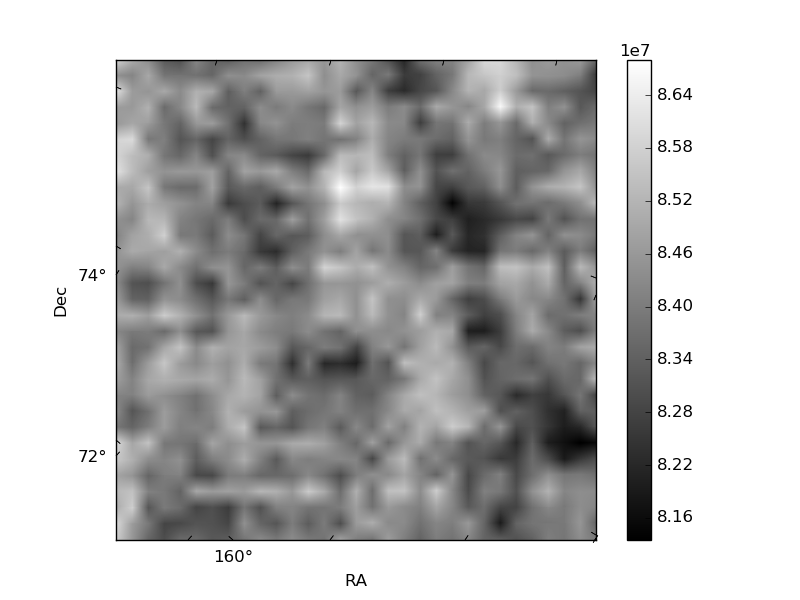
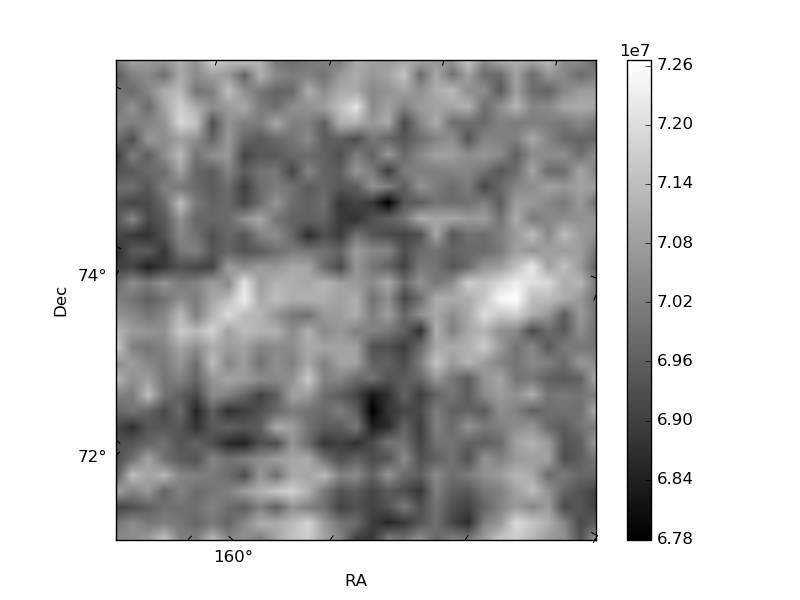
Histogram calculated using DETX and DETY for each event in the final _common_clean file
| Quadrant A | 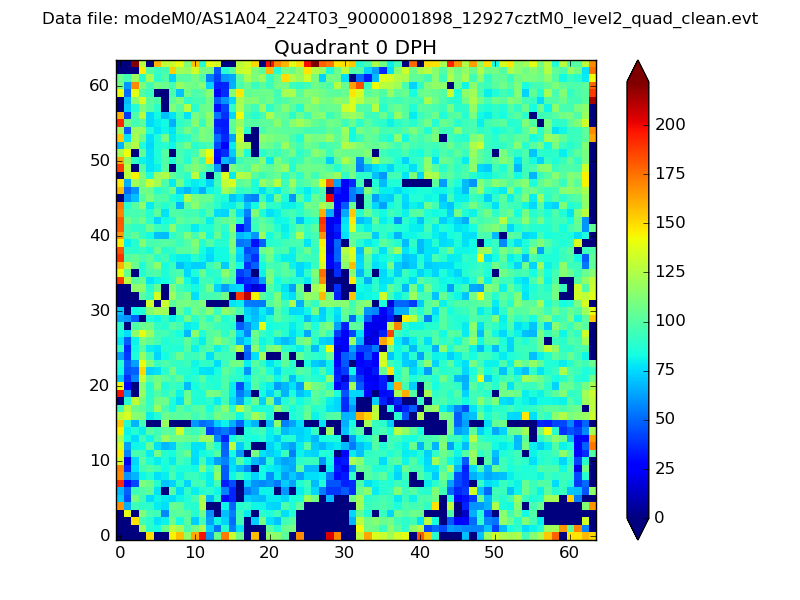 |
 |
Quadrant B |
|---|---|---|---|
| Quadrant D | 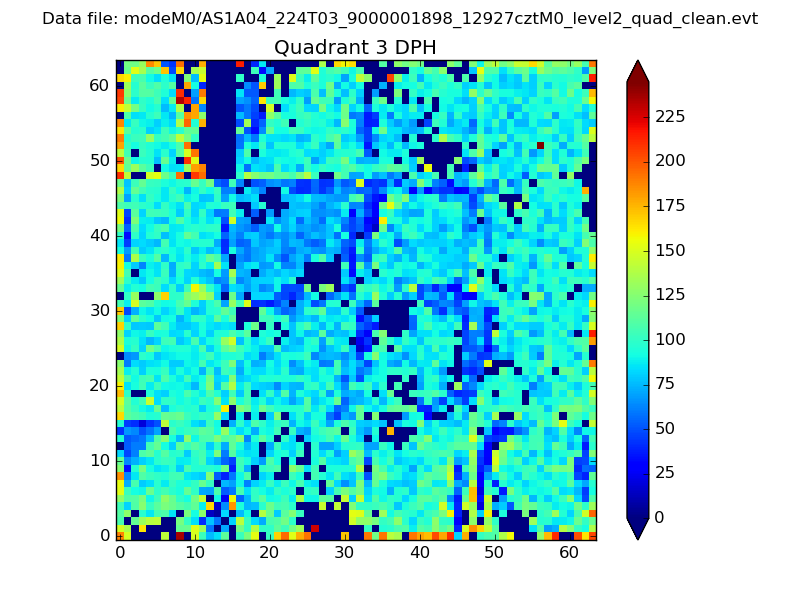 |
 |
Quadrant C |
| Plot type | Count rate plots | Images |
|---|---|---|
| Comparison with Poisson distribution Blue bars denote a histogram of data divided into 1 sec bins. Red curve is a Poisson curve with rate = median count rate of data. |
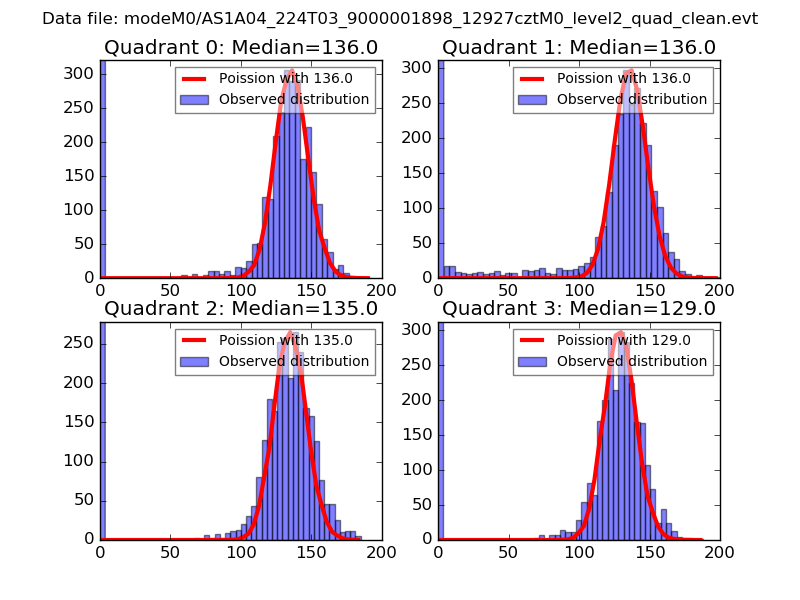 |
 |
| Quadrant-wise count rates Data is divided into 100 sec bins |
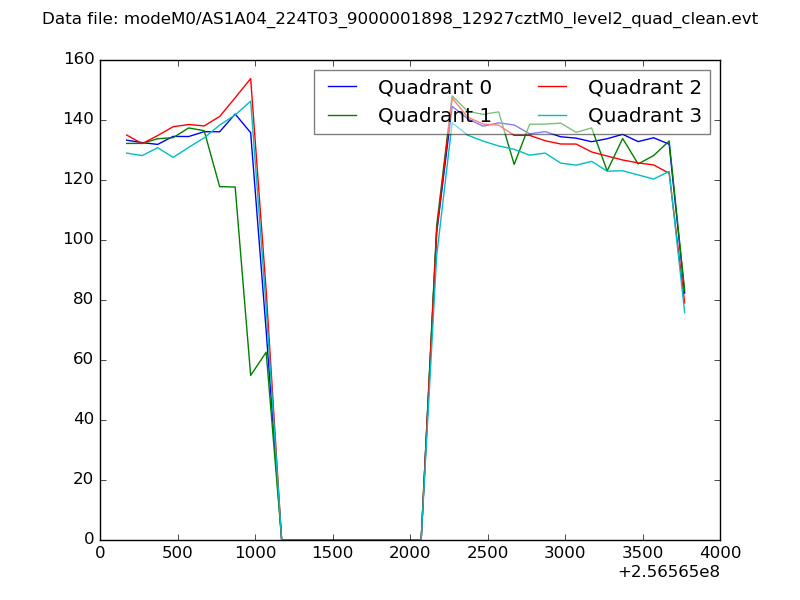 |
|
| Module-wise count rates for Quadrant A Data is divided into 100 sec bins |
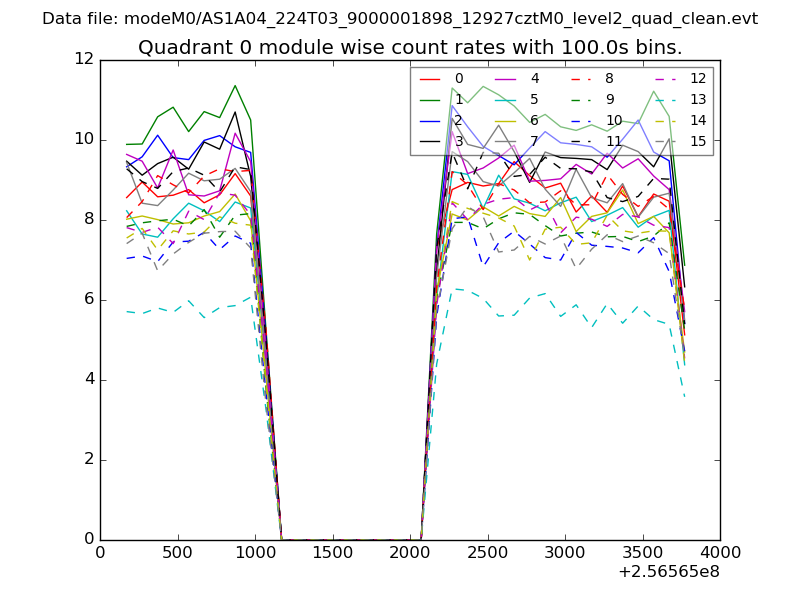 |
 |
| Module-wise count rates for Quadrant B Data is divided into 100 sec bins |
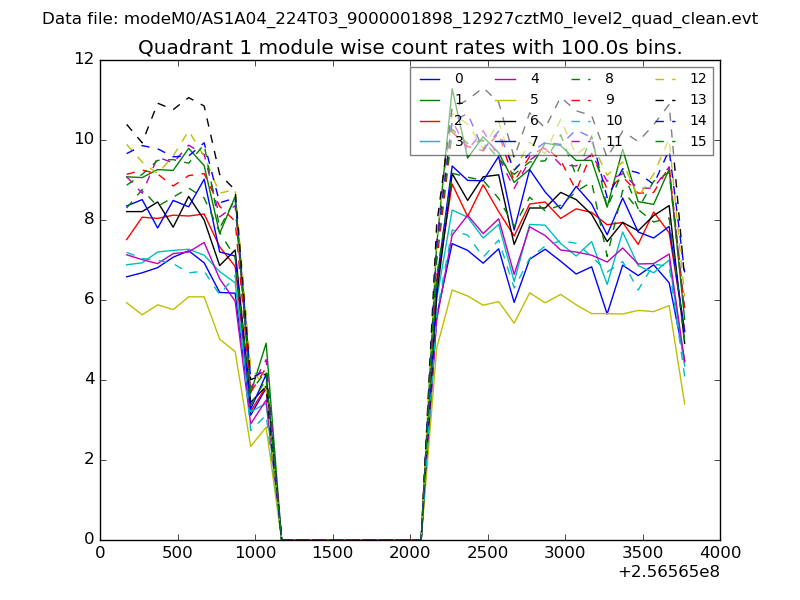 |
 |
| Module-wise count rates for Quadrant C Data is divided into 100 sec bins |
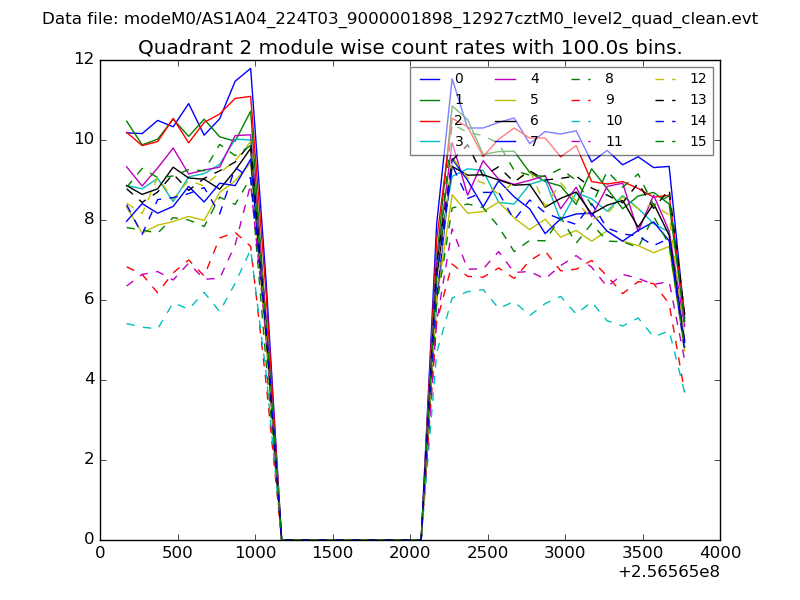 |
 |
| Module-wise count rates for Quadrant D Data is divided into 100 sec bins |
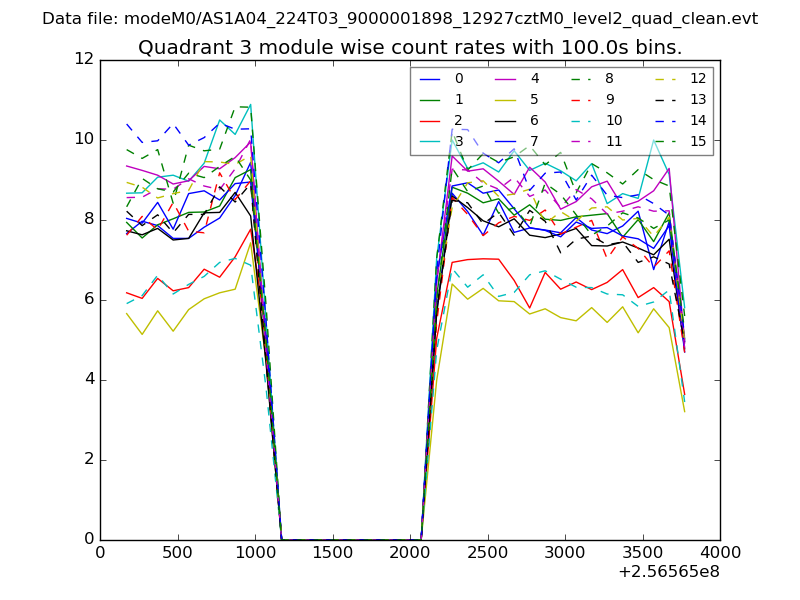 |
 |
| Parameter | Plot |
|---|---|
| CZT HV Monitor | 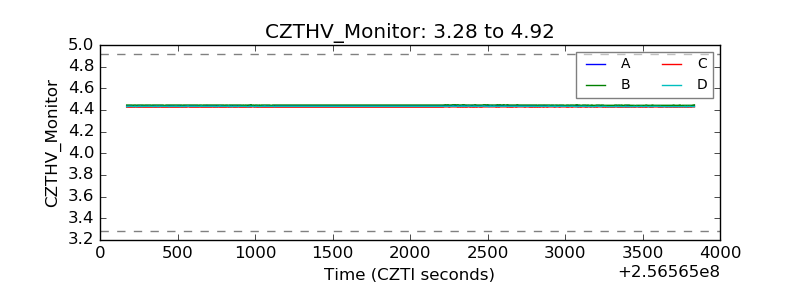 |
| D_VDD |  |
| Temperature 1 | 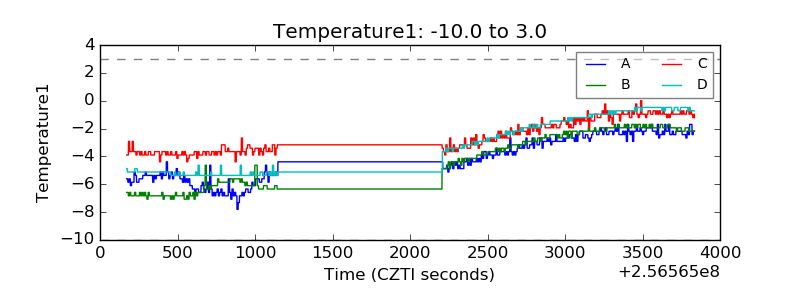 |
| Veto HV Monitor | 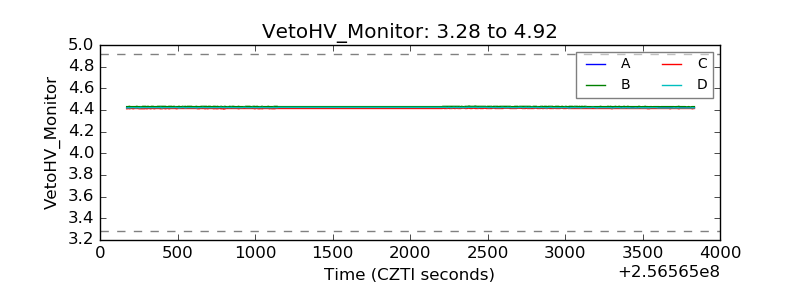 |
| Veto LLD | 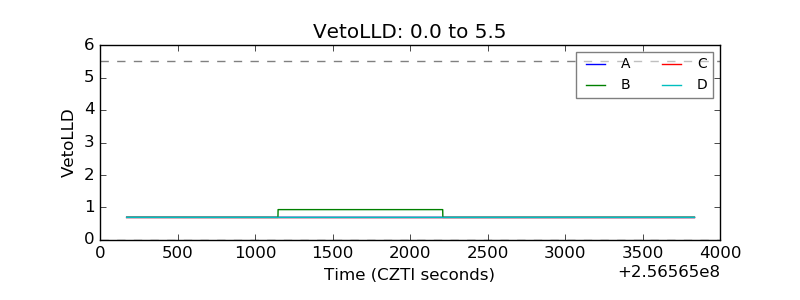 |
| Alpha Counter | 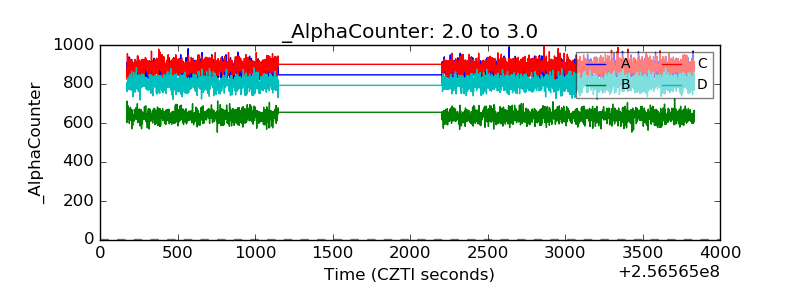 |
| _CPM_Rate | 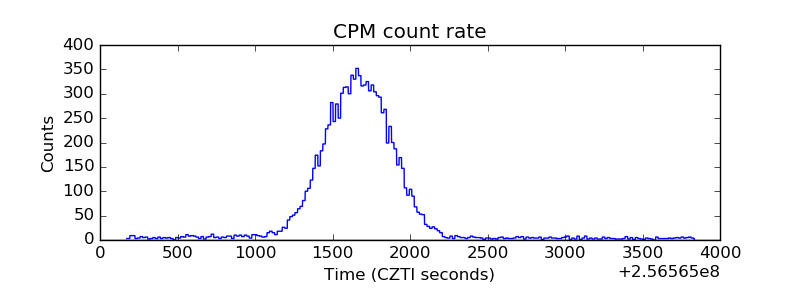 |
| CZT Counter | 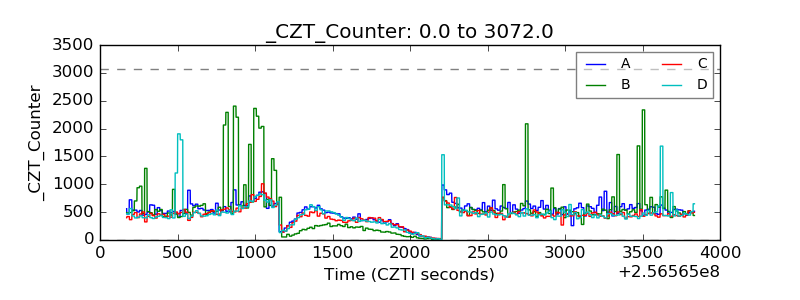 |
| +2.5 Volts monitor |  |
| +5 Volts monitor |  |
| _ROLL_ROT | 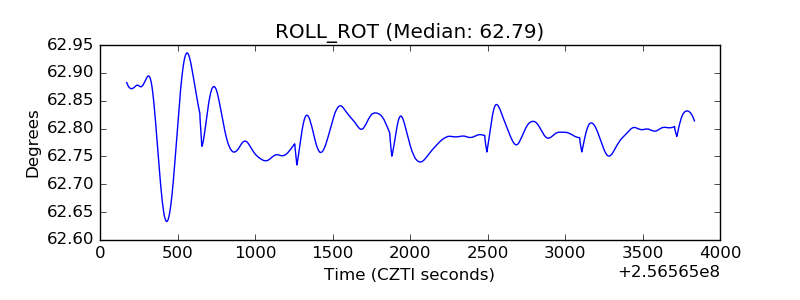 |
| _Roll_DEC | 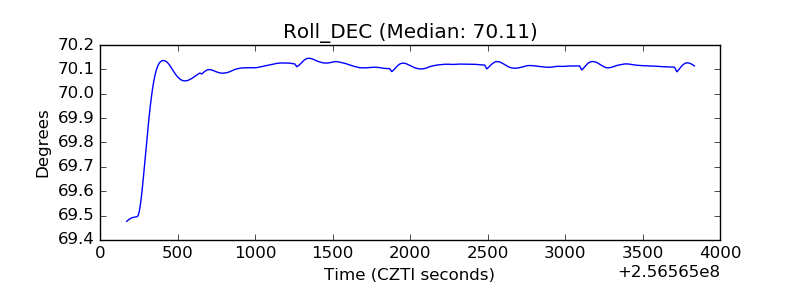 |
| _Roll_RA |  |
| Veto Counter | 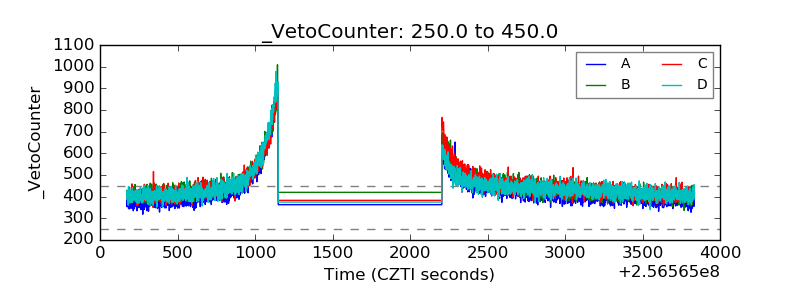 |