| Param | Original file | Final file |
|---|---|---|
| Filename | modeM0/AS1A04_224T03_9000001898_12928cztM0_level2.evt | modeM0/AS1A04_224T03_9000001898_12928cztM0_level2_quad_clean.evt |
| Size (bytes) | 531,515,520 | 126,192,960 |
| Size | 506.9 MB | 120.3 MB |
| Events in quadrant A | 4,383,112 | 855,739 |
| Events in quadrant B | 5,019,871 | 804,528 |
| Events in quadrant C | 3,038,961 | 859,207 |
| Events in quadrant D | 3,195,692 | 830,918 |
| Mode M9 | |||
|---|---|---|---|
| Quadrant | BADHDUFLAG | Total packets | Discarded packets |
| A | 0 | 7 | 0 |
| B | 0 | 7 | 0 |
| C | 0 | 7 | 0 |
| D | 0 | 7 | 0 |
| Mode M0 | |||
|---|---|---|---|
| Quadrant | BADHDUFLAG | Total packets | Discarded packets |
| A | 0 | 17404 | 2 |
| B | 0 | 19303 | 1 |
| C | 0 | 13746 | 1 |
| D | 0 | 14230 | 1 |
| Mode SS | |||
|---|---|---|---|
| Quadrant | BADHDUFLAG | Total packets | Discarded packets |
| A | 0 | 138 | 0 |
| B | 0 | 138 | 0 |
| C | 0 | 138 | 0 |
| D | 0 | 138 | 0 |
| Quadrant | Total seconds | Saturated seconds | Saturation percentage |
|---|---|---|---|
| A | 6757 | 406 | 6.008584% |
| B | 6757 | 981 | 14.518277% |
| C | 6757 | 106 | 1.568744% |
| D | 6757 | 121 | 1.790736% |
Noise dominated data is calculated using 1-second bins in cleaned event files. If a bin has >2000 counts, and if more than 50% of those come from <1% of pixels, then it is considered to be noise-dominated and hence unusable.
| Quadrant | # 1 sec bins | Bins with >0 counts | Bins with >2000 counts | High rate bins dominated by noise | Noise dominated (total time) | Noise dominated (detector-on time) | Marked lightcurve |
|---|---|---|---|---|---|---|---|
| A | 7453 | 6759 | 144 | 144 | 1.93% | 2.13% | 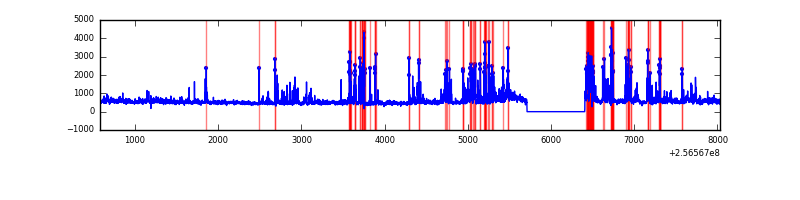 |
| B | 7453 | 6758 | 513 | 513 | 6.88% | 7.59% | 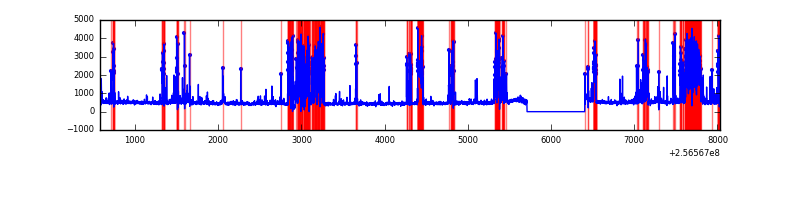 |
| C | 7453 | 6759 | 0 | 0 | 0.00% | 0.00% | 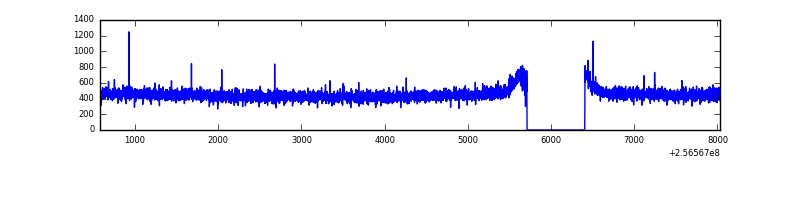 |
| D | 7453 | 6759 | 12 | 12 | 0.16% | 0.18% | 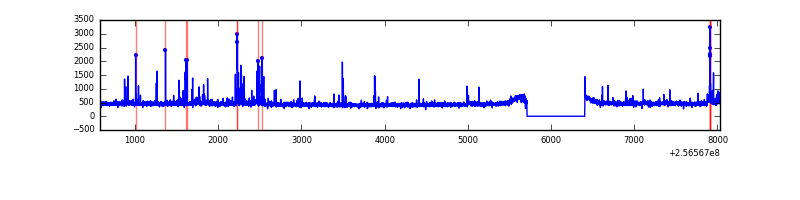 |
Top three noisy pixels from each quadrant. If the there are fewer than three noisy pixels in the level2.evt file, extra rows are filled as -1
| Pixel properties | Quadrant properties | ||||||
|---|---|---|---|---|---|---|---|
| Quadrant | DetID | PixID | Counts | Sigma | Mean | Median | Sigma |
| A | 15 | 223 | 543023 | 3453.85 | 788 | 774 | 157.0 |
| A | 15 | 239 | 398968 | 2536.3 | 788 | 774 | 157.0 |
| A | 1 | 162 | 94280 | 595.59 | 788 | 774 | 157.0 |
| B | 4 | 239 | 1889241 | 13698.45 | 738 | 720 | 137.9 |
| B | 3 | 64 | 184239 | 1331.16 | 738 | 720 | 137.9 |
| B | 0 | 197 | 22413 | 157.35 | 738 | 720 | 137.9 |
| C | 13 | 61 | 5684 | 27.44 | 777 | 779 | 178.8 |
| C | 12 | 4 | 3830 | 17.07 | 777 | 779 | 178.8 |
| C | 14 | 234 | 3053 | 12.72 | 777 | 779 | 178.8 |
| D | 1 | 52 | 106761 | 574.09 | 778 | 754 | 184.7 |
| D | 8 | 195 | 65863 | 352.6 | 778 | 754 | 184.7 |
| D | 10 | 157 | 32698 | 173.0 | 778 | 754 | 184.7 |
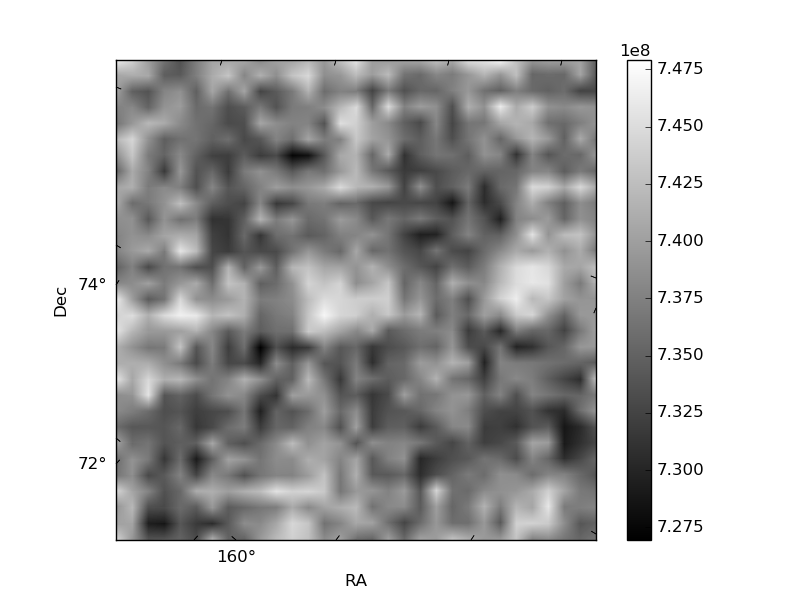
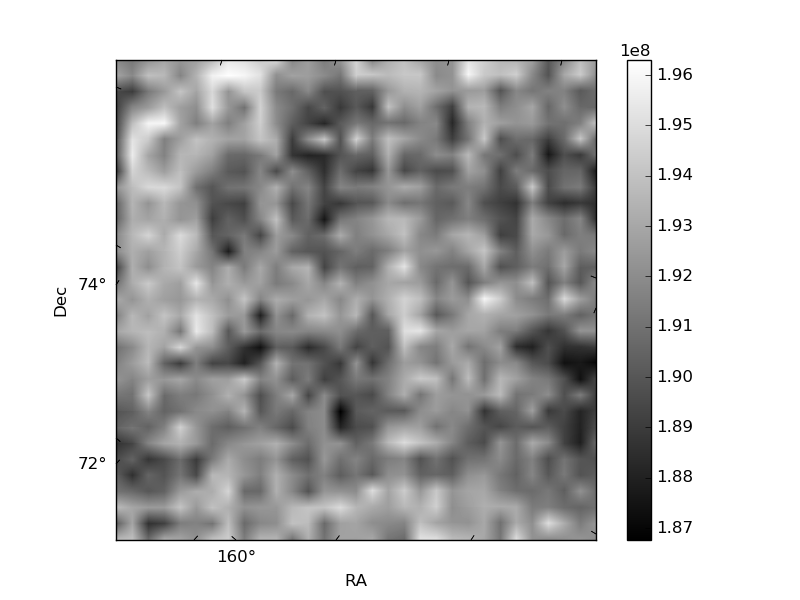
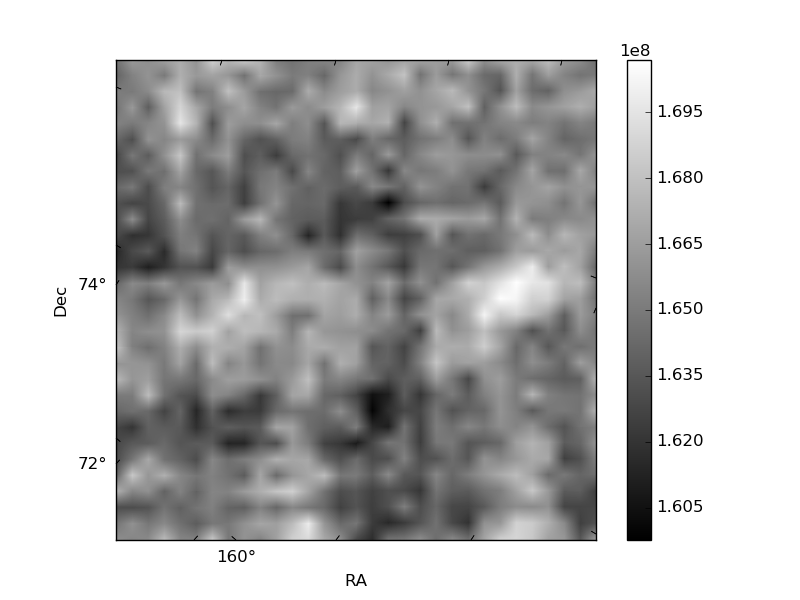
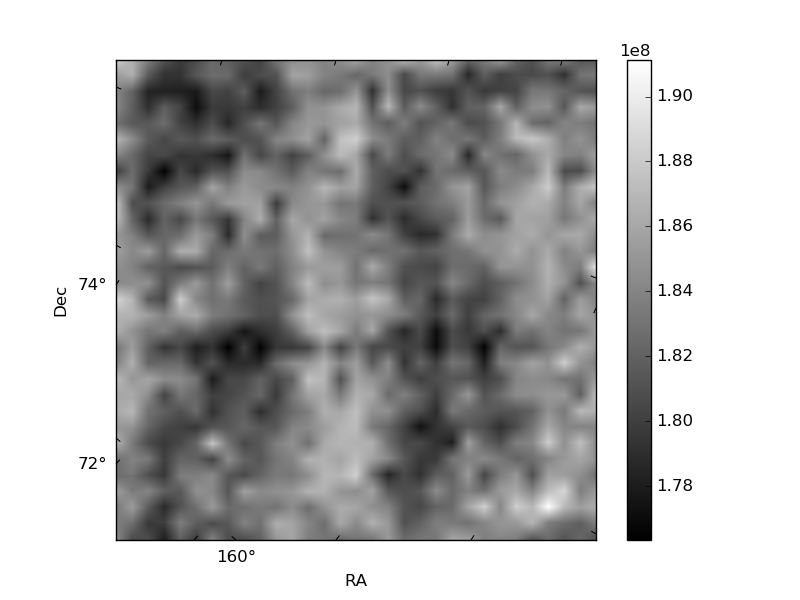
Histogram calculated using DETX and DETY for each event in the final _common_clean file
| Quadrant A | 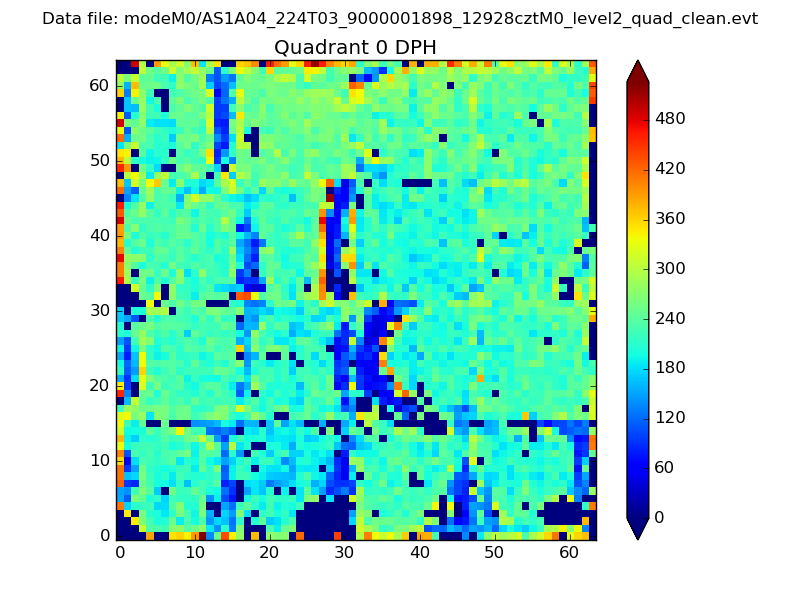 |
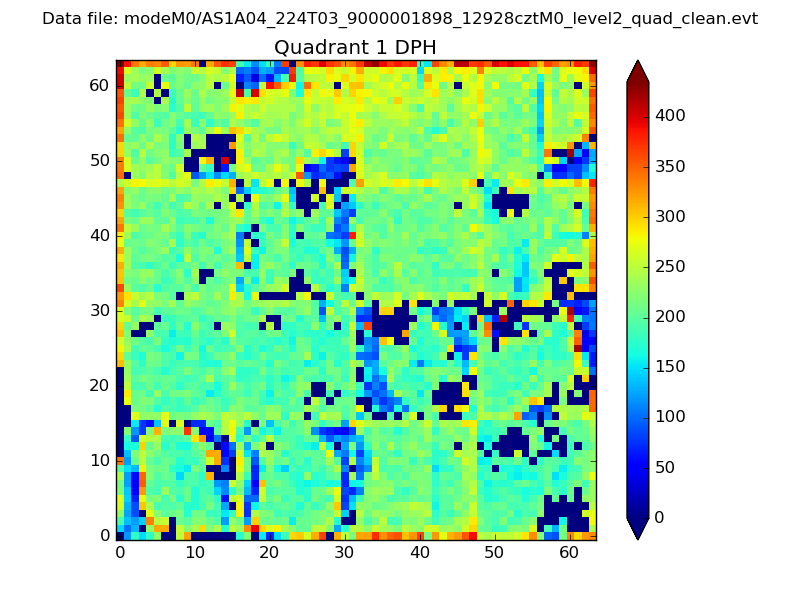 |
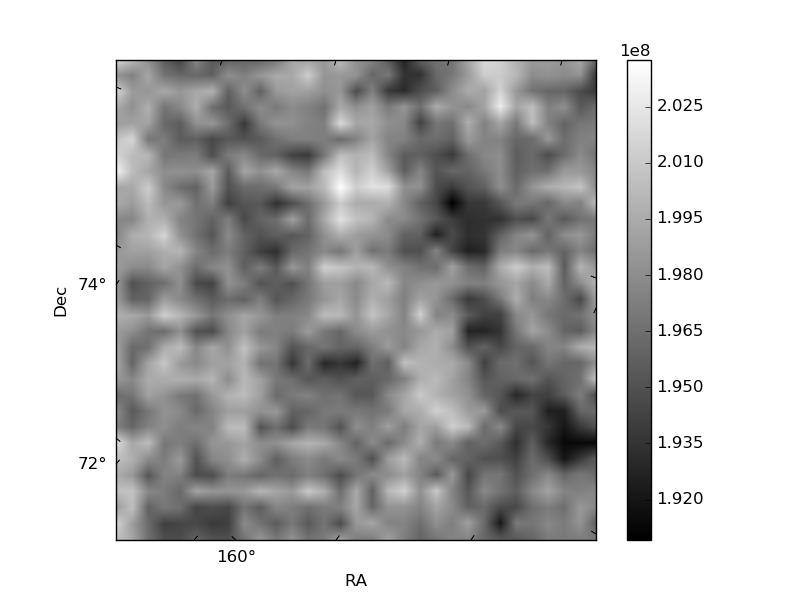
Quadrant B |
|---|---|---|---|
| Quadrant D | 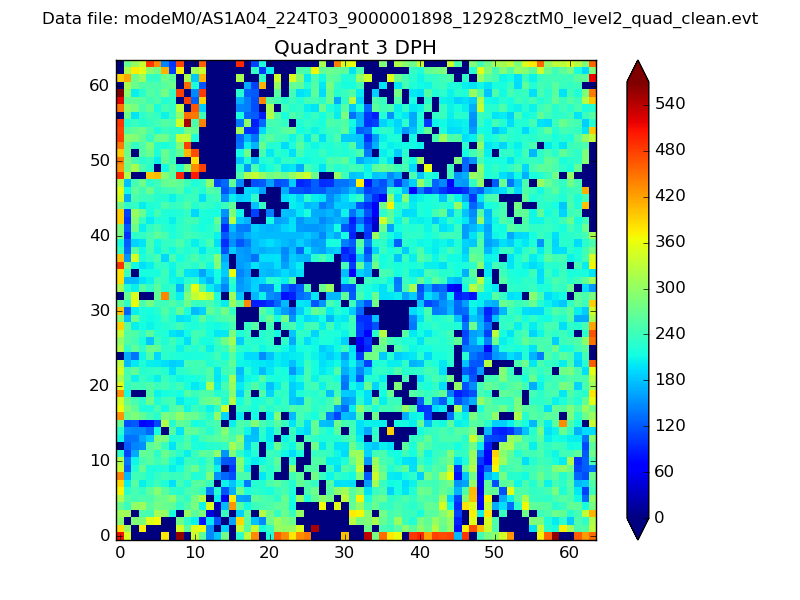 |
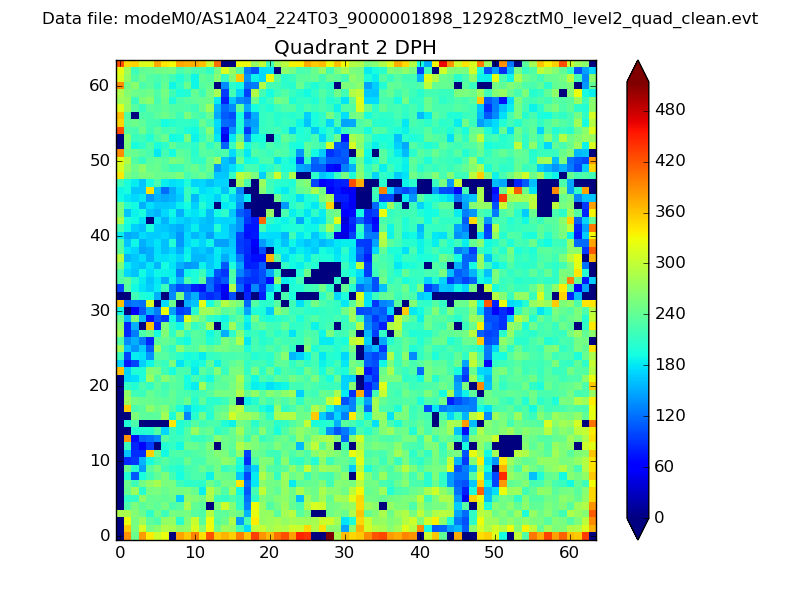 |
Quadrant C |
| Plot type | Count rate plots | Images |
|---|---|---|
| Comparison with Poisson distribution Blue bars denote a histogram of data divided into 1 sec bins. Red curve is a Poisson curve with rate = median count rate of data. |
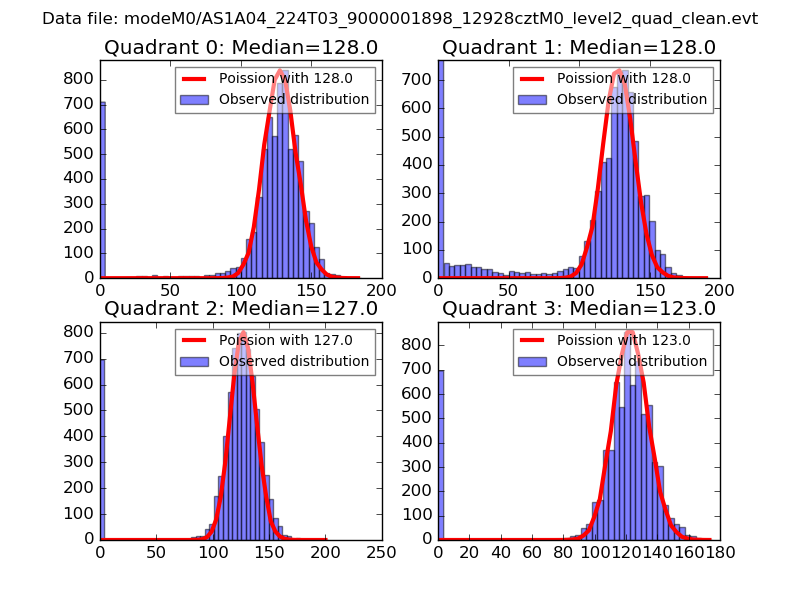 |
 |
| Quadrant-wise count rates Data is divided into 100 sec bins |
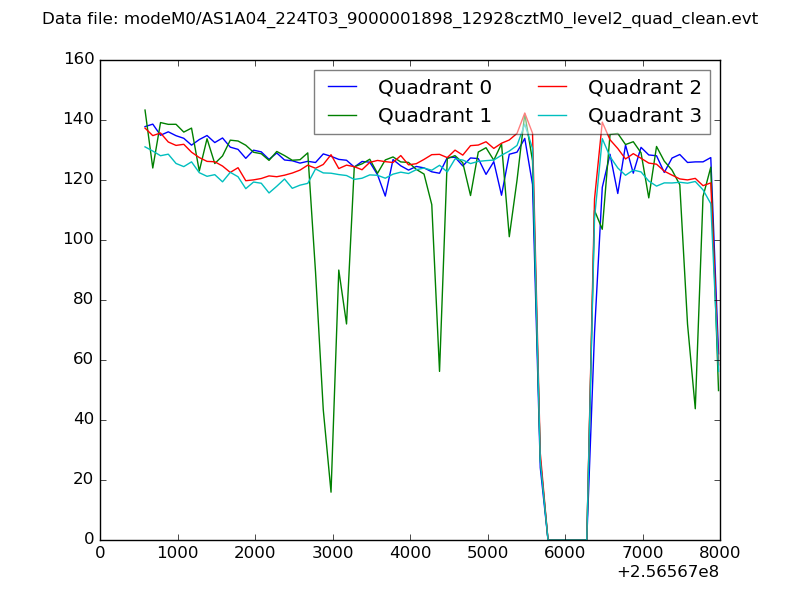 |
|
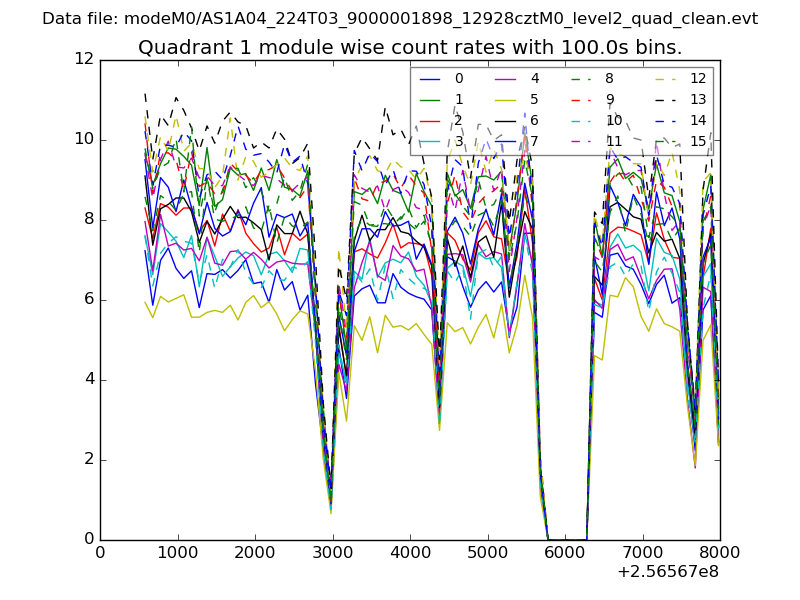
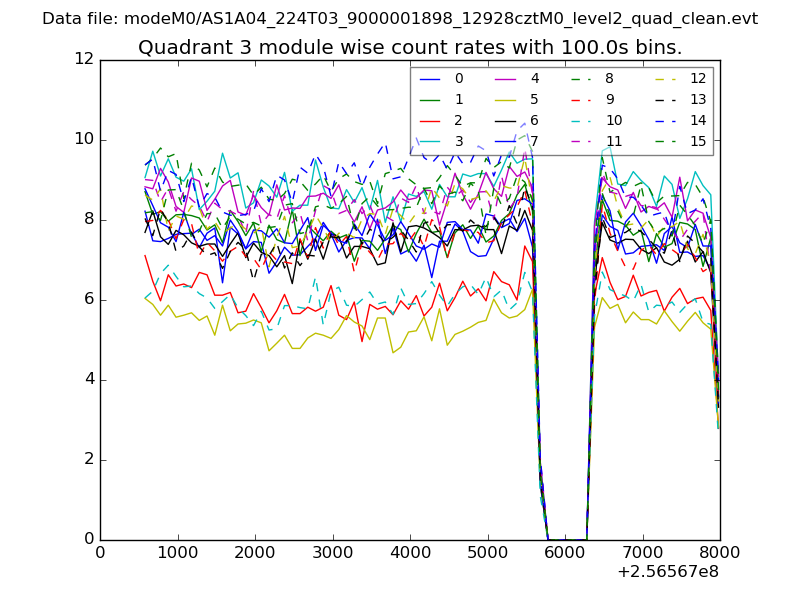
| Module-wise count rates for Quadrant A Data is divided into 100 sec bins |
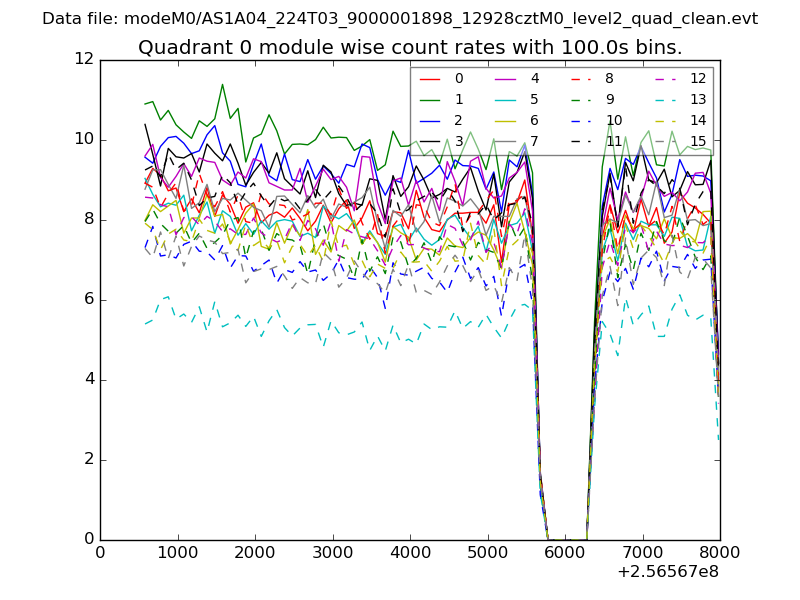 |
 |
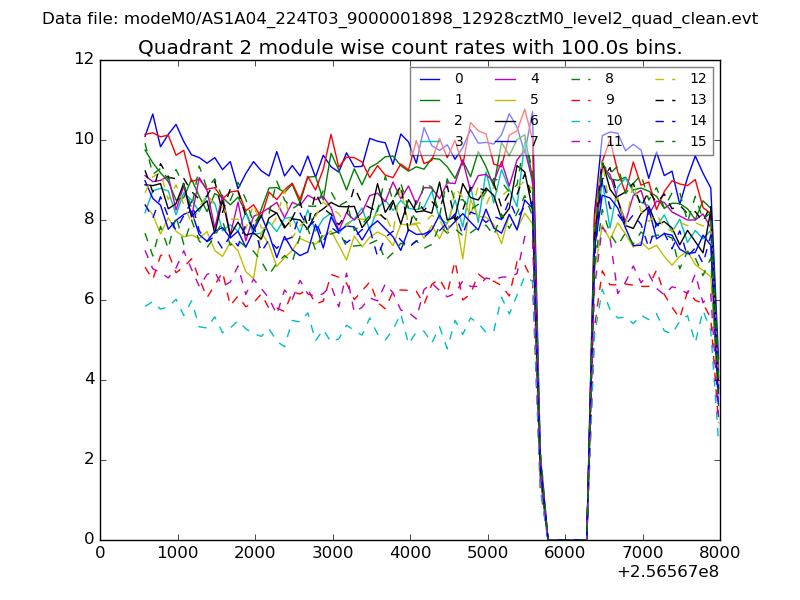
| Module-wise count rates for Quadrant B Data is divided into 100 sec bins |
 |
 |
| Module-wise count rates for Quadrant C Data is divided into 100 sec bins |
 |
 |
| Module-wise count rates for Quadrant D Data is divided into 100 sec bins |
 |
 |
| Parameter | Plot |
|---|---|
| CZT HV Monitor | 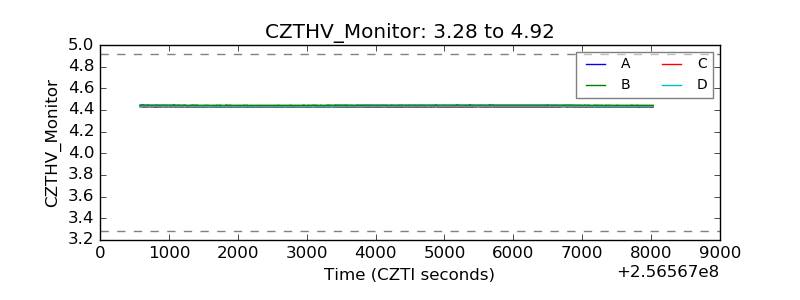 |
| D_VDD | 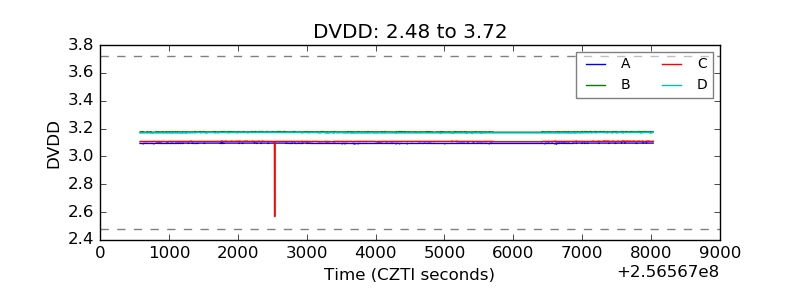 |
| Temperature 1 | 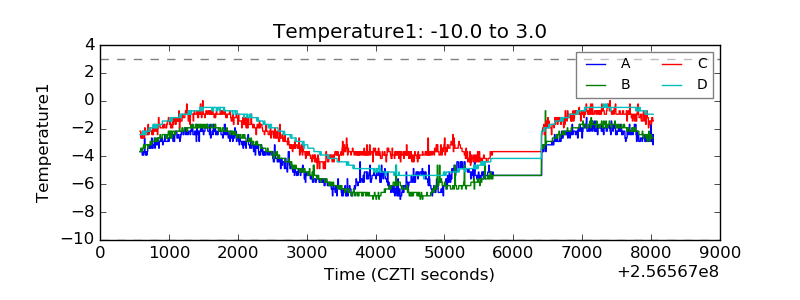 |
| Veto HV Monitor | 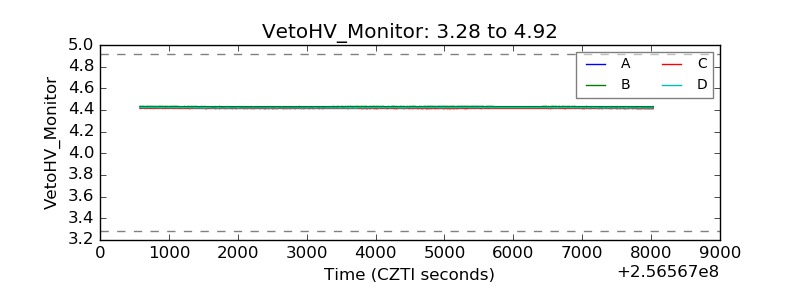 |
| Veto LLD | 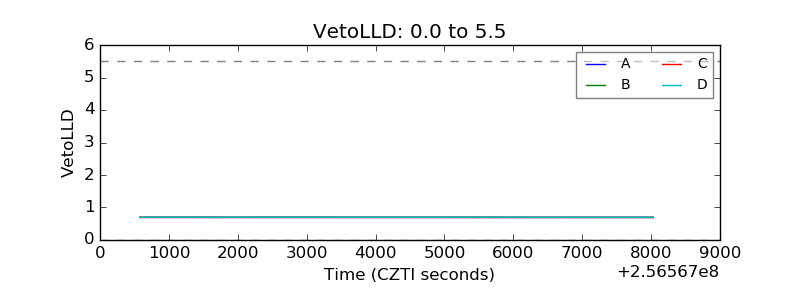 |
| Alpha Counter | 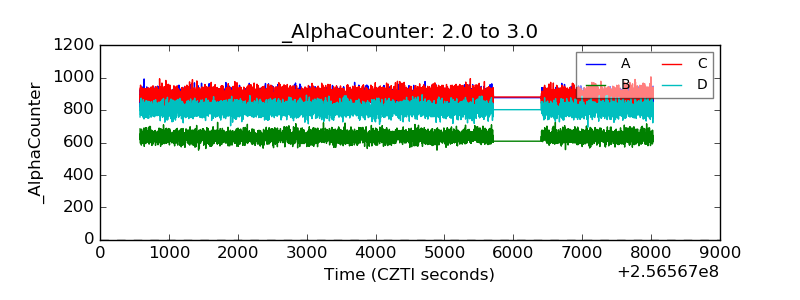 |
| _CPM_Rate | 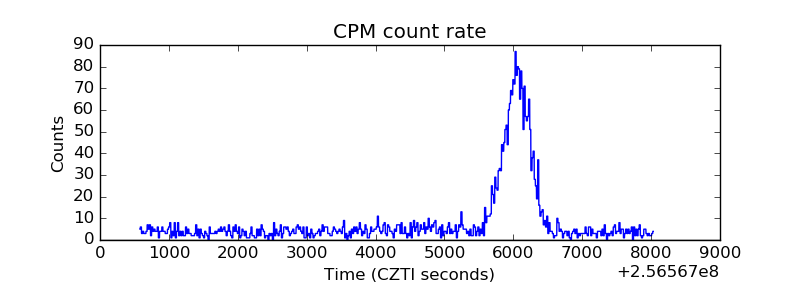 |
| CZT Counter | 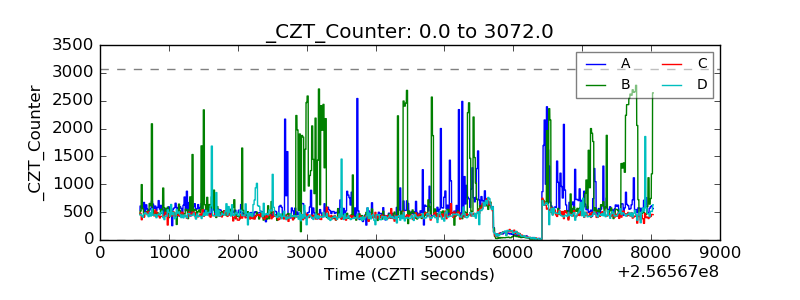 |
| +2.5 Volts monitor |  |
| +5 Volts monitor | 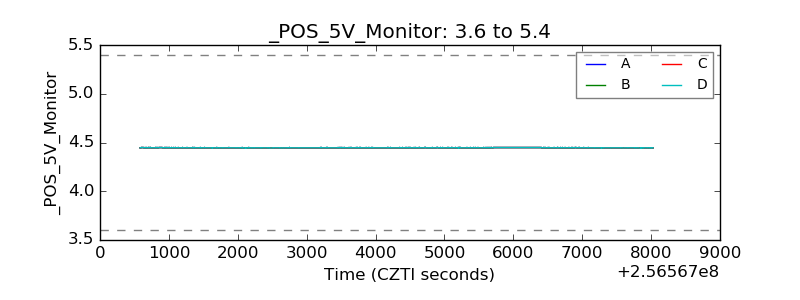 |
| _ROLL_ROT | 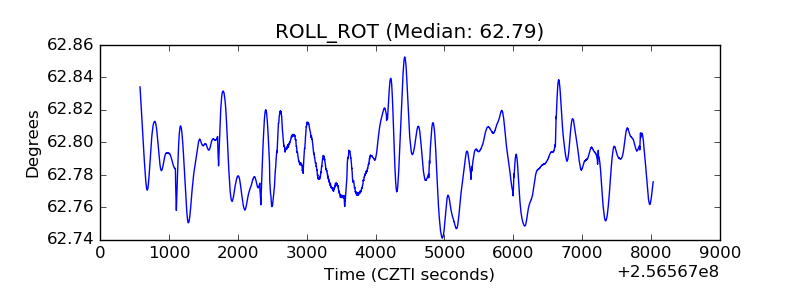 |
| _Roll_DEC | 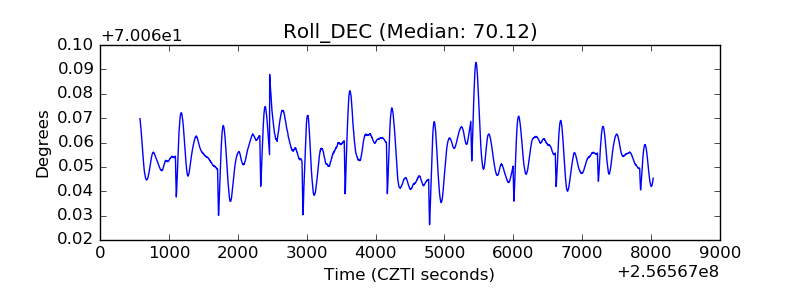 |
| _Roll_RA | 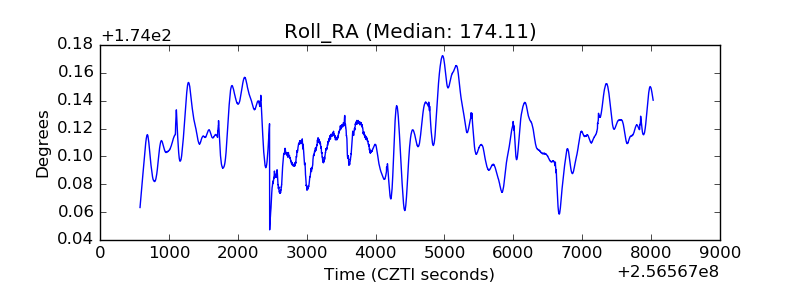 |
| Veto Counter | 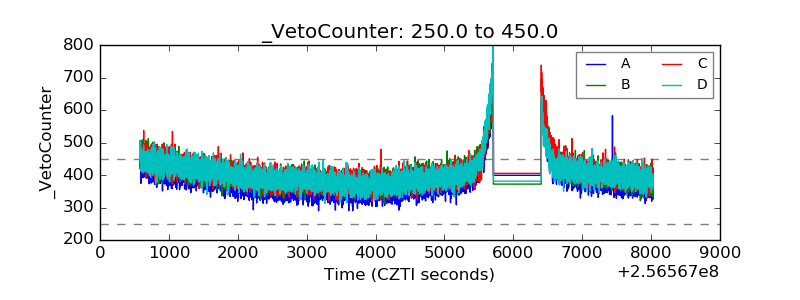 |