| Param | Original file | Final file |
|---|---|---|
| Filename | modeM0/AS1A04_224T03_9000001898_12930cztM0_level2.evt | modeM0/AS1A04_224T03_9000001898_12930cztM0_level2_quad_clean.evt |
| Size (bytes) | 535,334,400 | 123,266,880 |
| Size | 510.5 MB | 117.6 MB |
| Events in quadrant A | 3,925,002 | 846,077 |
| Events in quadrant B | 5,557,237 | 759,198 |
| Events in quadrant C | 3,015,745 | 842,937 |
| Events in quadrant D | 3,255,387 | 813,454 |
| Mode M9 | |||
|---|---|---|---|
| Quadrant | BADHDUFLAG | Total packets | Discarded packets |
| A | 0 | 4 | 0 |
| B | 0 | 4 | 0 |
| C | 0 | 4 | 0 |
| D | 0 | 4 | 0 |
| Mode M0 | |||
|---|---|---|---|
| Quadrant | BADHDUFLAG | Total packets | Discarded packets |
| A | 0 | 16121 | 1 |
| B | 0 | 21092 | 1 |
| C | 0 | 13774 | 1 |
| D | 0 | 14456 | 1 |
| Mode SS | |||
|---|---|---|---|
| Quadrant | BADHDUFLAG | Total packets | Discarded packets |
| A | 0 | 136 | 0 |
| B | 0 | 136 | 0 |
| C | 0 | 136 | 0 |
| D | 0 | 136 | 0 |
| Quadrant | Total seconds | Saturated seconds | Saturation percentage |
|---|---|---|---|
| A | 6773 | 127 | 1.875092% |
| B | 6773 | 1190 | 17.569762% |
| C | 6773 | 49 | 0.723461% |
| D | 6773 | 70 | 1.033515% |
Noise dominated data is calculated using 1-second bins in cleaned event files. If a bin has >2000 counts, and if more than 50% of those come from <1% of pixels, then it is considered to be noise-dominated and hence unusable.
| Quadrant | # 1 sec bins | Bins with >0 counts | Bins with >2000 counts | High rate bins dominated by noise | Noise dominated (total time) | Noise dominated (detector-on time) | Marked lightcurve |
|---|---|---|---|---|---|---|---|
| A | 7074 | 6777 | 37 | 37 | 0.52% | 0.55% | 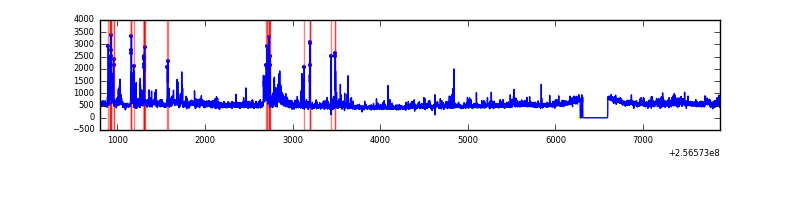 |
| B | 7073 | 6776 | 747 | 747 | 10.56% | 11.02% | 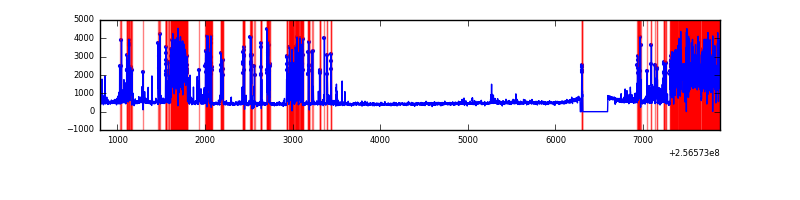 |
| C | 7074 | 6777 | 0 | 0 | 0.00% | 0.00% | 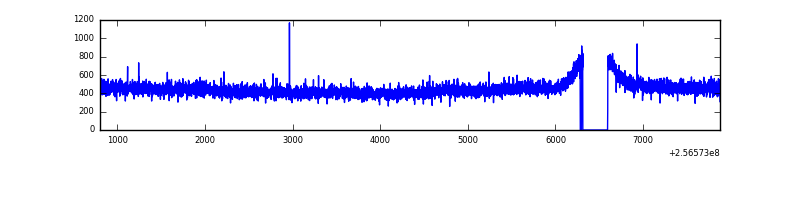 |
| D | 7074 | 6777 | 23 | 23 | 0.33% | 0.34% | 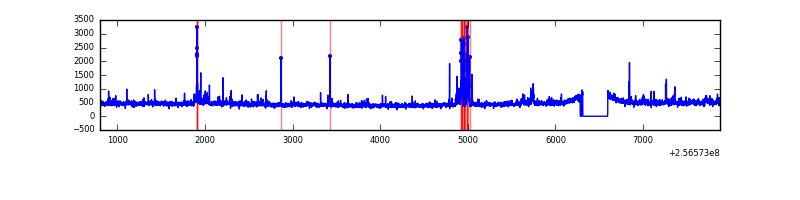 |
Top three noisy pixels from each quadrant. If the there are fewer than three noisy pixels in the level2.evt file, extra rows are filled as -1
| Pixel properties | Quadrant properties | ||||||
|---|---|---|---|---|---|---|---|
| Quadrant | DetID | PixID | Counts | Sigma | Mean | Median | Sigma |
| A | 15 | 223 | 233382 | 1456.87 | 794 | 776 | 159.7 |
| A | 15 | 239 | 181546 | 1132.21 | 794 | 776 | 159.7 |
| A | 1 | 162 | 159210 | 992.31 | 794 | 776 | 159.7 |
| B | 4 | 239 | 2428530 | 18269.27 | 710 | 689 | 132.9 |
| B | 3 | 64 | 271850 | 2040.46 | 710 | 689 | 132.9 |
| B | 4 | 48 | 26594 | 194.93 | 710 | 689 | 132.9 |
| C | 13 | 61 | 5715 | 27.97 | 772 | 772 | 176.7 |
| C | 3 | 233 | 3059 | 12.94 | 772 | 772 | 176.7 |
| C | 8 | 222 | 2323 | 8.78 | 772 | 772 | 176.7 |
| D | 1 | 52 | 188887 | 1034.38 | 769 | 745 | 181.9 |
| D | 8 | 195 | 62130 | 337.49 | 769 | 745 | 181.9 |
| D | 2 | 14 | 48922 | 264.87 | 769 | 745 | 181.9 |
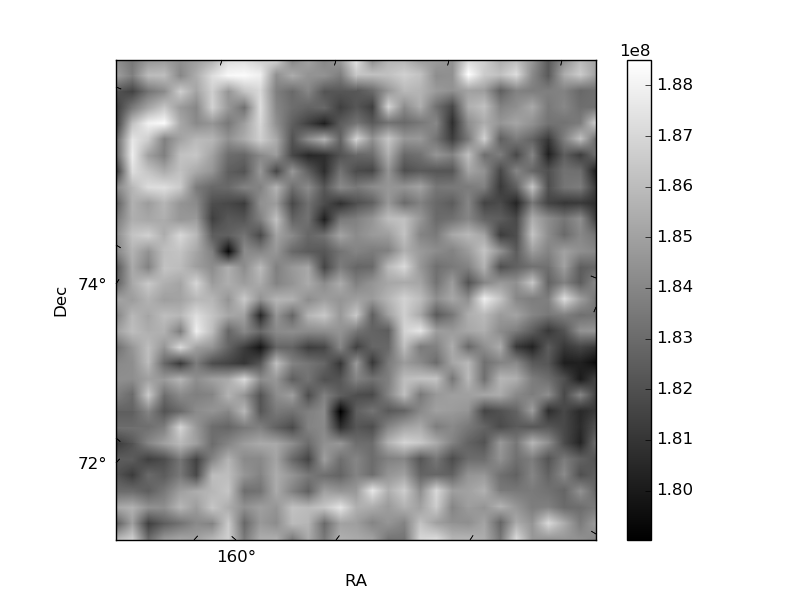
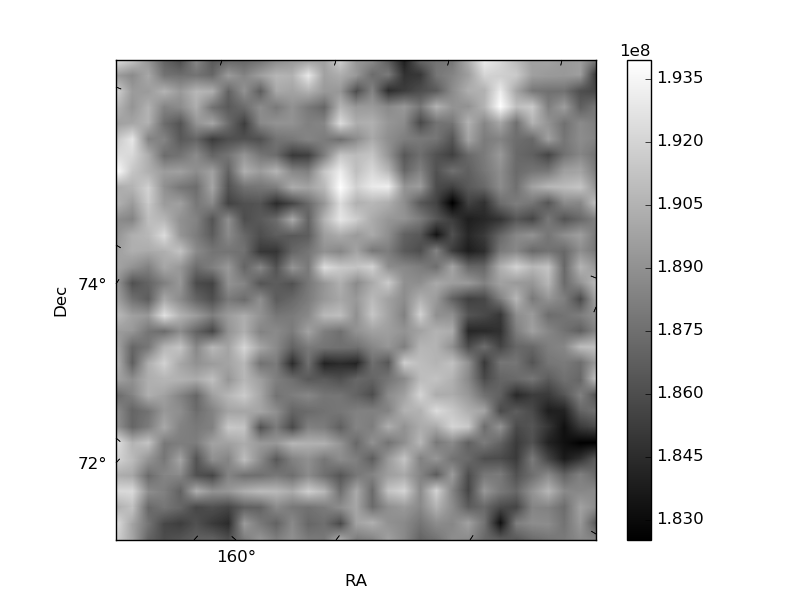
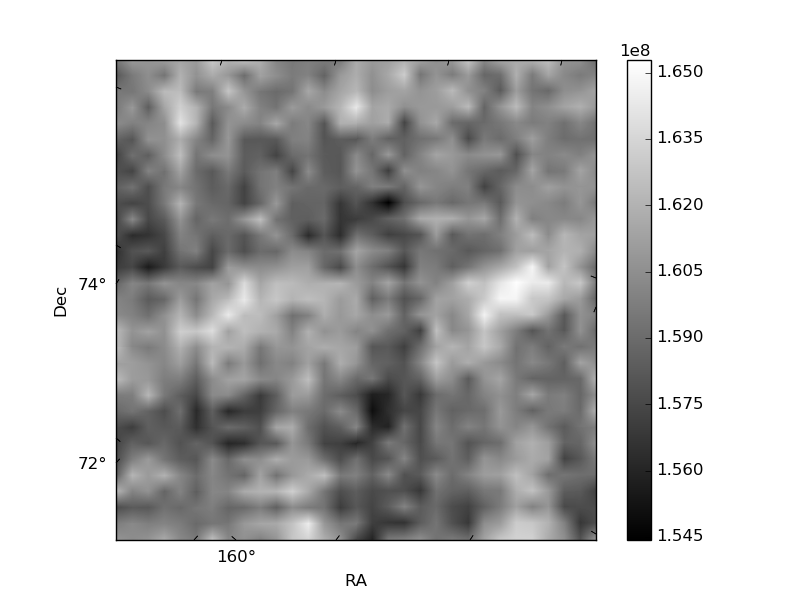
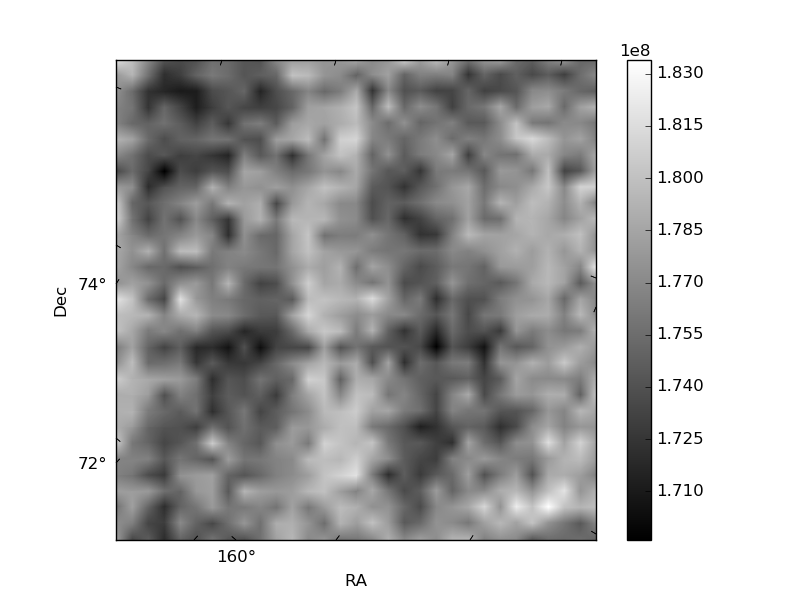
Histogram calculated using DETX and DETY for each event in the final _common_clean file
| Quadrant A | 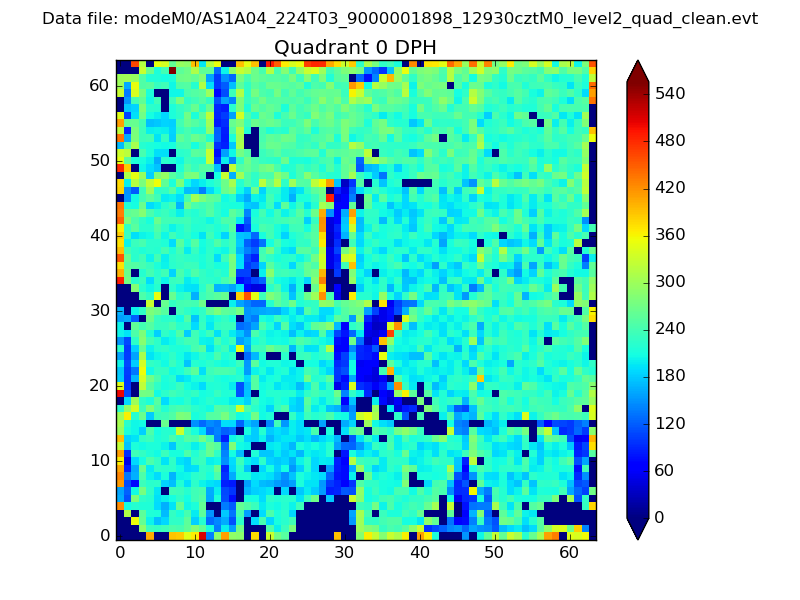 |
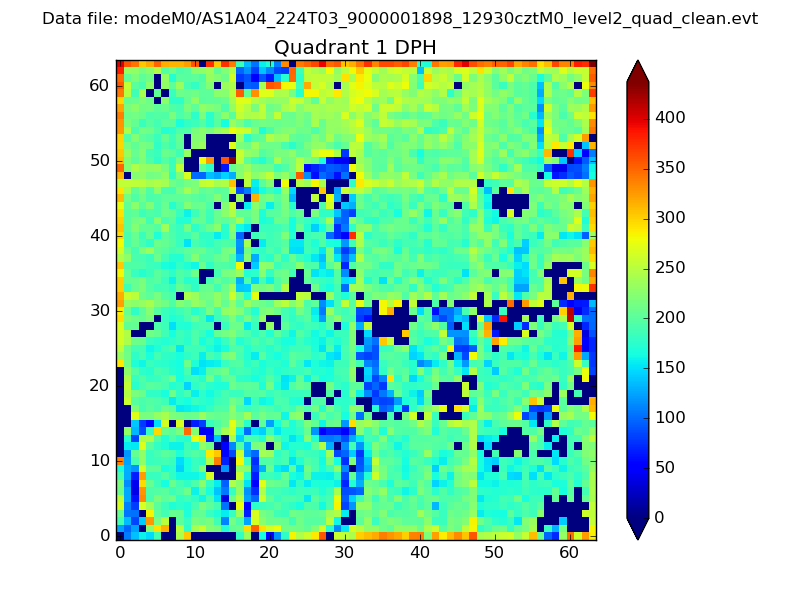 |
Quadrant B |
|---|---|---|---|
| Quadrant D | 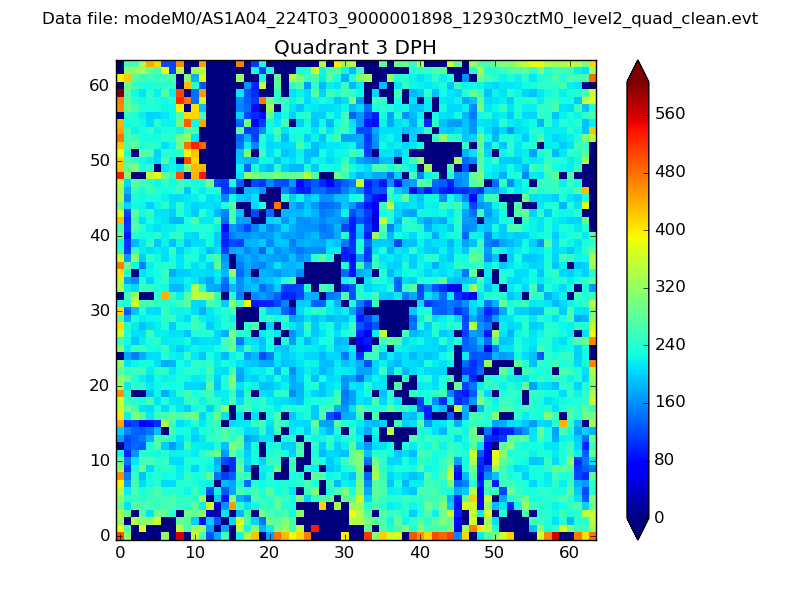 |
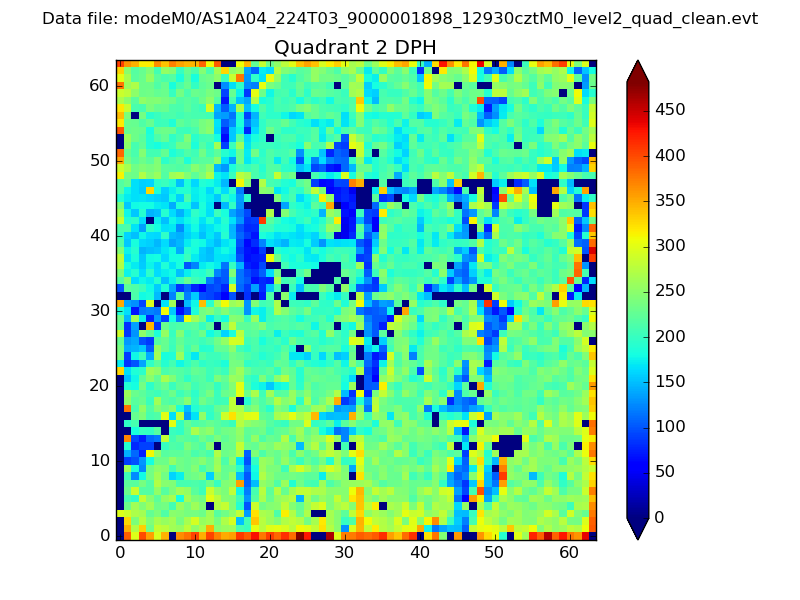 |
Quadrant C |
| Plot type | Count rate plots | Images |
|---|---|---|
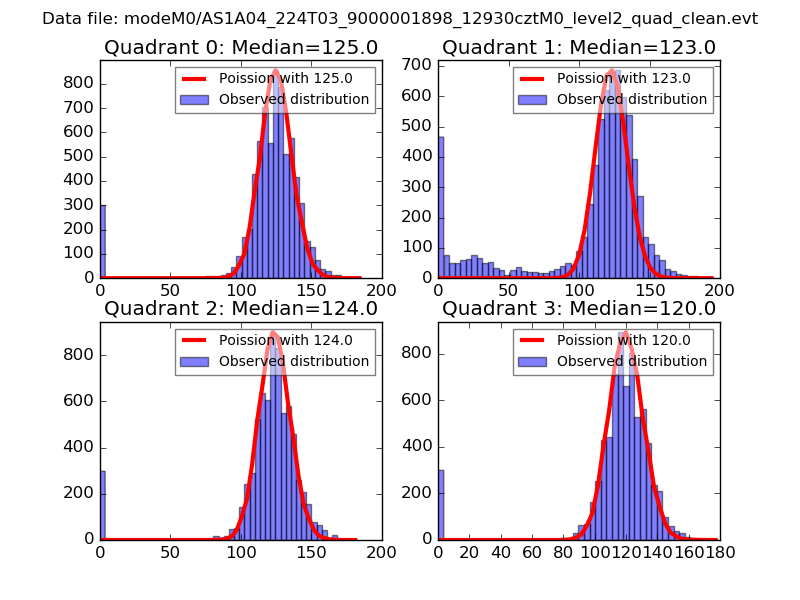
| Comparison with Poisson distribution Blue bars denote a histogram of data divided into 1 sec bins. Red curve is a Poisson curve with rate = median count rate of data. |
 |
 |
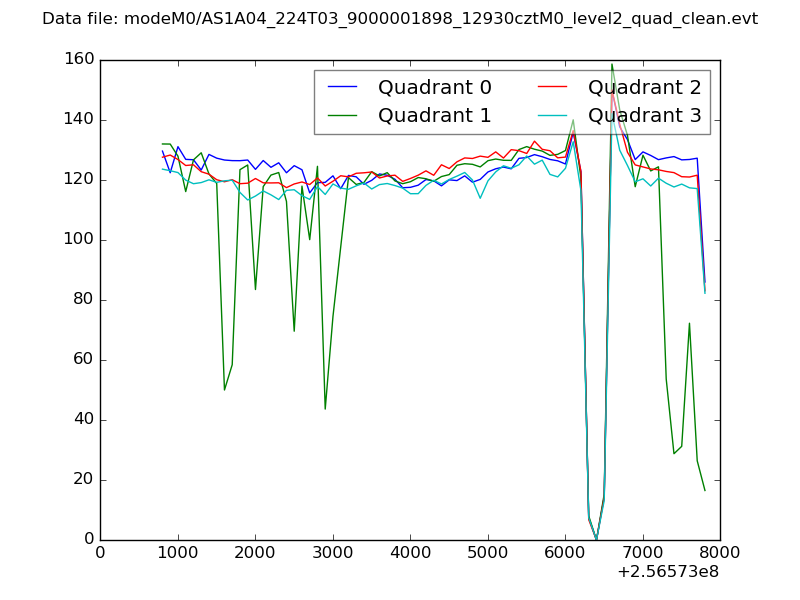
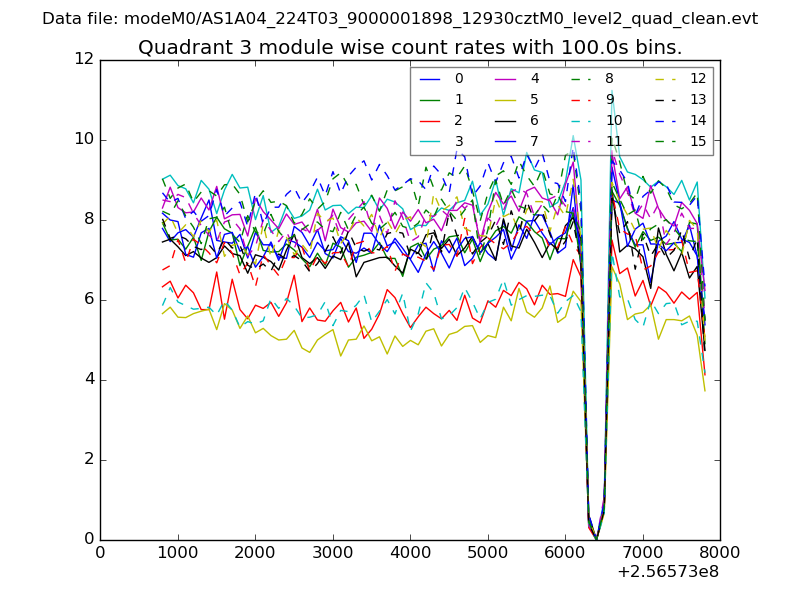
| Quadrant-wise count rates Data is divided into 100 sec bins |
 |
|
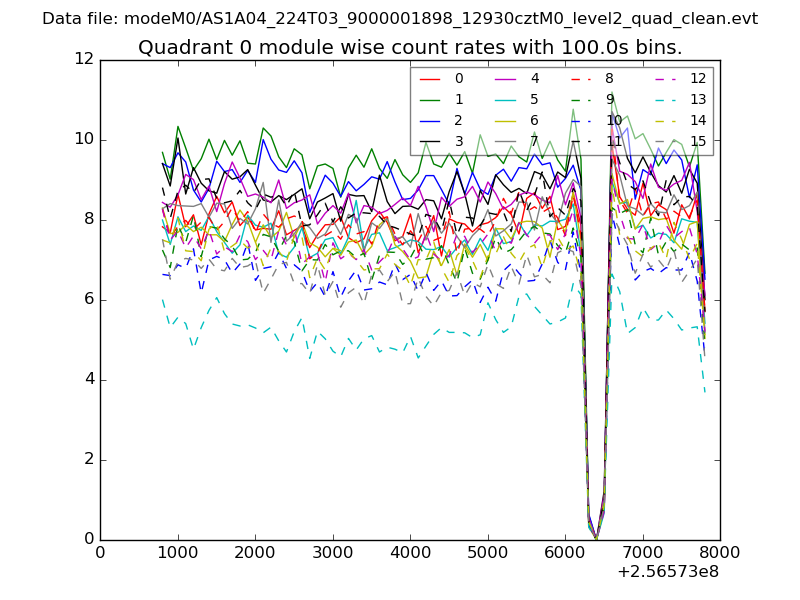
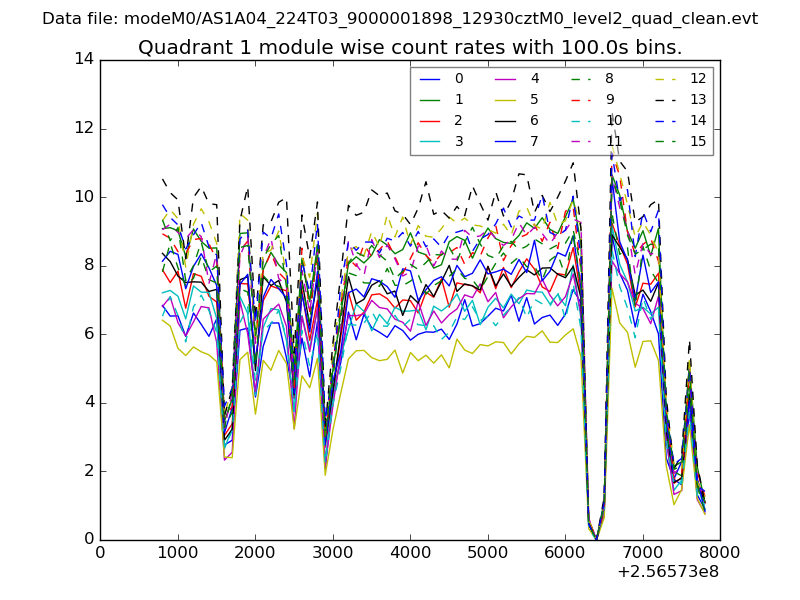
| Module-wise count rates for Quadrant A Data is divided into 100 sec bins |
 |
 |
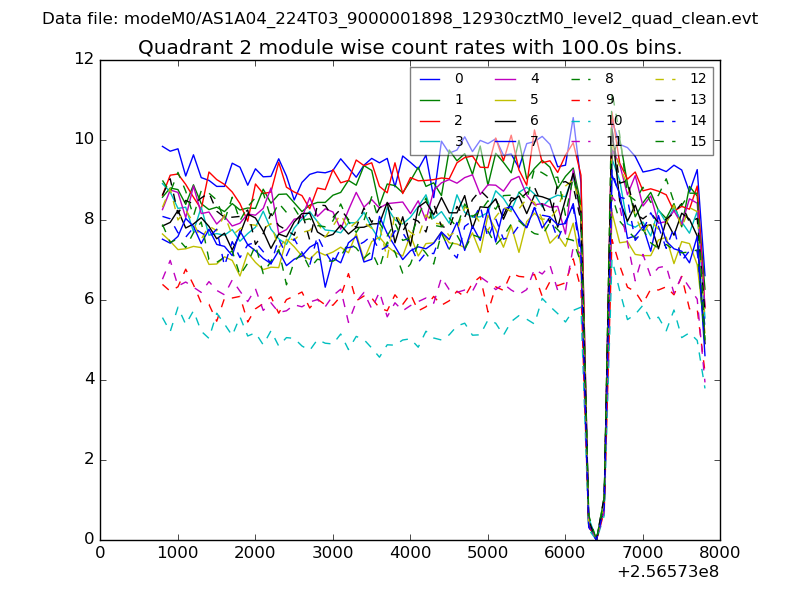
| Module-wise count rates for Quadrant B Data is divided into 100 sec bins |
 |
 |
| Module-wise count rates for Quadrant C Data is divided into 100 sec bins |
 |
 |
| Module-wise count rates for Quadrant D Data is divided into 100 sec bins |
 |
 |
| Parameter | Plot |
|---|---|
| CZT HV Monitor | 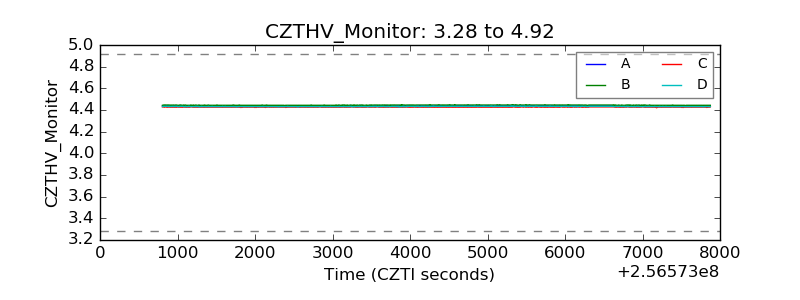 |
| D_VDD | 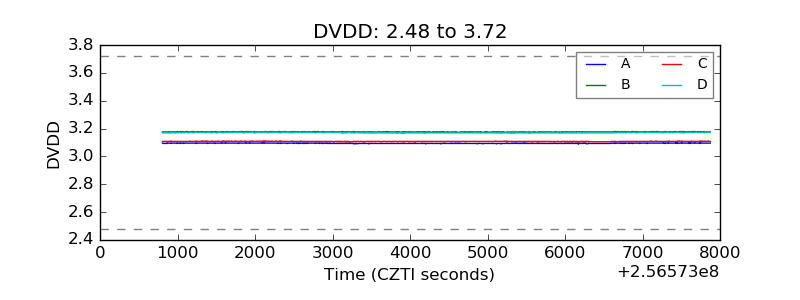 |
| Temperature 1 | 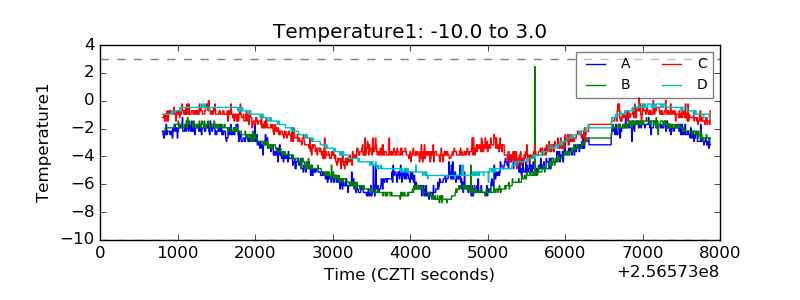 |
| Veto HV Monitor | 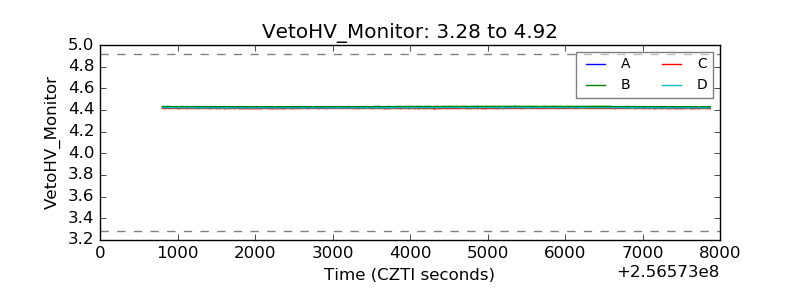 |
| Veto LLD | 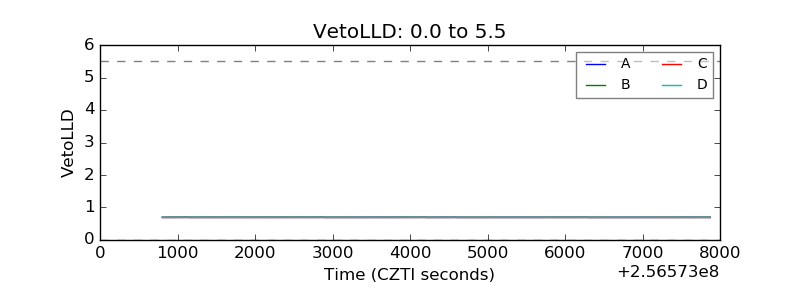 |
| Alpha Counter | 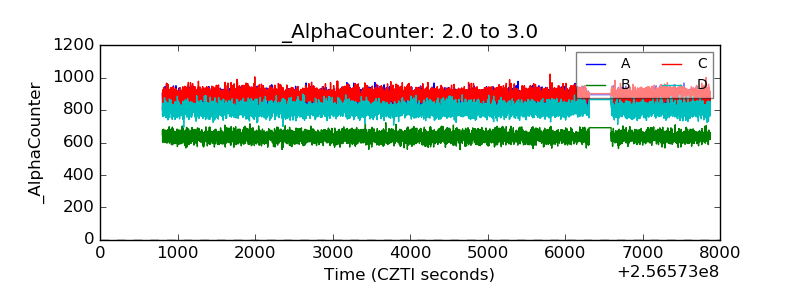 |
| _CPM_Rate | 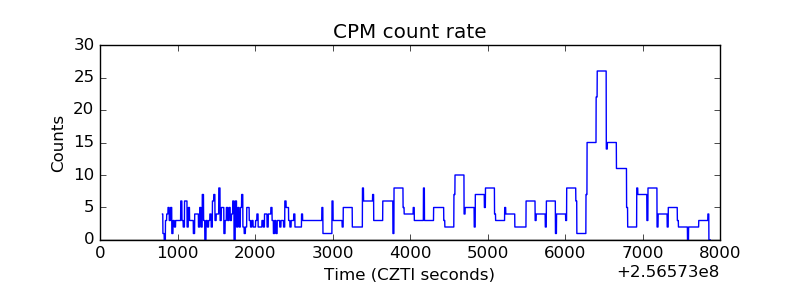 |
| CZT Counter | 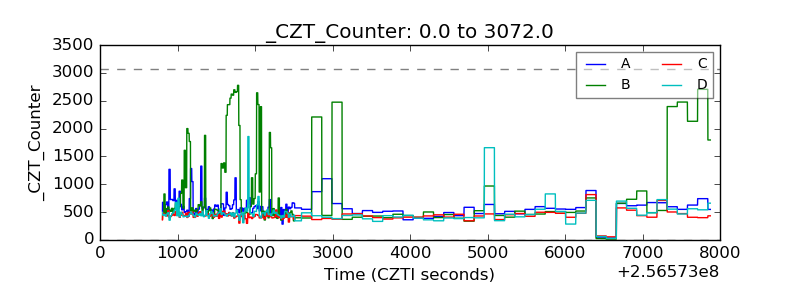 |
| +2.5 Volts monitor | 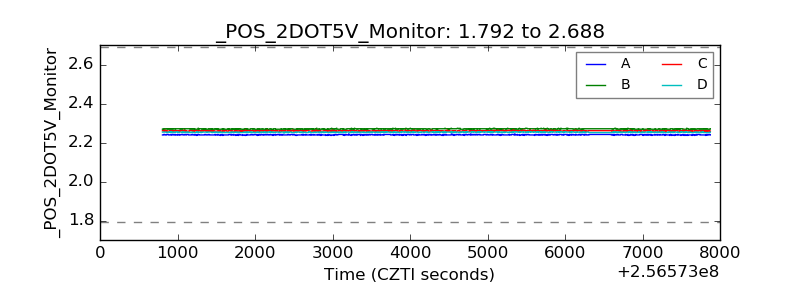 |
| +5 Volts monitor |  |
| _ROLL_ROT | 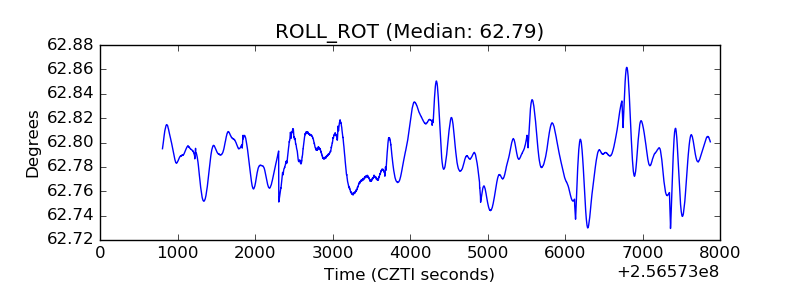 |
| _Roll_DEC | 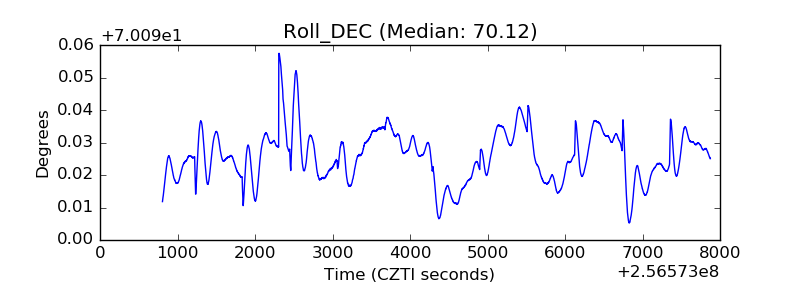 |
| _Roll_RA | 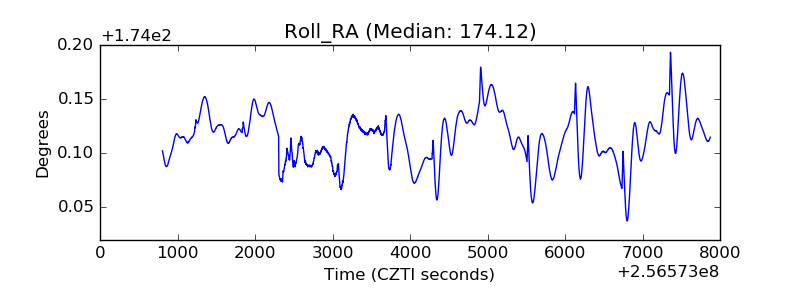 |
| Veto Counter | 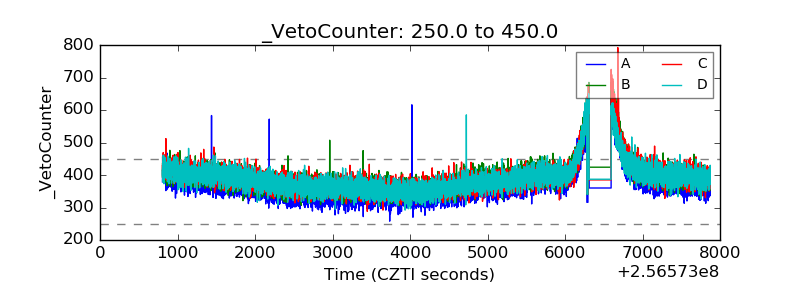 |