| Param | Original file | Final file |
|---|---|---|
| Filename | modeM0/AS1G08_043T01_9000001902_12949cztM0_level2.evt | modeM0/AS1G08_043T01_9000001902_12949cztM0_level2_quad_clean.evt |
| Size (bytes) | 257,947,200 | 39,899,520 |
| Size | 246.0 MB | 38.1 MB |
| Events in quadrant A | 1,677,199 | 240,215 |
| Events in quadrant B | 2,036,493 | 244,555 |
| Events in quadrant C | 1,594,285 | 238,254 |
| Events in quadrant D | 2,255,749 | 227,836 |
| Mode M0 | |||
|---|---|---|---|
| Quadrant | BADHDUFLAG | Total packets | Discarded packets |
| A | 0 | 7427 | 1 |
| B | 0 | 8617 | 0 |
| C | 0 | 7277 | 0 |
| D | 0 | 9296 | 0 |
| Mode SS | |||
|---|---|---|---|
| Quadrant | BADHDUFLAG | Total packets | Discarded packets |
| A | 0 | 72 | 0 |
| B | 0 | 72 | 0 |
| C | 0 | 72 | 0 |
| D | 0 | 72 | 0 |
| Quadrant | Total seconds | Saturated seconds | Saturation percentage |
|---|---|---|---|
| A | 3631 | 6 | 0.165244% |
| B | 3631 | 100 | 2.754062% |
| C | 3631 | 3 | 0.082622% |
| D | 3631 | 87 | 2.396034% |
Noise dominated data is calculated using 1-second bins in cleaned event files. If a bin has >2000 counts, and if more than 50% of those come from <1% of pixels, then it is considered to be noise-dominated and hence unusable.
| Quadrant | # 1 sec bins | Bins with >0 counts | Bins with >2000 counts | High rate bins dominated by noise | Noise dominated (total time) | Noise dominated (detector-on time) | Marked lightcurve |
|---|---|---|---|---|---|---|---|
| A | 3632 | 3632 | 0 | 0 | 0.00% | 0.00% | 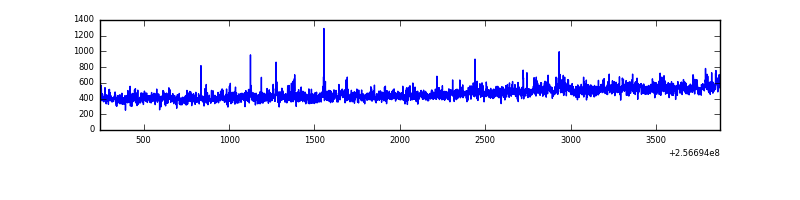 |
| B | 3632 | 3632 | 57 | 57 | 1.57% | 1.57% | 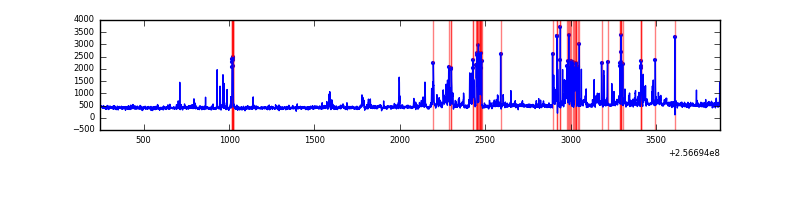 |
| C | 3632 | 3632 | 0 | 0 | 0.00% | 0.00% | 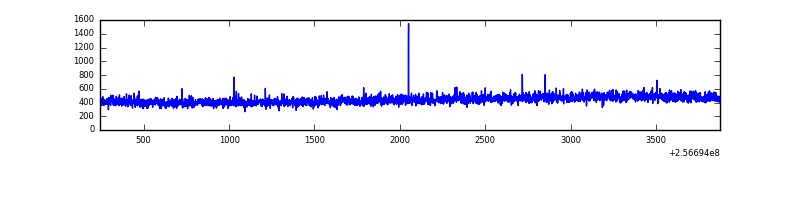 |
| D | 3632 | 3632 | 60 | 60 | 1.65% | 1.65% | 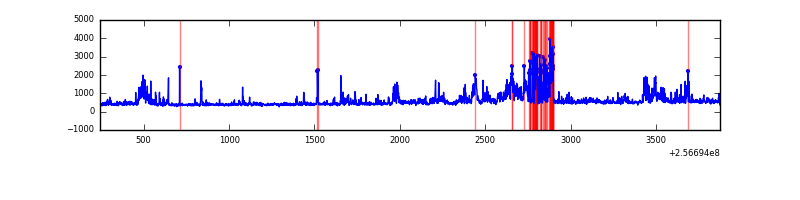 |
Top three noisy pixels from each quadrant. If the there are fewer than three noisy pixels in the level2.evt file, extra rows are filled as -1
| Pixel properties | Quadrant properties | ||||||
|---|---|---|---|---|---|---|---|
| Quadrant | DetID | PixID | Counts | Sigma | Mean | Median | Sigma |
| A | 1 | 162 | 28091 | 318.9 | 415 | 406 | 86.8 |
| A | 1 | 178 | 12769 | 142.41 | 415 | 406 | 86.8 |
| A | 1 | 161 | 11172 | 124.01 | 415 | 406 | 86.8 |
| B | 4 | 239 | 275648 | 3515.79 | 409 | 399 | 78.3 |
| B | 3 | 64 | 134720 | 1715.7 | 409 | 399 | 78.3 |
| B | 3 | 209 | 10760 | 132.34 | 409 | 399 | 78.3 |
| C | 14 | 234 | 3299 | 30.42 | 407 | 409 | 95.0 |
| C | 13 | 61 | 2945 | 26.69 | 407 | 409 | 95.0 |
| C | 8 | 222 | 2489 | 21.89 | 407 | 409 | 95.0 |
| D | 1 | 52 | 584727 | 5981.55 | 402 | 389 | 97.7 |
| D | 8 | 195 | 122920 | 1254.28 | 402 | 389 | 97.7 |
| D | 14 | 35 | 16081 | 160.63 | 402 | 389 | 97.7 |
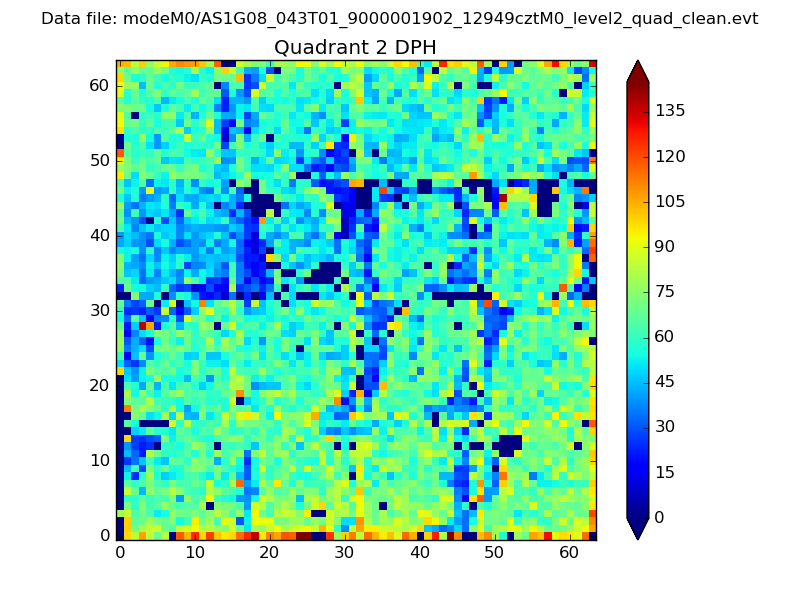
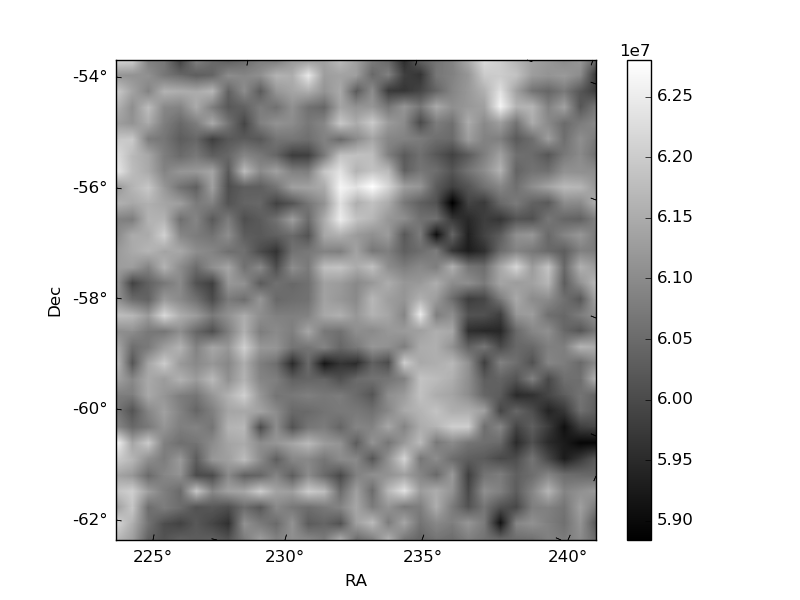
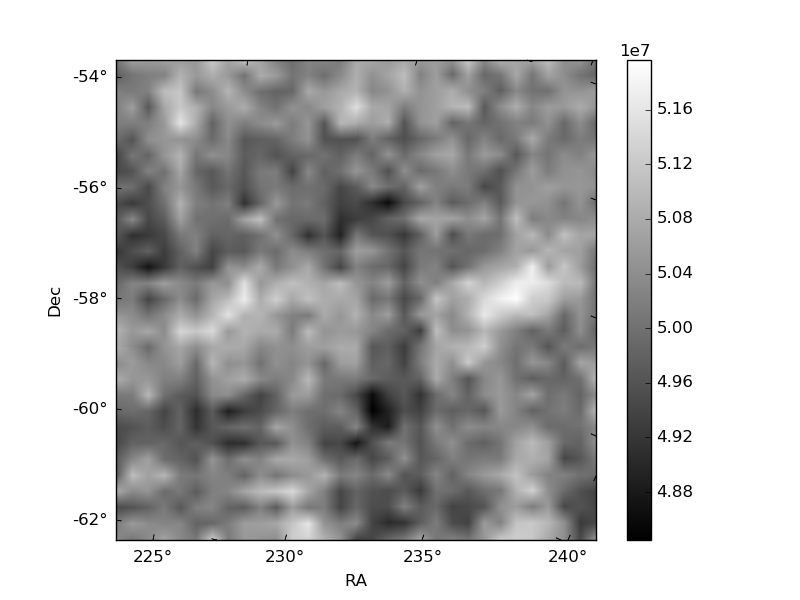
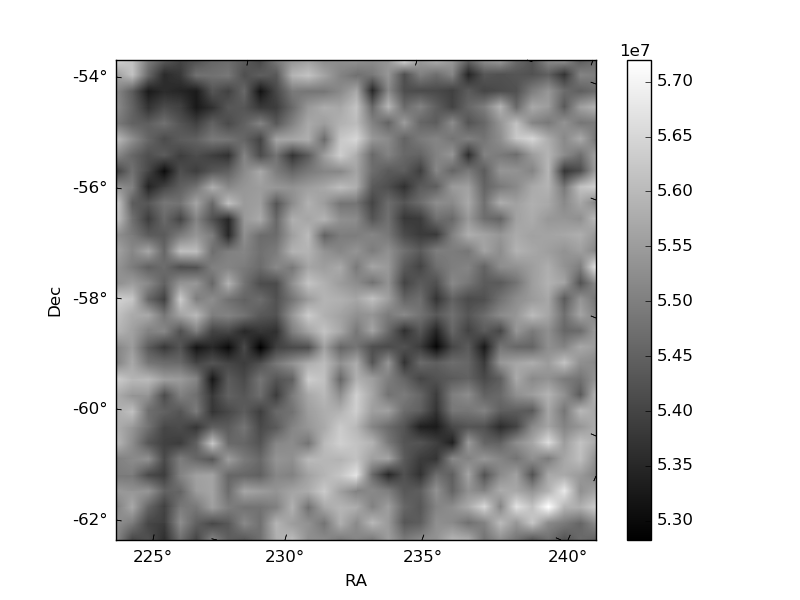
Histogram calculated using DETX and DETY for each event in the final _common_clean file
| Quadrant A | 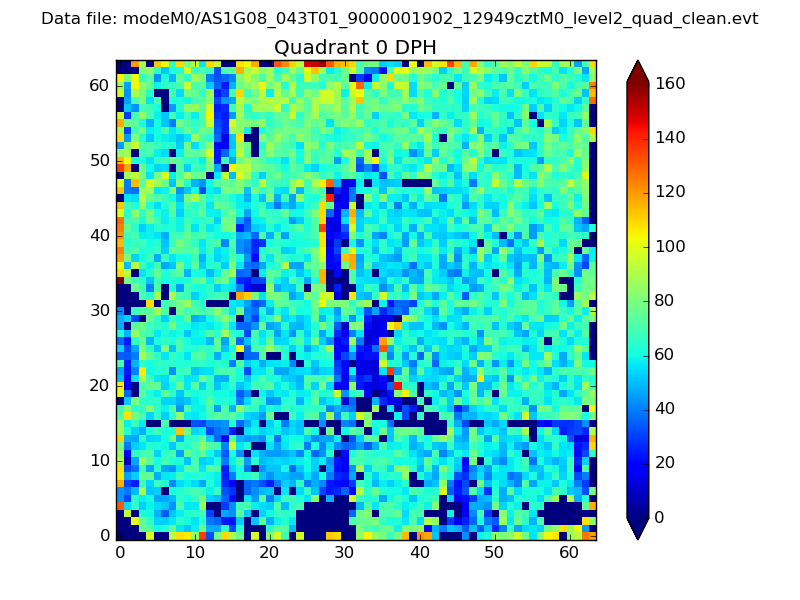 |
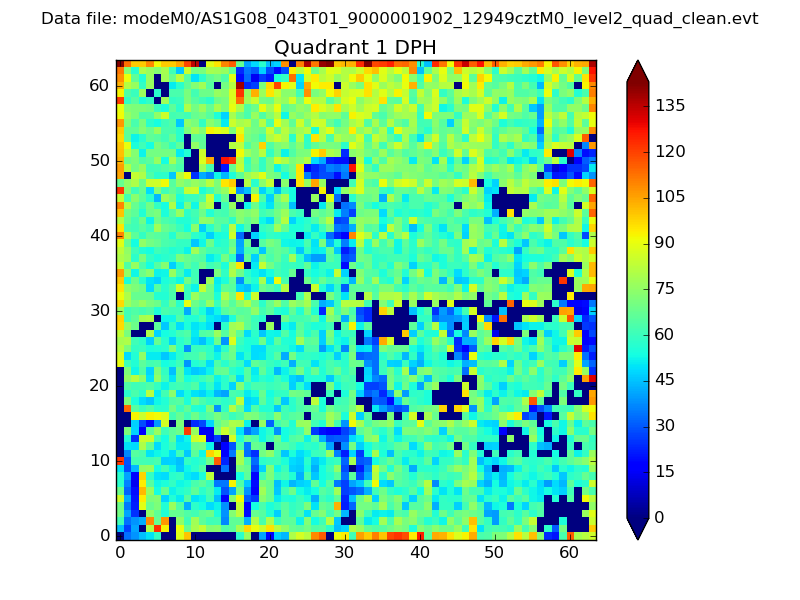 |
Quadrant B |
|---|---|---|---|
| Quadrant D | 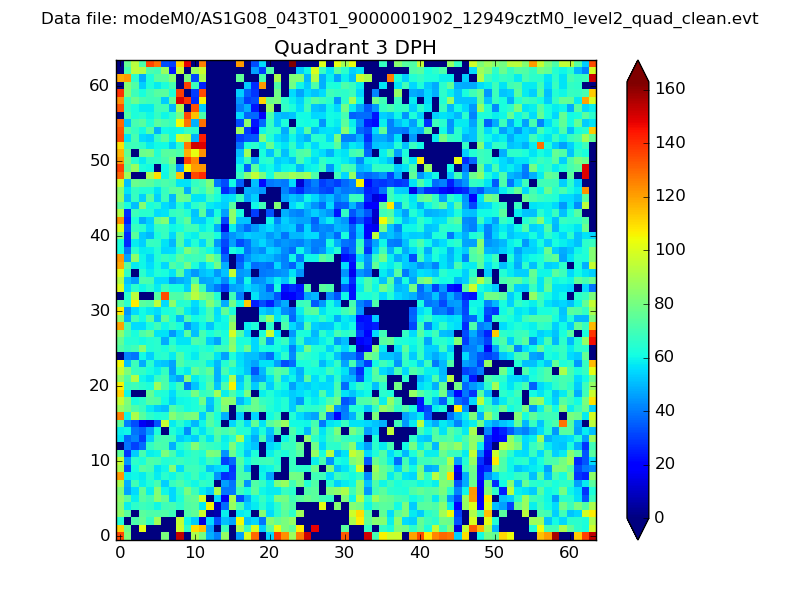 |
 |
Quadrant C |
| Plot type | Count rate plots | Images |
|---|---|---|
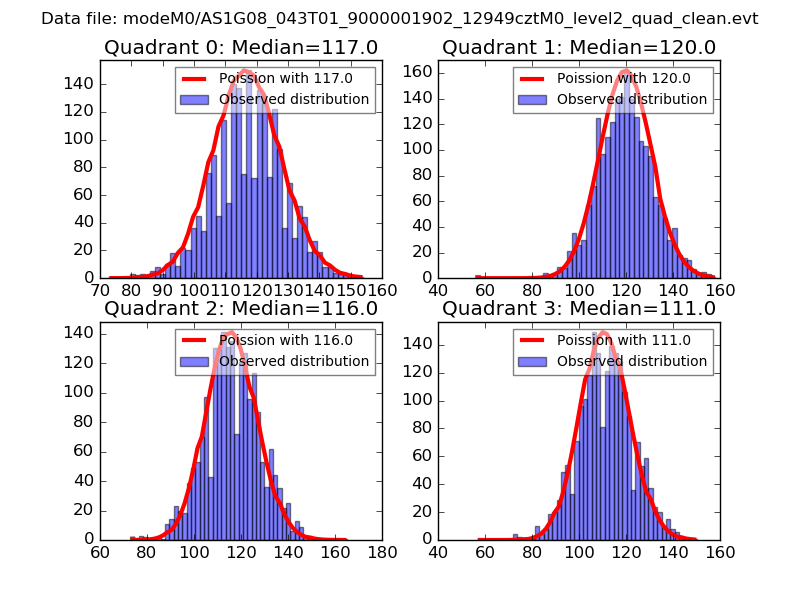
| Comparison with Poisson distribution Blue bars denote a histogram of data divided into 1 sec bins. Red curve is a Poisson curve with rate = median count rate of data. |
 |
 |
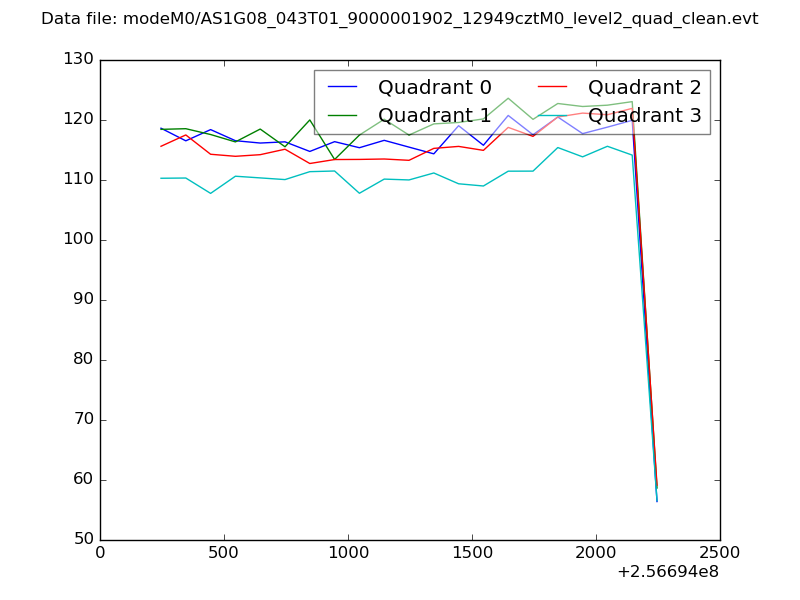
| Quadrant-wise count rates Data is divided into 100 sec bins |
 |
|
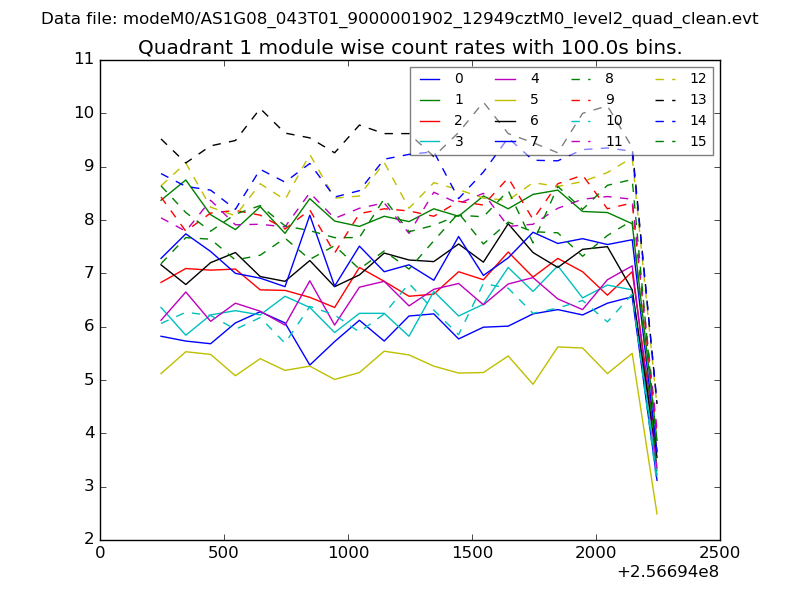
| Module-wise count rates for Quadrant A Data is divided into 100 sec bins |
 |
 |
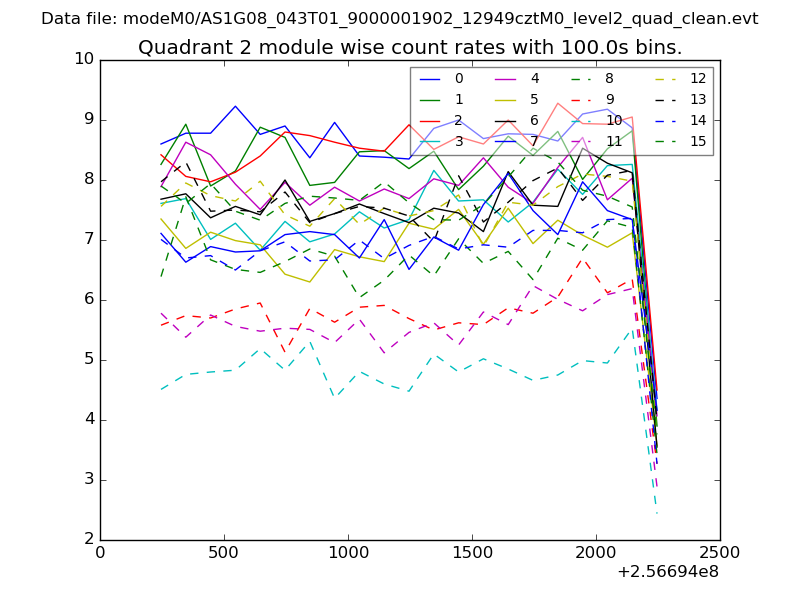
| Module-wise count rates for Quadrant B Data is divided into 100 sec bins |
 |
 |
| Module-wise count rates for Quadrant C Data is divided into 100 sec bins |
 |
 |
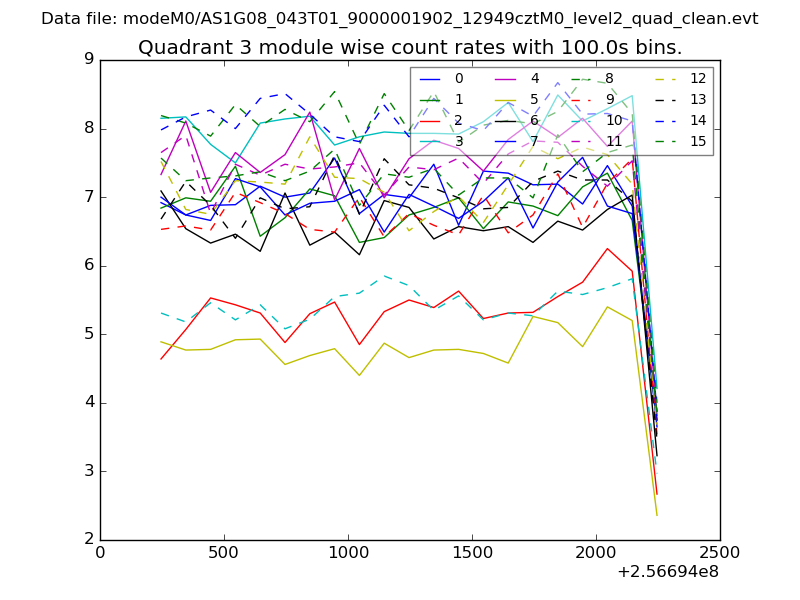
| Module-wise count rates for Quadrant D Data is divided into 100 sec bins |
 |
 |
| Parameter | Plot |
|---|---|
| CZT HV Monitor | 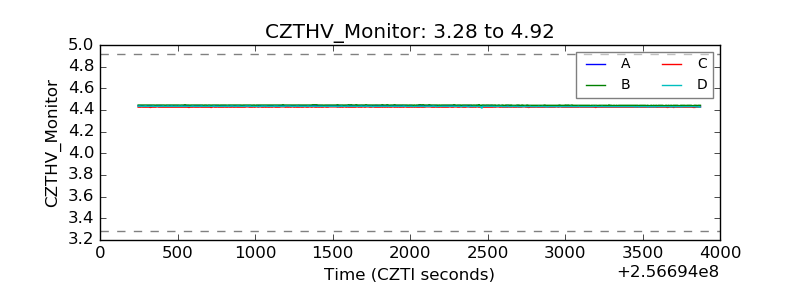 |
| D_VDD | 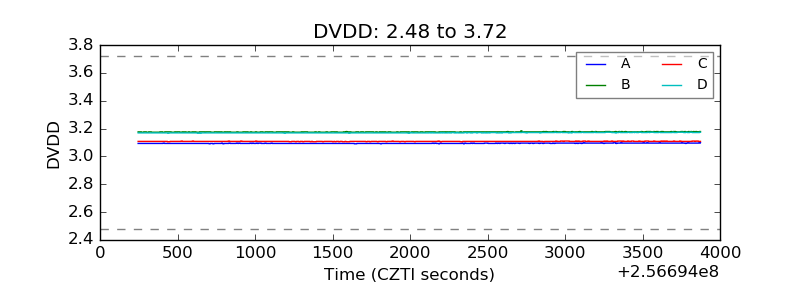 |
| Temperature 1 |  |
| Veto HV Monitor | 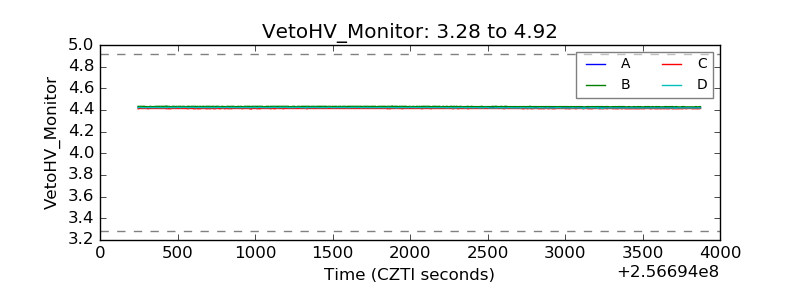 |
| Veto LLD | 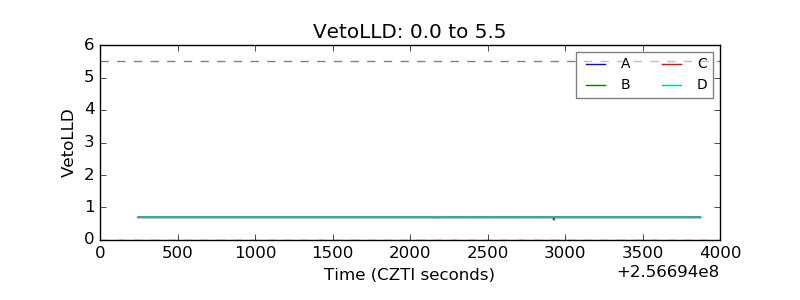 |
| Alpha Counter | 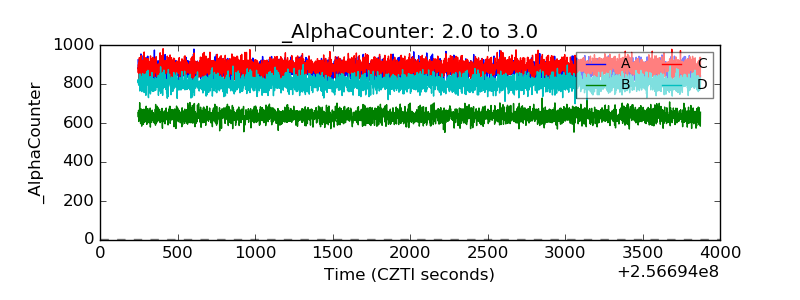 |
| _CPM_Rate | 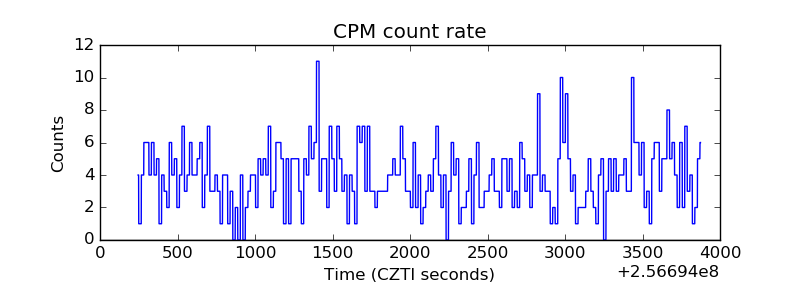 |
| CZT Counter | 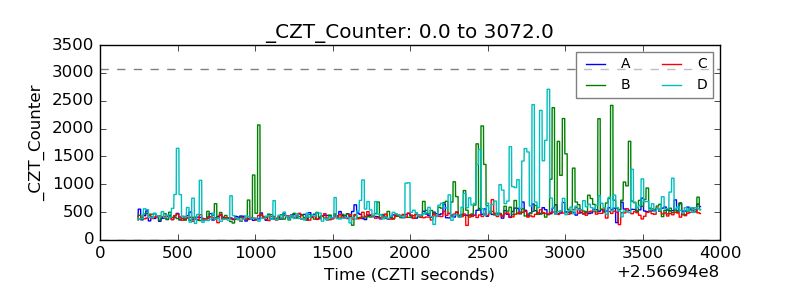 |
| +2.5 Volts monitor |  |
| +5 Volts monitor |  |
| _ROLL_ROT | 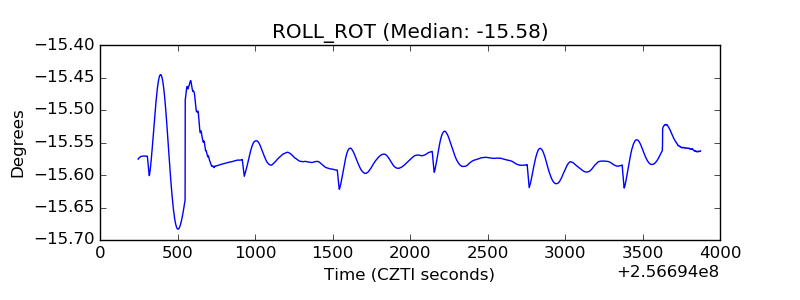 |
| _Roll_DEC | 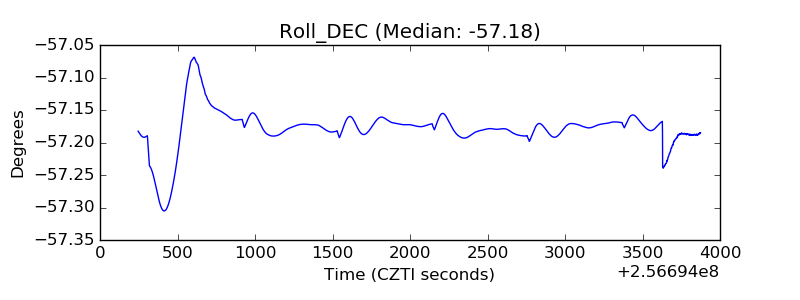 |
| _Roll_RA | 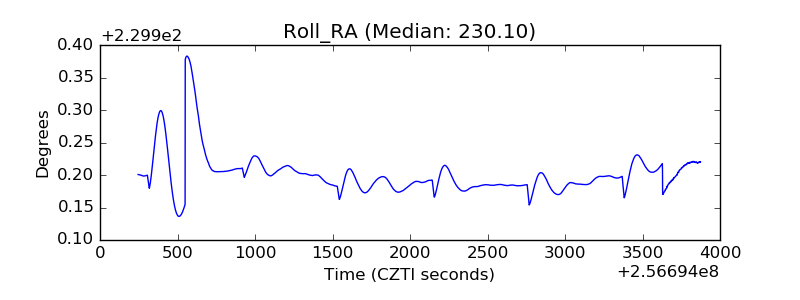 |
| Veto Counter | 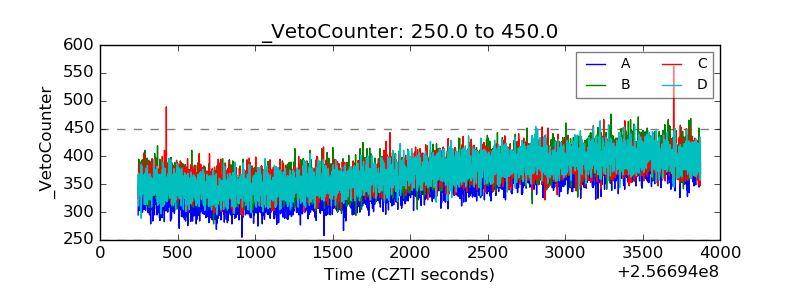 |