| Param | Original file | Final file |
|---|---|---|
| Filename | modeM0/AS1G08_043T01_9000001902_12951cztM0_level2.evt | modeM0/AS1G08_043T01_9000001902_12951cztM0_level2_quad_clean.evt |
| Size (bytes) | 526,939,200 | 100,788,480 |
| Size | 502.5 MB | 96.1 MB |
| Events in quadrant A | 3,750,015 | 645,417 |
| Events in quadrant B | 4,776,967 | 637,855 |
| Events in quadrant C | 3,322,359 | 656,064 |
| Events in quadrant D | 3,626,016 | 617,378 |
| Mode M0 | |||
|---|---|---|---|
| Quadrant | BADHDUFLAG | Total packets | Discarded packets |
| A | 0 | 15895 | 3 |
| B | 0 | 18850 | 2 |
| C | 0 | 14530 | 2 |
| D | 0 | 15592 | 2 |
| Mode M9 | |||
|---|---|---|---|
| Quadrant | BADHDUFLAG | Total packets | Discarded packets |
| A | 0 | 20 | 0 |
| B | 0 | 20 | 0 |
| C | 0 | 20 | 0 |
| D | 0 | 20 | 0 |
| Mode SS | |||
|---|---|---|---|
| Quadrant | BADHDUFLAG | Total packets | Discarded packets |
| A | 0 | 146 | 0 |
| B | 0 | 146 | 0 |
| C | 0 | 146 | 0 |
| D | 0 | 146 | 0 |
| Quadrant | Total seconds | Saturated seconds | Saturation percentage |
|---|---|---|---|
| A | 7116 | 58 | 0.815065% |
| B | 7116 | 594 | 8.347386% |
| C | 7116 | 48 | 0.674536% |
| D | 7116 | 81 | 1.138280% |
Noise dominated data is calculated using 1-second bins in cleaned event files. If a bin has >2000 counts, and if more than 50% of those come from <1% of pixels, then it is considered to be noise-dominated and hence unusable.
| Quadrant | # 1 sec bins | Bins with >0 counts | Bins with >2000 counts | High rate bins dominated by noise | Noise dominated (total time) | Noise dominated (detector-on time) | Marked lightcurve |
|---|---|---|---|---|---|---|---|
| A | 9162 | 7119 | 8 | 8 | 0.09% | 0.11% | 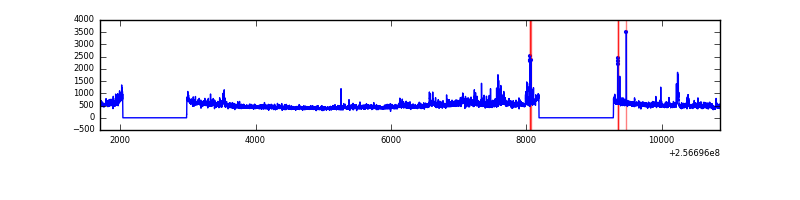 |
| B | 9162 | 7119 | 268 | 268 | 2.93% | 3.76% | 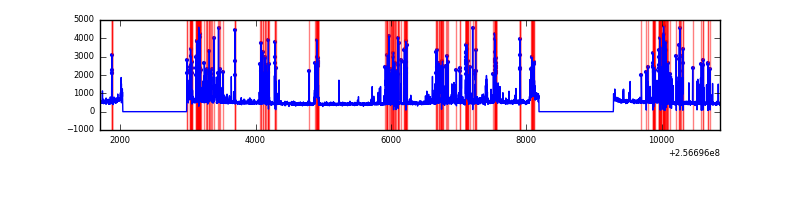 |
| C | 9162 | 7119 | 1 | 1 | 0.01% | 0.01% | 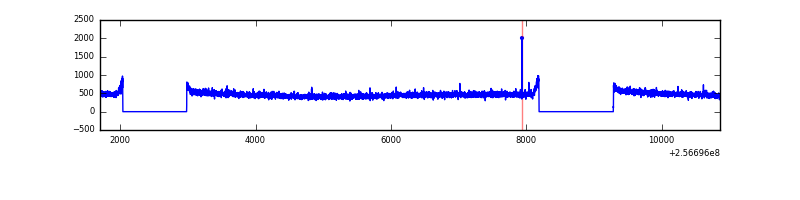 |
| D | 9162 | 7119 | 45 | 45 | 0.49% | 0.63% | 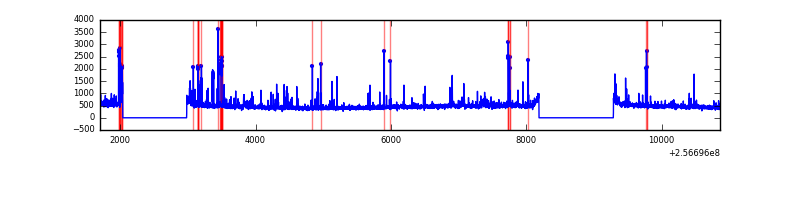 |
Top three noisy pixels from each quadrant. If the there are fewer than three noisy pixels in the level2.evt file, extra rows are filled as -1
| Pixel properties | Quadrant properties | ||||||
|---|---|---|---|---|---|---|---|
| Quadrant | DetID | PixID | Counts | Sigma | Mean | Median | Sigma |
| A | 15 | 239 | 224568 | 1282.76 | 856 | 837 | 174.4 |
| A | 1 | 162 | 94593 | 537.55 | 856 | 837 | 174.4 |
| A | 1 | 178 | 45299 | 254.92 | 856 | 837 | 174.4 |
| B | 4 | 239 | 1047254 | 6640.38 | 835 | 811 | 157.6 |
| B | 3 | 64 | 362124 | 2292.77 | 835 | 811 | 157.6 |
| B | 0 | 197 | 52573 | 328.46 | 835 | 811 | 157.6 |
| C | 13 | 61 | 6262 | 27.4 | 851 | 854 | 197.4 |
| C | 14 | 234 | 3218 | 11.98 | 851 | 854 | 197.4 |
| C | 8 | 222 | 2250 | 7.07 | 851 | 854 | 197.4 |
| D | 1 | 52 | 353694 | 1780.62 | 837 | 813 | 198.2 |
| D | 8 | 195 | 76725 | 383.05 | 837 | 813 | 198.2 |
| D | 2 | 234 | 26108 | 127.64 | 837 | 813 | 198.2 |
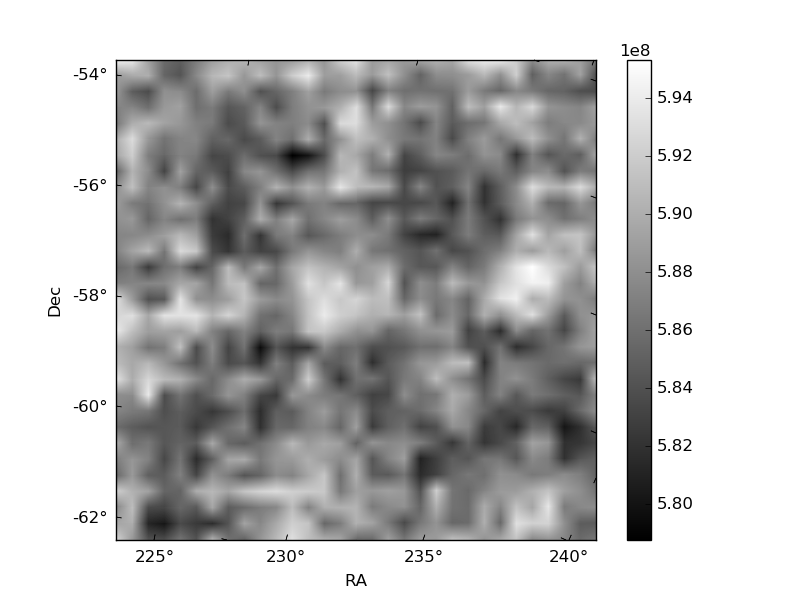
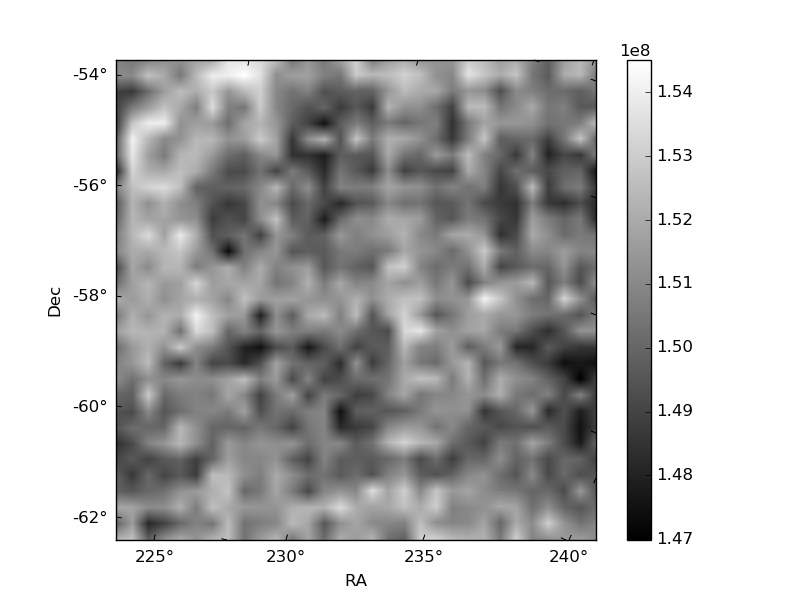
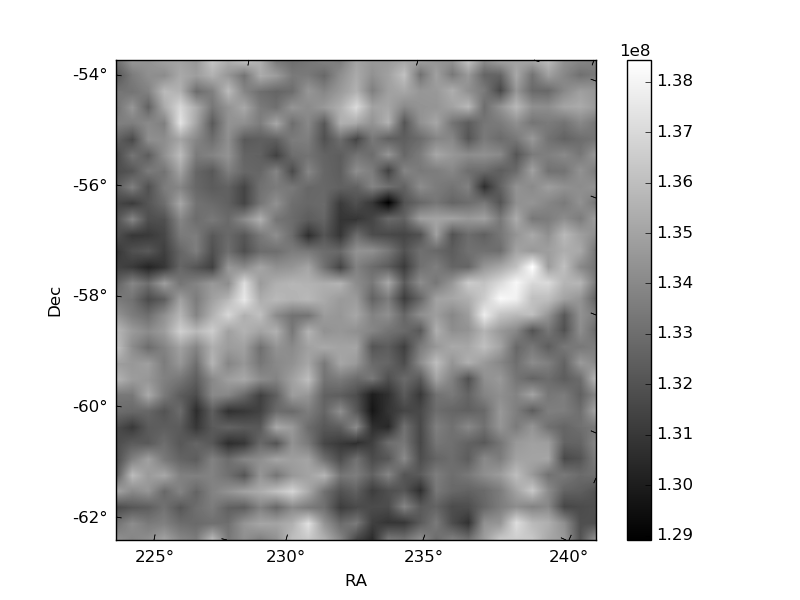
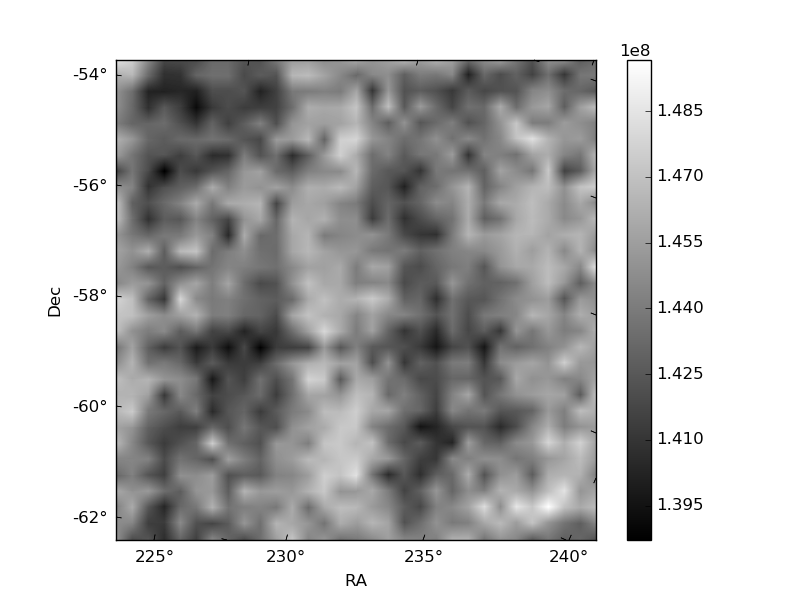
Histogram calculated using DETX and DETY for each event in the final _common_clean file
| Quadrant A | 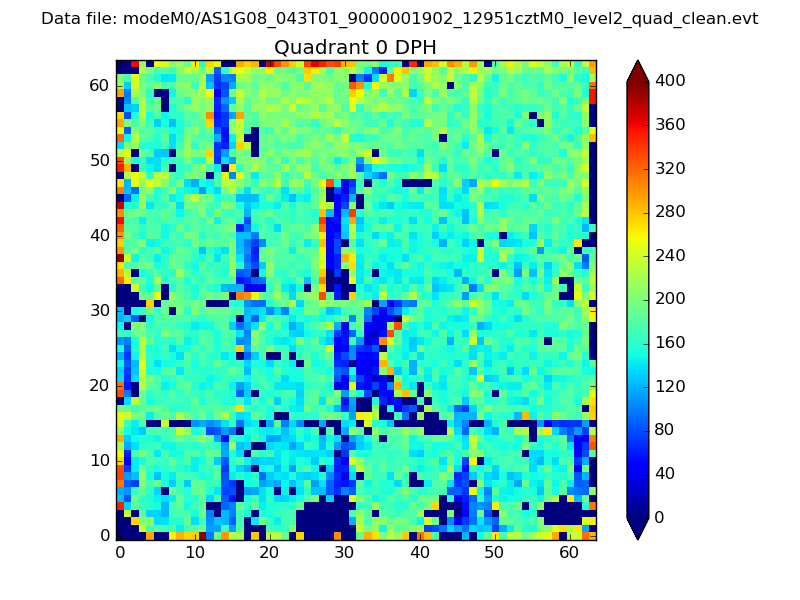 |
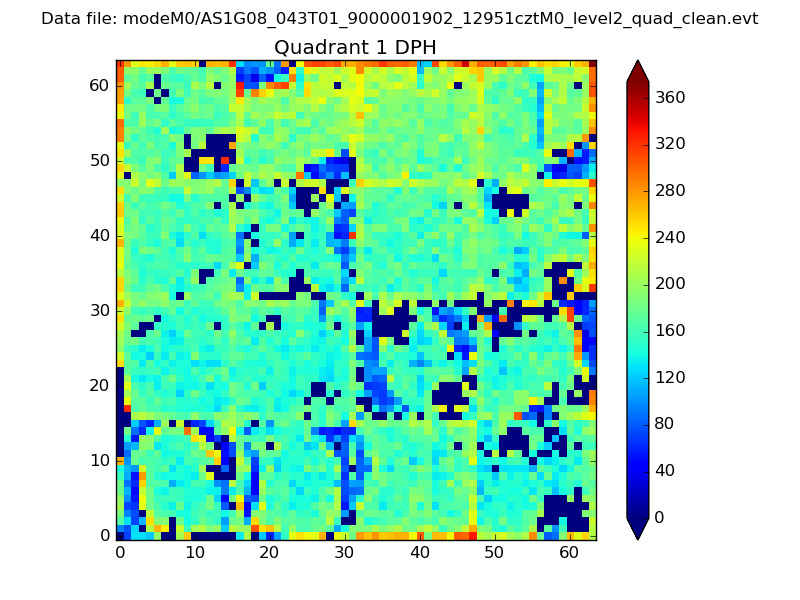 |
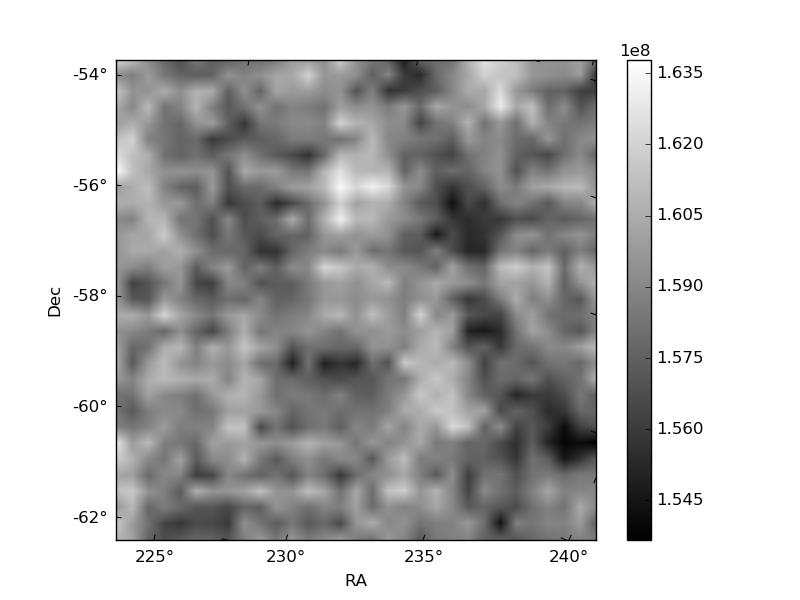
Quadrant B |
|---|---|---|---|
| Quadrant D | 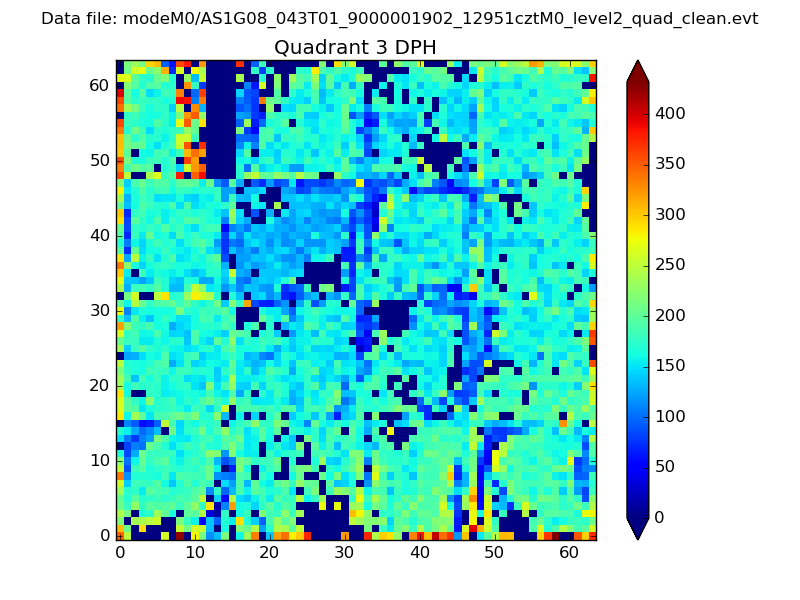 |
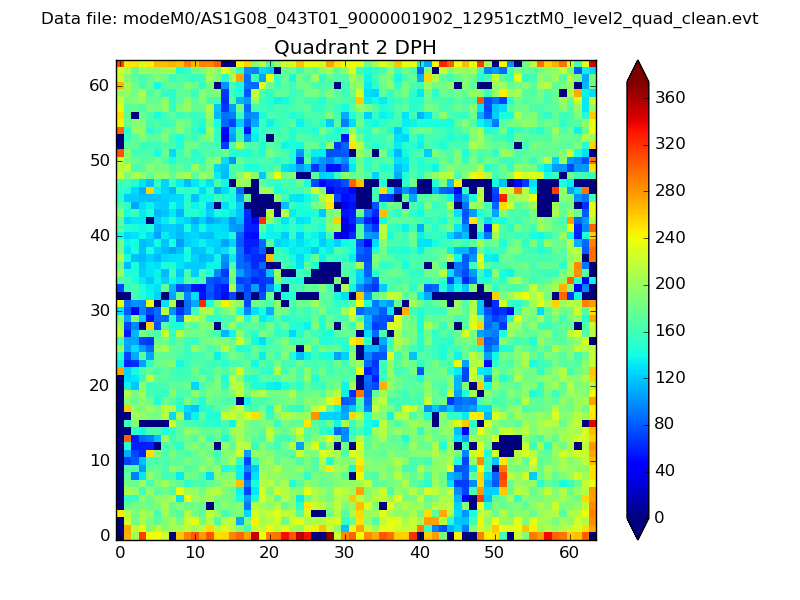 |
Quadrant C |
| Plot type | Count rate plots | Images |
|---|---|---|
| Comparison with Poisson distribution Blue bars denote a histogram of data divided into 1 sec bins. Red curve is a Poisson curve with rate = median count rate of data. |
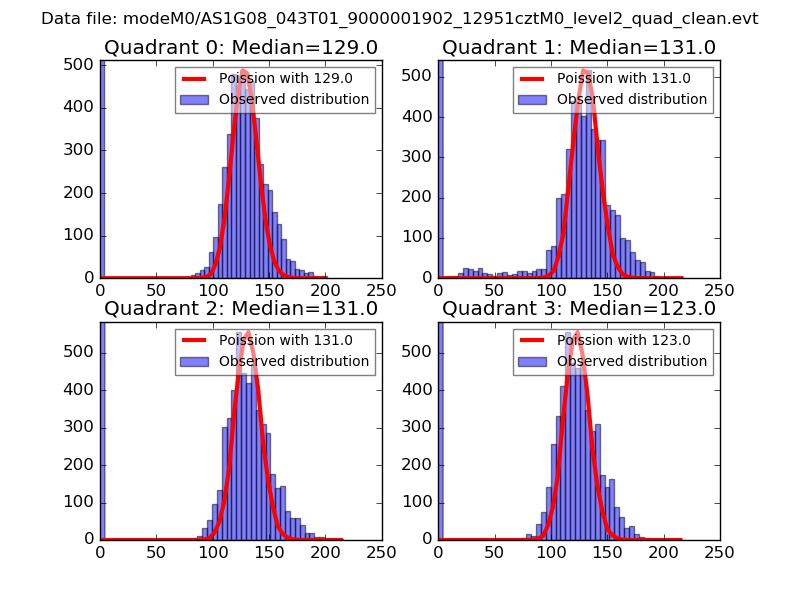 |
 |
| Quadrant-wise count rates Data is divided into 100 sec bins |
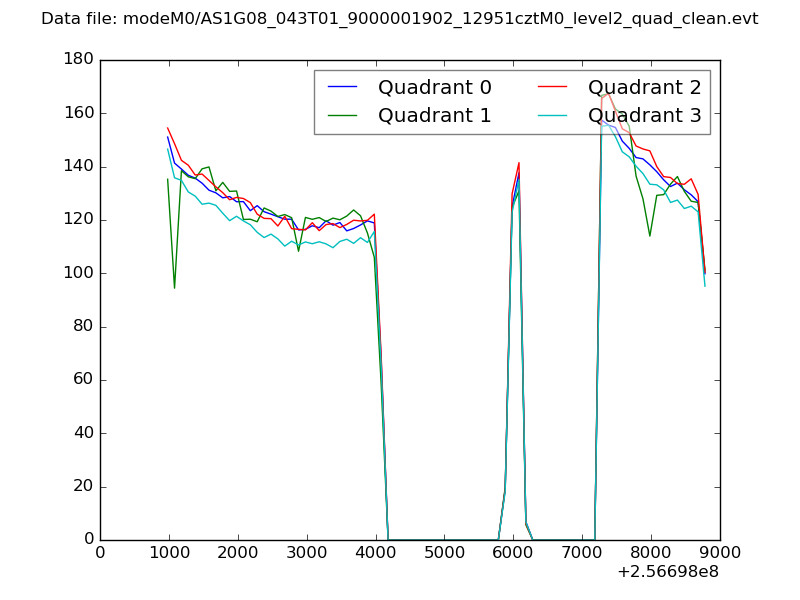 |
|
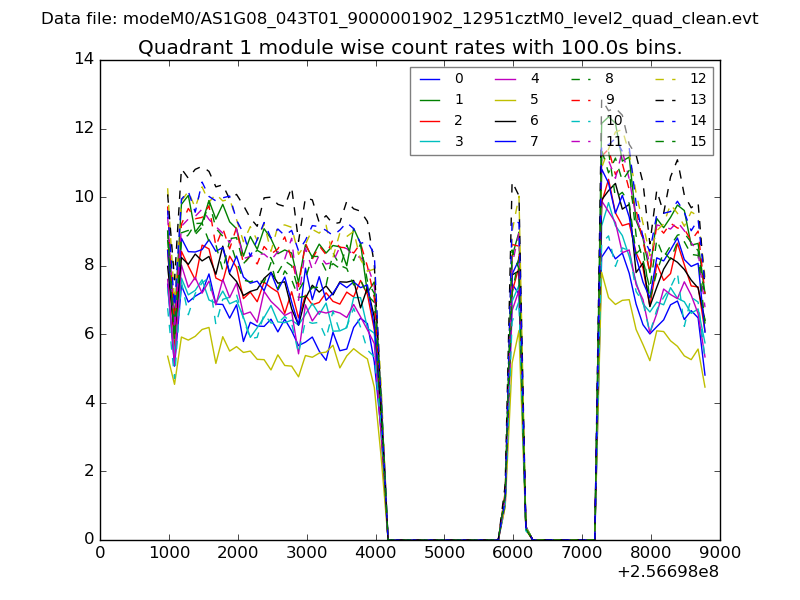
| Module-wise count rates for Quadrant A Data is divided into 100 sec bins |
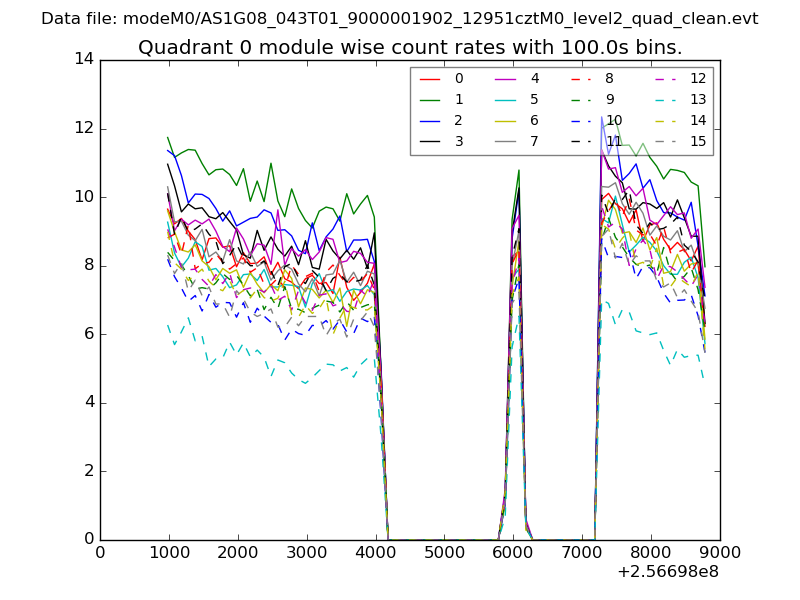 |
 |
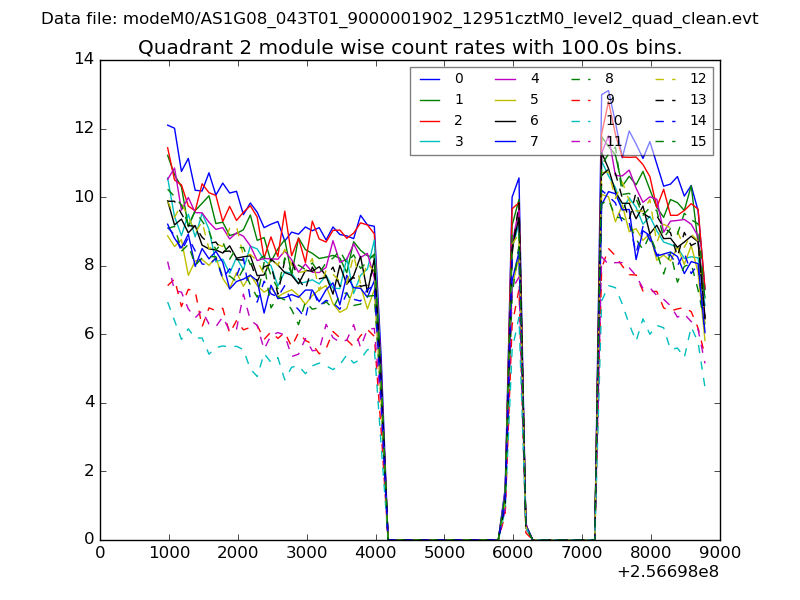
| Module-wise count rates for Quadrant B Data is divided into 100 sec bins |
 |
 |
| Module-wise count rates for Quadrant C Data is divided into 100 sec bins |
 |
 |
| Module-wise count rates for Quadrant D Data is divided into 100 sec bins |
 |
 |
| Parameter | Plot |
|---|---|
| CZT HV Monitor |  |
| D_VDD |  |
| Temperature 1 | 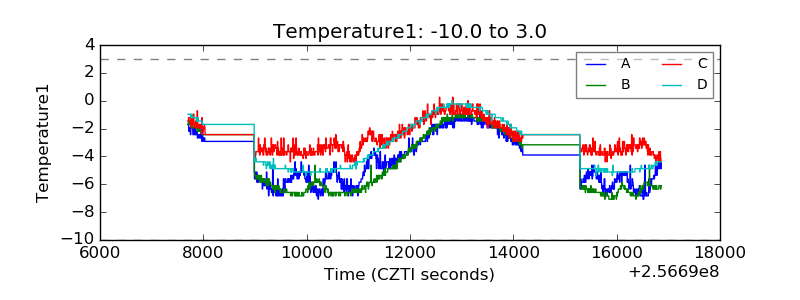 |
| Veto HV Monitor | 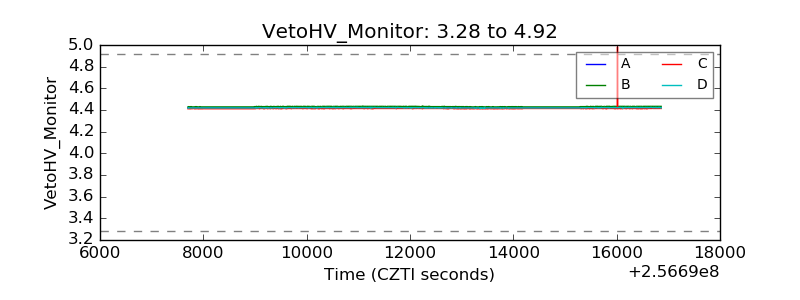 |
| Veto LLD |  |
| Alpha Counter | 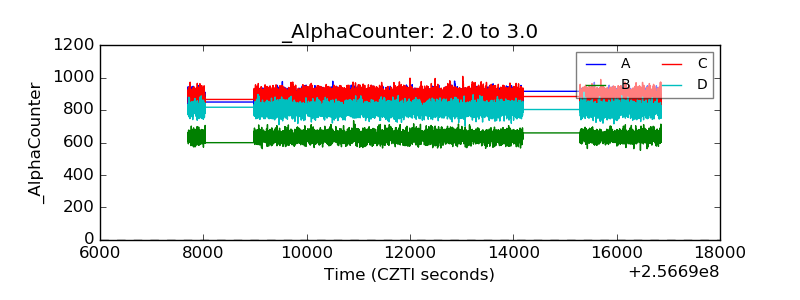 |
| _CPM_Rate | 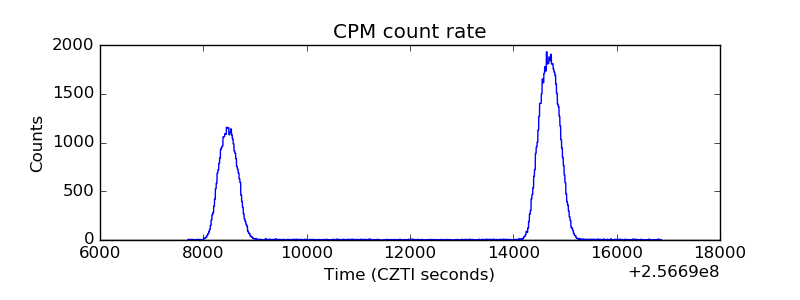 |
| CZT Counter | 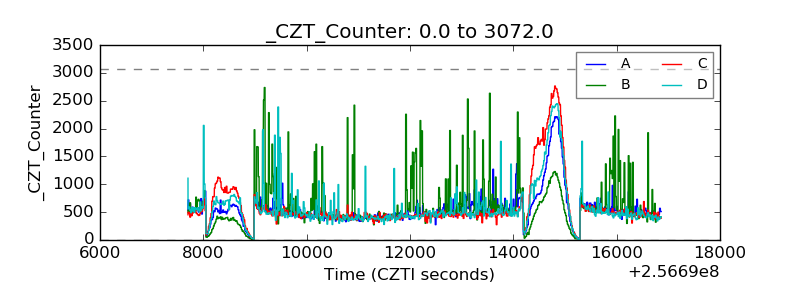 |
| +2.5 Volts monitor |  |
| +5 Volts monitor |  |
| _ROLL_ROT | 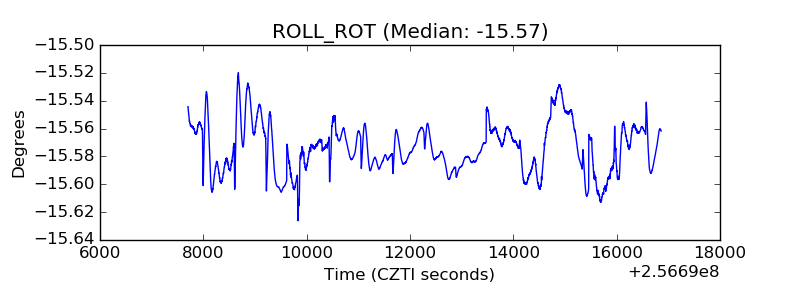 |
| _Roll_DEC | 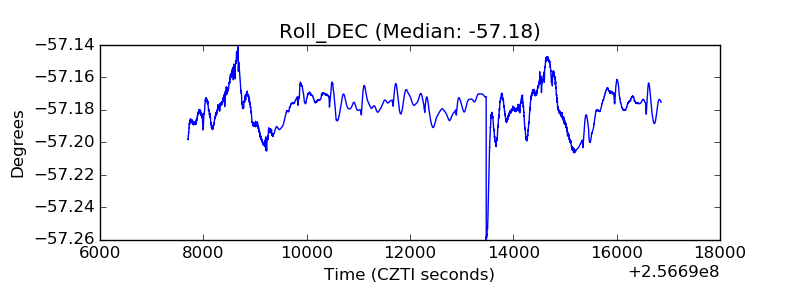 |
| _Roll_RA | 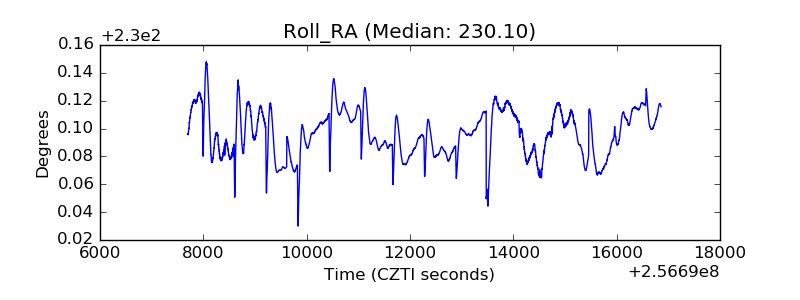 |
| Veto Counter |  |