| Param | Original file | Final file |
|---|---|---|
| Filename | modeM0/AS1G08_043T01_9000001902_12952cztM0_level2.evt | modeM0/AS1G08_043T01_9000001902_12952cztM0_level2_quad_clean.evt |
| Size (bytes) | 472,250,880 | 86,408,640 |
| Size | 450.4 MB | 82.4 MB |
| Events in quadrant A | 3,019,376 | 570,706 |
| Events in quadrant B | 4,912,824 | 504,579 |
| Events in quadrant C | 2,829,948 | 580,364 |
| Events in quadrant D | 3,137,689 | 547,221 |
| Mode M0 | |||
|---|---|---|---|
| Quadrant | BADHDUFLAG | Total packets | Discarded packets |
| A | 0 | 12532 | 2 |
| B | 0 | 18509 | 1 |
| C | 0 | 12206 | 1 |
| D | 0 | 13310 | 1 |
| Mode M9 | |||
|---|---|---|---|
| Quadrant | BADHDUFLAG | Total packets | Discarded packets |
| A | 0 | 12 | 0 |
| B | 0 | 12 | 0 |
| C | 0 | 12 | 0 |
| D | 0 | 12 | 0 |
| Mode SS | |||
|---|---|---|---|
| Quadrant | BADHDUFLAG | Total packets | Discarded packets |
| A | 0 | 120 | 0 |
| B | 0 | 120 | 0 |
| C | 0 | 120 | 0 |
| D | 0 | 120 | 0 |
| Quadrant | Total seconds | Saturated seconds | Saturation percentage |
|---|---|---|---|
| A | 5919 | 15 | 0.253421% |
| B | 5919 | 1127 | 19.040378% |
| C | 5919 | 23 | 0.388579% |
| D | 5919 | 26 | 0.439263% |
Noise dominated data is calculated using 1-second bins in cleaned event files. If a bin has >2000 counts, and if more than 50% of those come from <1% of pixels, then it is considered to be noise-dominated and hence unusable.
| Quadrant | # 1 sec bins | Bins with >0 counts | Bins with >2000 counts | High rate bins dominated by noise | Noise dominated (total time) | Noise dominated (detector-on time) | Marked lightcurve |
|---|---|---|---|---|---|---|---|
| A | 7130 | 5921 | 0 | 0 | 0.00% | 0.00% | 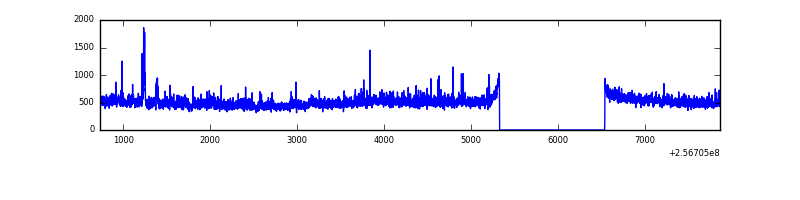 |
| B | 7130 | 5921 | 580 | 580 | 8.13% | 9.80% | 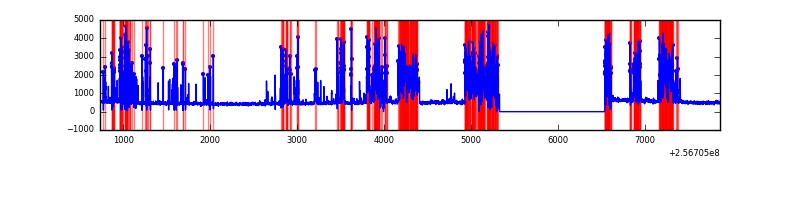 |
| C | 7130 | 5921 | 0 | 0 | 0.00% | 0.00% | 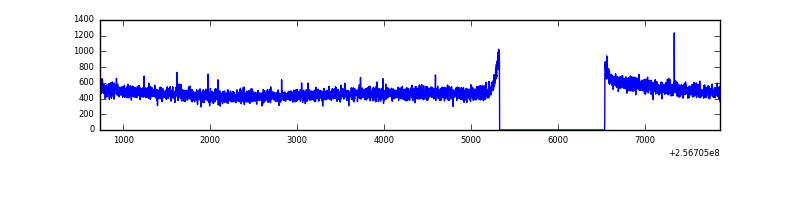 |
| D | 7130 | 5921 | 11 | 11 | 0.15% | 0.19% | 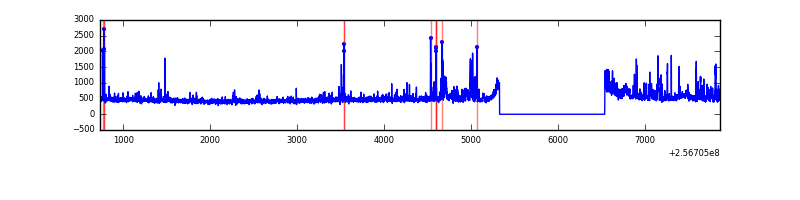 |
Top three noisy pixels from each quadrant. If the there are fewer than three noisy pixels in the level2.evt file, extra rows are filled as -1
| Pixel properties | Quadrant properties | ||||||
|---|---|---|---|---|---|---|---|
| Quadrant | DetID | PixID | Counts | Sigma | Mean | Median | Sigma |
| A | 15 | 239 | 62792 | 419.51 | 727 | 710 | 148.0 |
| A | 1 | 162 | 53748 | 358.39 | 727 | 710 | 148.0 |
| A | 12 | 189 | 43337 | 288.04 | 727 | 710 | 148.0 |
| B | 4 | 239 | 1924239 | 16141.77 | 638 | 623 | 119.2 |
| B | 0 | 85 | 349957 | 2931.39 | 638 | 623 | 119.2 |
| B | 3 | 64 | 118533 | 989.43 | 638 | 623 | 119.2 |
| C | 13 | 61 | 5324 | 27.75 | 725 | 729 | 165.6 |
| C | 14 | 234 | 1955 | 7.4 | 725 | 729 | 165.6 |
| C | 3 | 202 | 1789 | 6.4 | 725 | 729 | 165.6 |
| D | 1 | 52 | 336729 | 1955.79 | 718 | 699 | 171.8 |
| D | 8 | 195 | 29959 | 170.3 | 718 | 699 | 171.8 |
| D | 13 | 104 | 26567 | 150.56 | 718 | 699 | 171.8 |
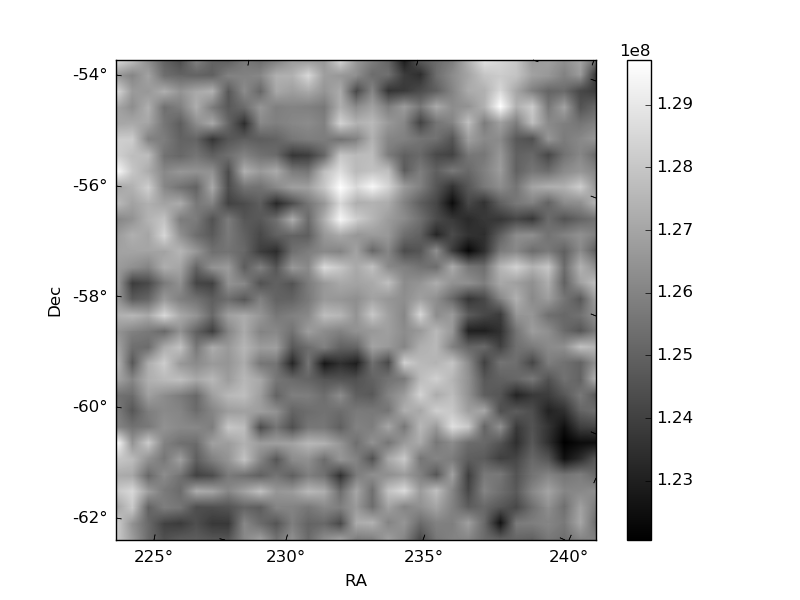
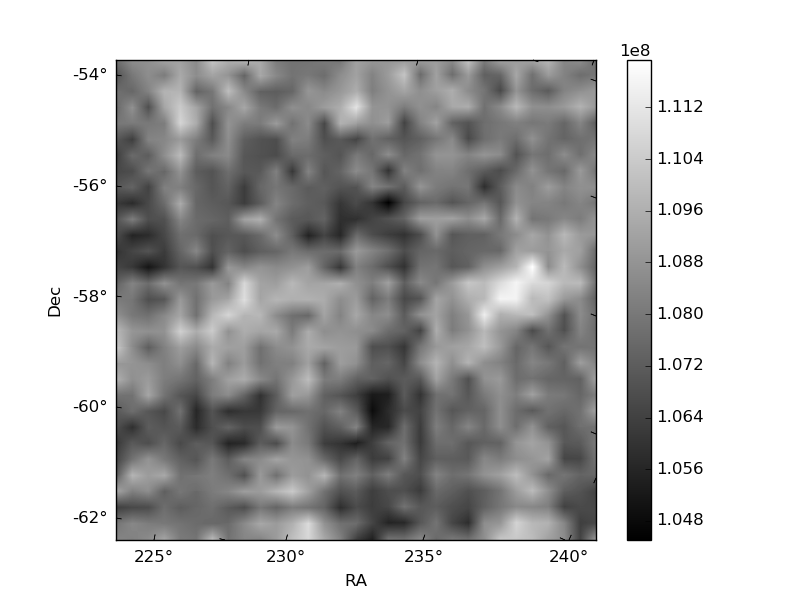
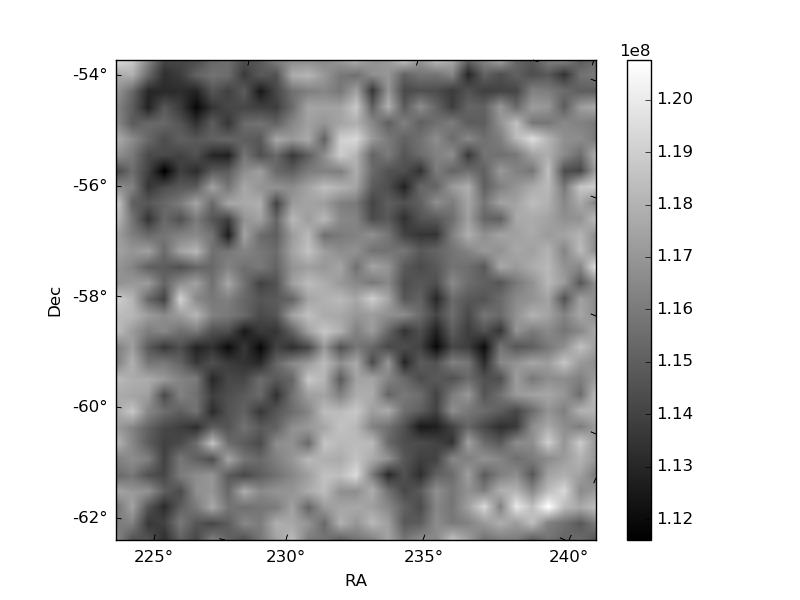
Histogram calculated using DETX and DETY for each event in the final _common_clean file
| Quadrant A | 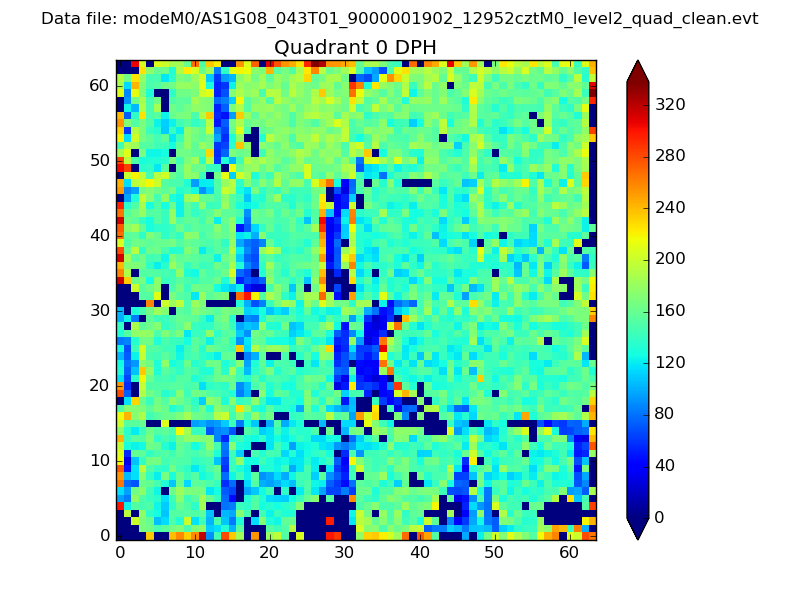 |
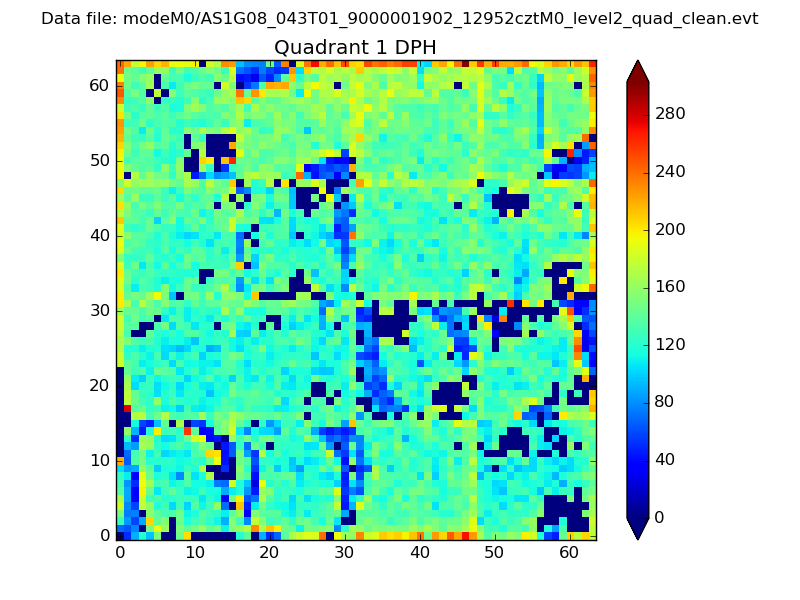 |
Quadrant B |
|---|---|---|---|
| Quadrant D |  |
 |
Quadrant C |
| Plot type | Count rate plots | Images |
|---|---|---|
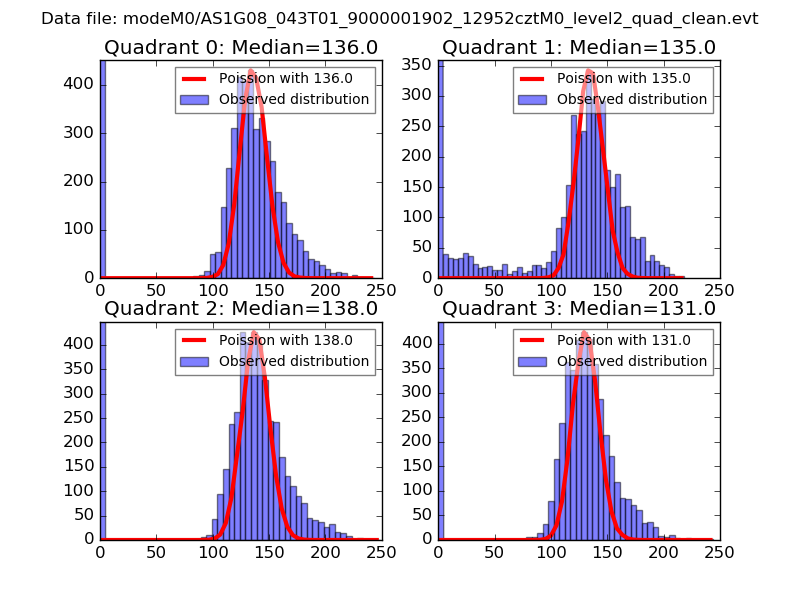
| Comparison with Poisson distribution Blue bars denote a histogram of data divided into 1 sec bins. Red curve is a Poisson curve with rate = median count rate of data. |
 |
 |
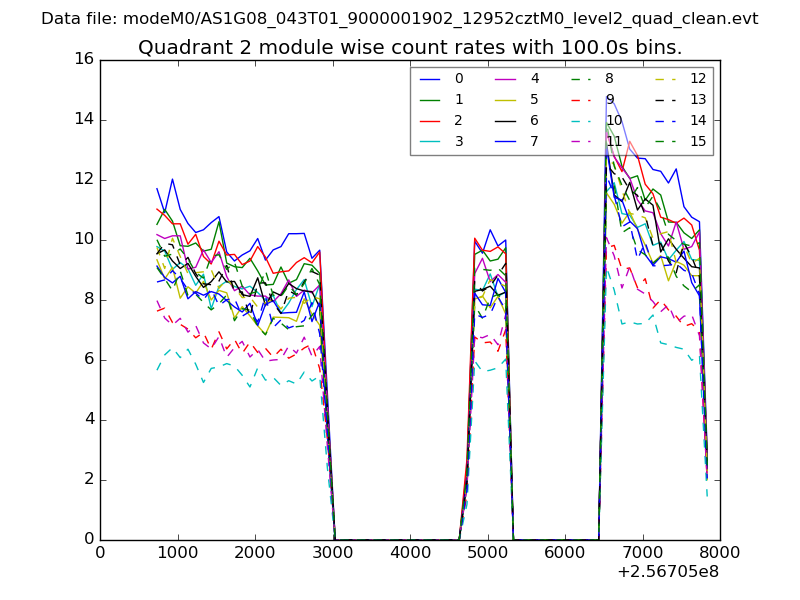
| Quadrant-wise count rates Data is divided into 100 sec bins |
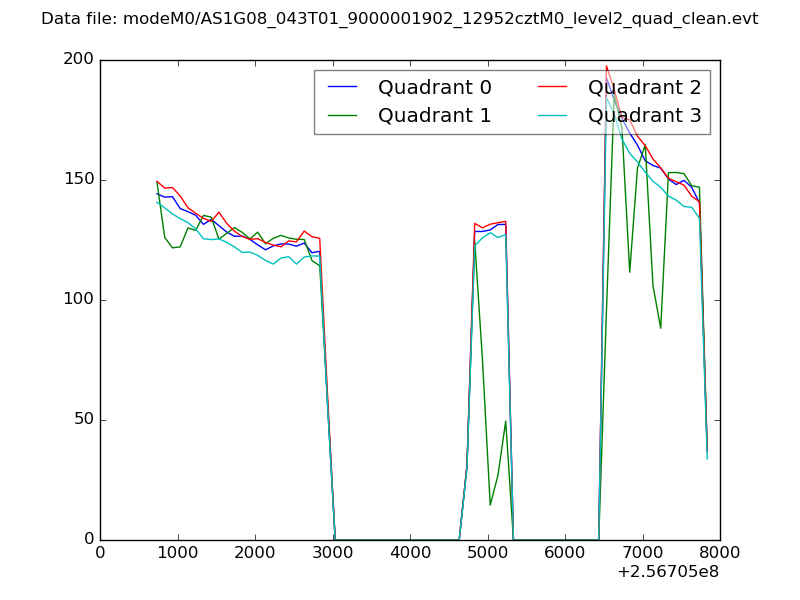 |
|
| Module-wise count rates for Quadrant A Data is divided into 100 sec bins |
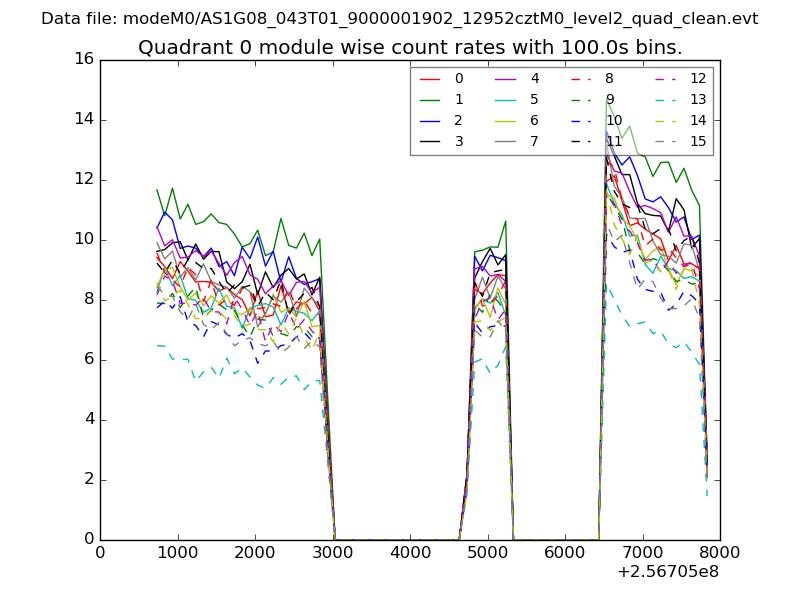 |
 |
| Module-wise count rates for Quadrant B Data is divided into 100 sec bins |
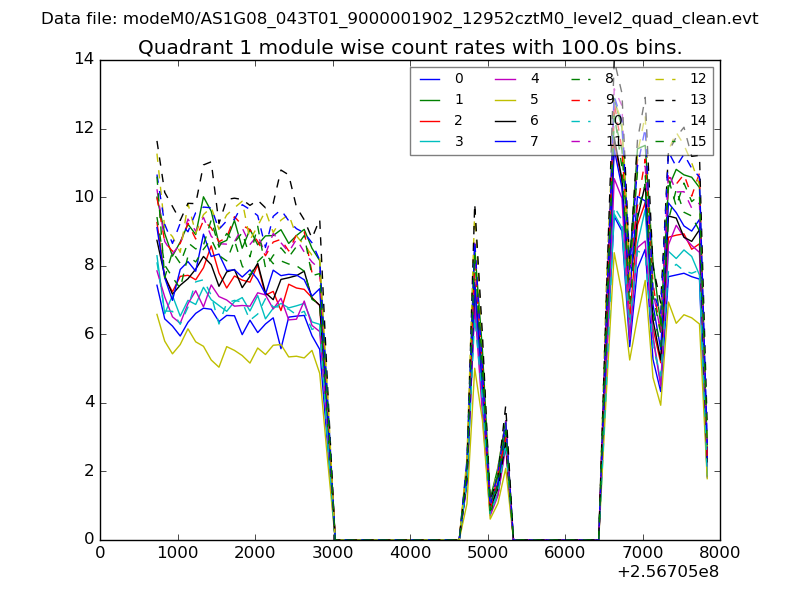 |
 |
| Module-wise count rates for Quadrant C Data is divided into 100 sec bins |
 |
 |
| Module-wise count rates for Quadrant D Data is divided into 100 sec bins |
 |
 |
| Parameter | Plot |
|---|---|
| CZT HV Monitor | 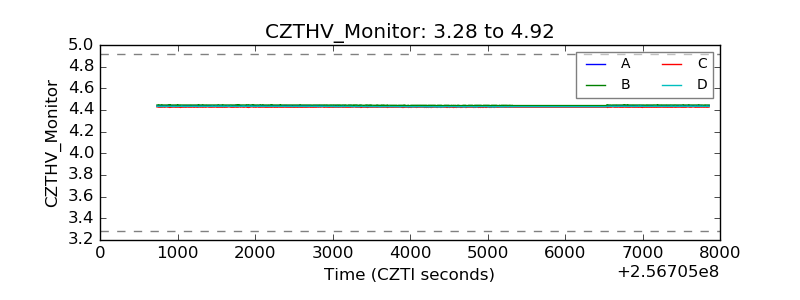 |
| D_VDD | 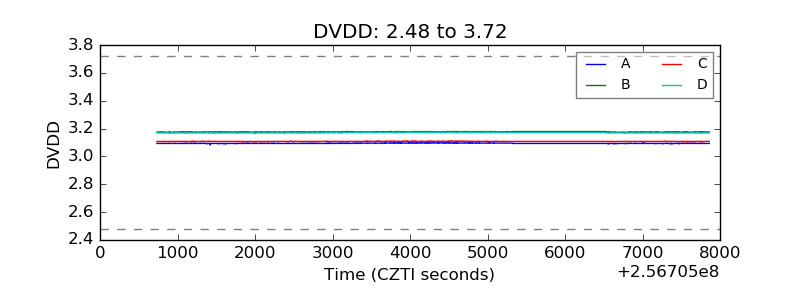 |
| Temperature 1 | 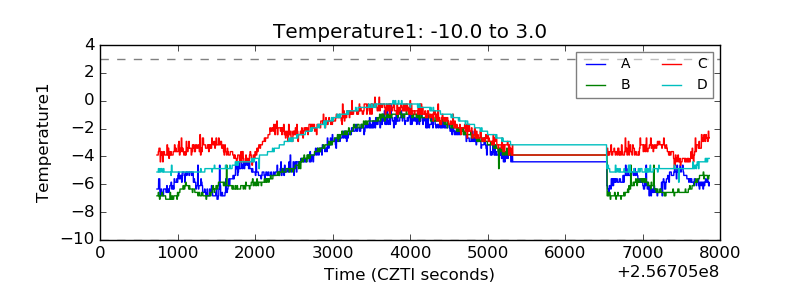 |
| Veto HV Monitor | 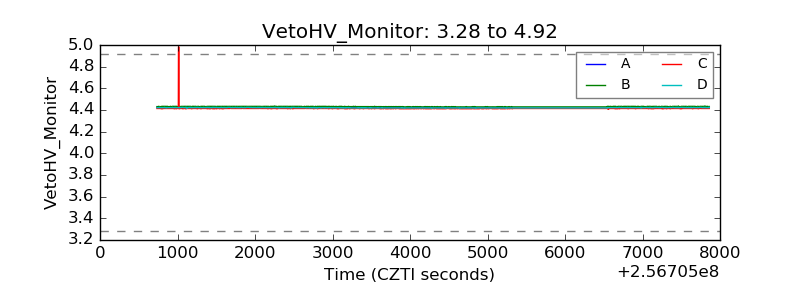 |
| Veto LLD | 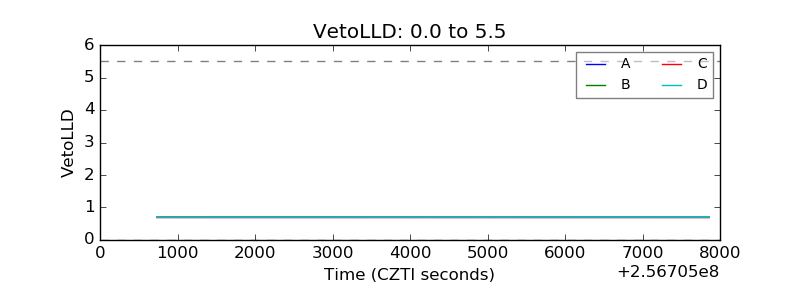 |
| Alpha Counter | 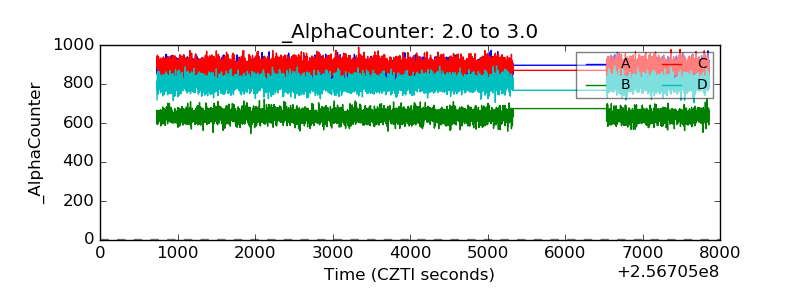 |
| _CPM_Rate | 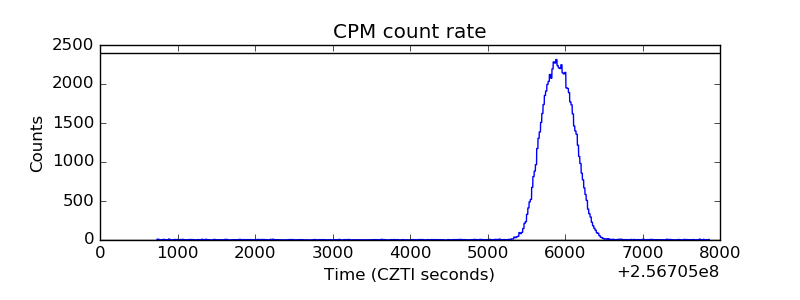 |
| CZT Counter |  |
| +2.5 Volts monitor |  |
| +5 Volts monitor | 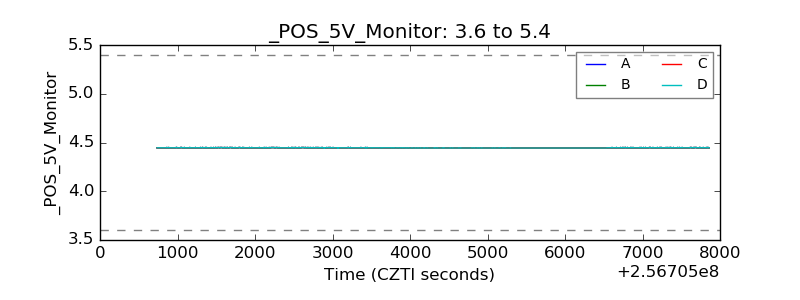 |
| _ROLL_ROT | 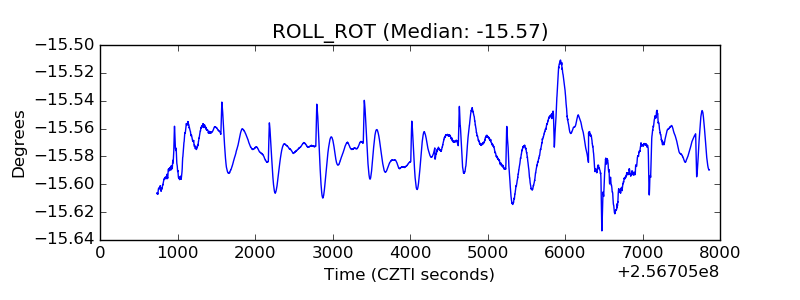 |
| _Roll_DEC | 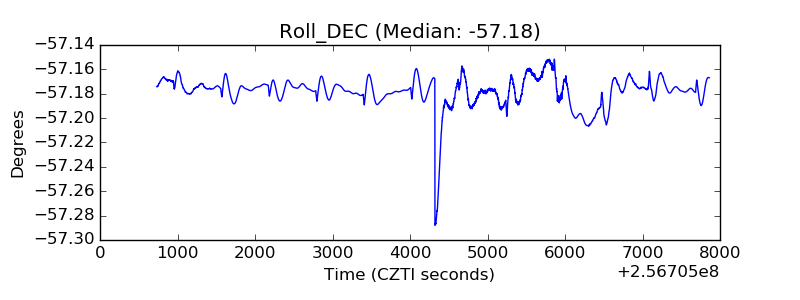 |
| _Roll_RA | 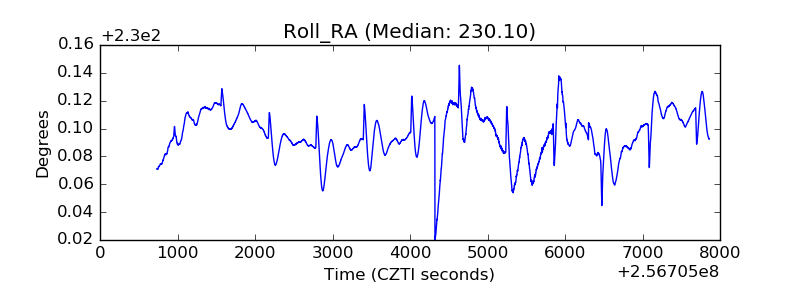 |
| Veto Counter | 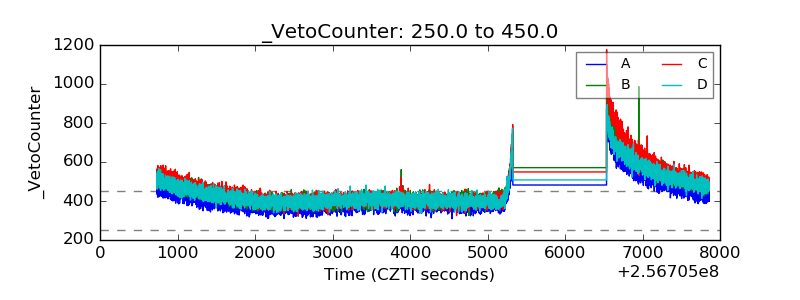 |