| Param | Original file | Final file |
|---|---|---|
| Filename | modeM0/AS1G08_043T01_9000001902_12954cztM0_level2.evt | modeM0/AS1G08_043T01_9000001902_12954cztM0_level2_quad_clean.evt |
| Size (bytes) | 513,581,760 | 92,226,240 |
| Size | 489.8 MB | 88.0 MB |
| Events in quadrant A | 3,188,923 | 630,930 |
| Events in quadrant B | 5,945,402 | 507,190 |
| Events in quadrant C | 2,999,398 | 635,350 |
| Events in quadrant D | 3,016,572 | 603,876 |
| Mode M0 | |||
|---|---|---|---|
| Quadrant | BADHDUFLAG | Total packets | Discarded packets |
| A | 0 | 12984 | 2 |
| B | 0 | 21427 | 1 |
| C | 0 | 12464 | 1 |
| D | 0 | 12643 | 1 |
| Mode M9 | |||
|---|---|---|---|
| Quadrant | BADHDUFLAG | Total packets | Discarded packets |
| A | 0 | 13 | 0 |
| B | 0 | 13 | 0 |
| C | 0 | 13 | 0 |
| D | 0 | 13 | 0 |
| Mode SS | |||
|---|---|---|---|
| Quadrant | BADHDUFLAG | Total packets | Discarded packets |
| A | 0 | 122 | 0 |
| B | 0 | 122 | 0 |
| C | 0 | 122 | 0 |
| D | 0 | 122 | 0 |
| Quadrant | Total seconds | Saturated seconds | Saturation percentage |
|---|---|---|---|
| A | 5937 | 54 | 0.909550% |
| B | 5937 | 1433 | 24.136769% |
| C | 5937 | 41 | 0.690584% |
| D | 5937 | 42 | 0.707428% |
Noise dominated data is calculated using 1-second bins in cleaned event files. If a bin has >2000 counts, and if more than 50% of those come from <1% of pixels, then it is considered to be noise-dominated and hence unusable.
| Quadrant | # 1 sec bins | Bins with >0 counts | Bins with >2000 counts | High rate bins dominated by noise | Noise dominated (total time) | Noise dominated (detector-on time) | Marked lightcurve |
|---|---|---|---|---|---|---|---|
| A | 7268 | 5939 | 0 | 0 | 0.00% | 0.00% | 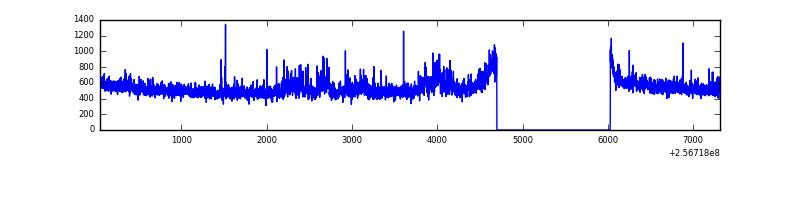 |
| B | 7267 | 5938 | 902 | 902 | 12.41% | 15.19% | 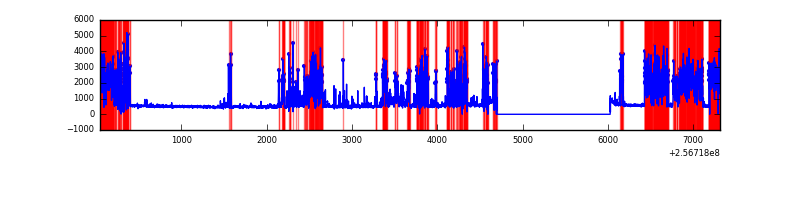 |
| C | 7268 | 5939 | 0 | 0 | 0.00% | 0.00% | 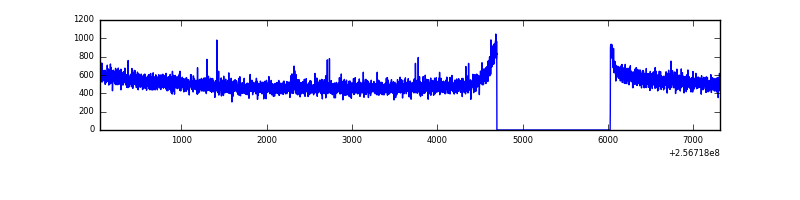 |
| D | 7268 | 5939 | 13 | 13 | 0.18% | 0.22% | 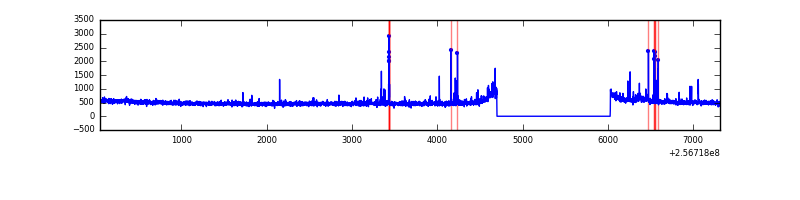 |
Top three noisy pixels from each quadrant. If the there are fewer than three noisy pixels in the level2.evt file, extra rows are filled as -1
| Pixel properties | Quadrant properties | ||||||
|---|---|---|---|---|---|---|---|
| Quadrant | DetID | PixID | Counts | Sigma | Mean | Median | Sigma |
| A | 12 | 189 | 152928 | 979.07 | 777 | 763 | 155.4 |
| A | 1 | 162 | 20461 | 126.74 | 777 | 763 | 155.4 |
| A | 1 | 178 | 8838 | 51.96 | 777 | 763 | 155.4 |
| B | 4 | 239 | 3017386 | 24889.56 | 654 | 640 | 121.2 |
| B | 3 | 64 | 285036 | 2346.4 | 654 | 640 | 121.2 |
| B | 0 | 85 | 52596 | 428.66 | 654 | 640 | 121.2 |
| C | 13 | 61 | 5600 | 27.52 | 768 | 775 | 175.3 |
| C | 8 | 222 | 2792 | 11.5 | 768 | 775 | 175.3 |
| C | 3 | 248 | 2612 | 10.48 | 768 | 775 | 175.3 |
| D | 1 | 52 | 84377 | 467.33 | 764 | 746 | 179.0 |
| D | 10 | 253 | 21055 | 113.49 | 764 | 746 | 179.0 |
| D | 2 | 234 | 18029 | 96.58 | 764 | 746 | 179.0 |
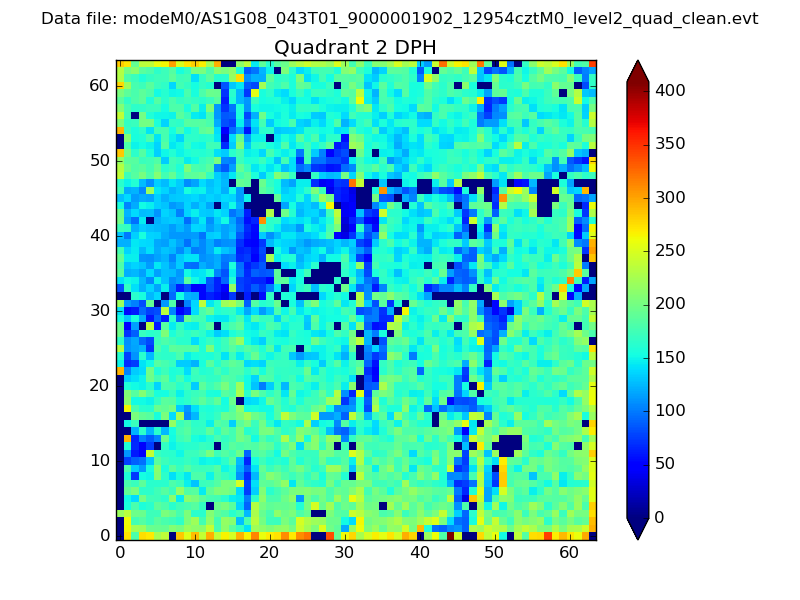
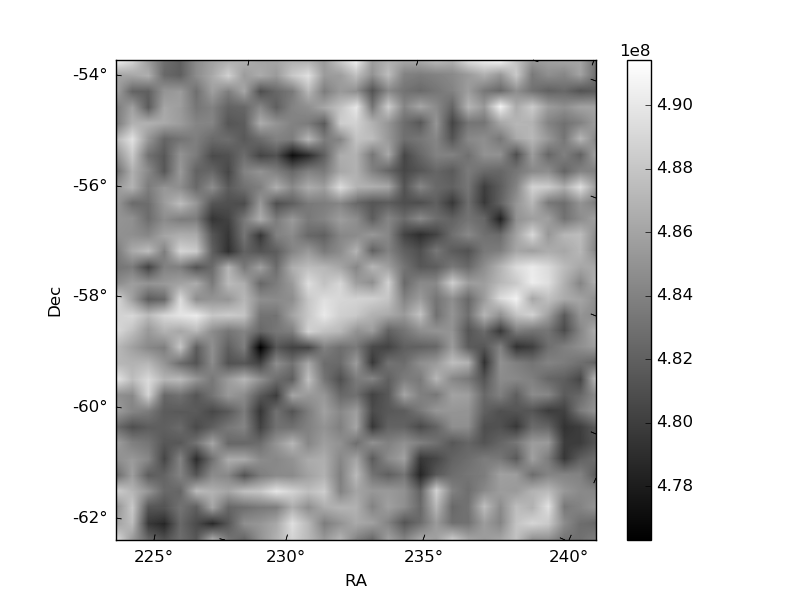
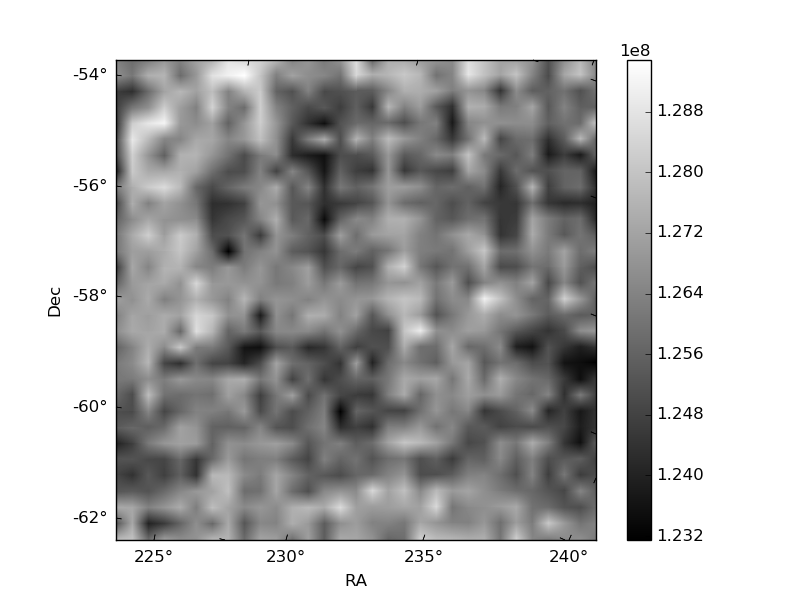
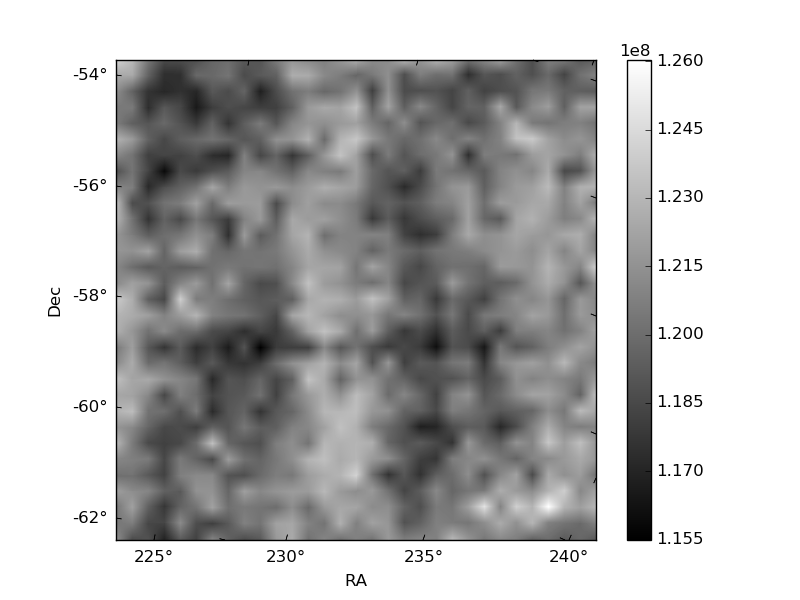
Histogram calculated using DETX and DETY for each event in the final _common_clean file
| Quadrant A | 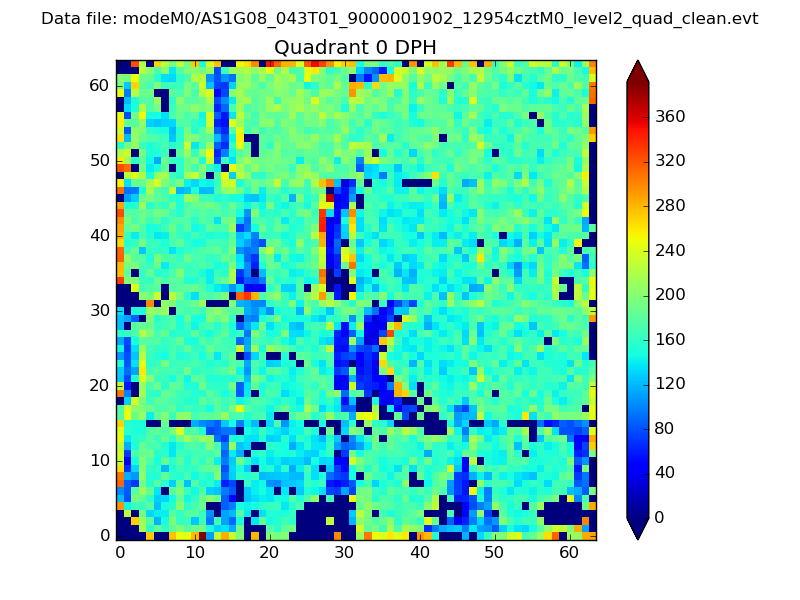 |
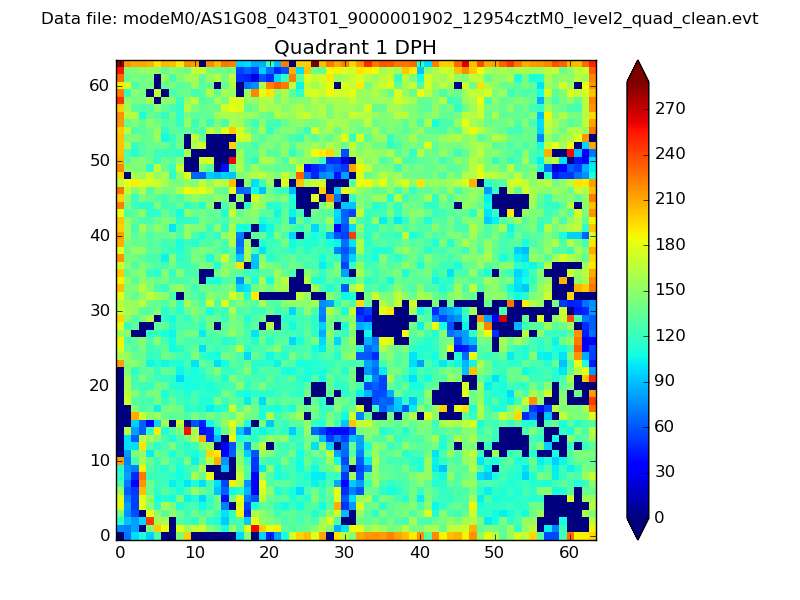 |
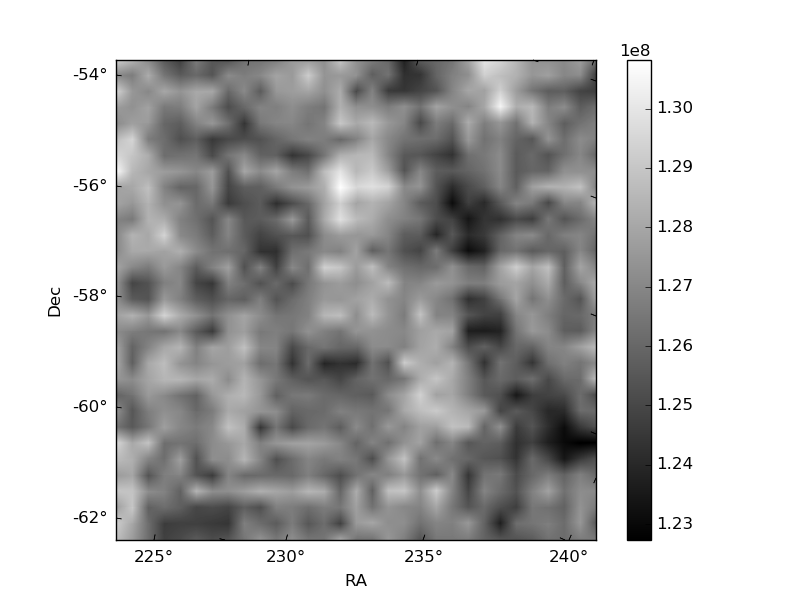
Quadrant B |
|---|---|---|---|
| Quadrant D | 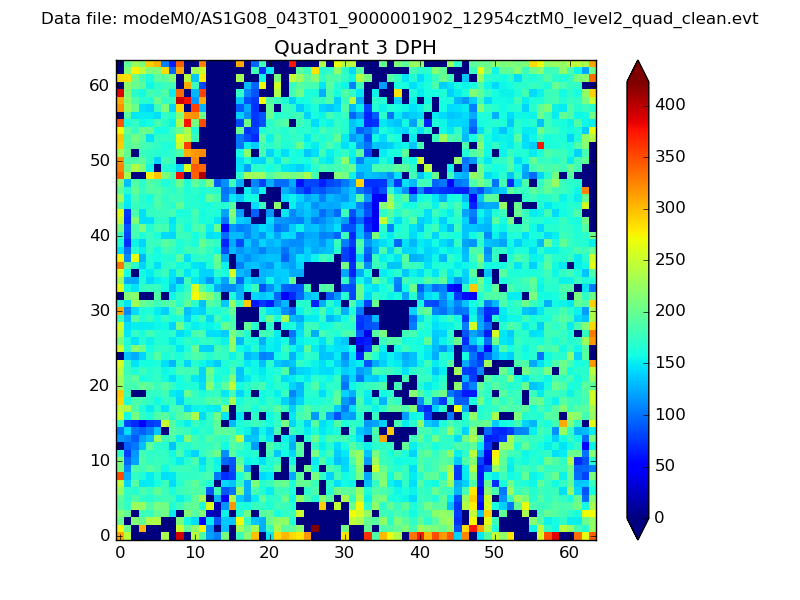 |
 |
Quadrant C |
| Plot type | Count rate plots | Images |
|---|---|---|
| Comparison with Poisson distribution Blue bars denote a histogram of data divided into 1 sec bins. Red curve is a Poisson curve with rate = median count rate of data. |
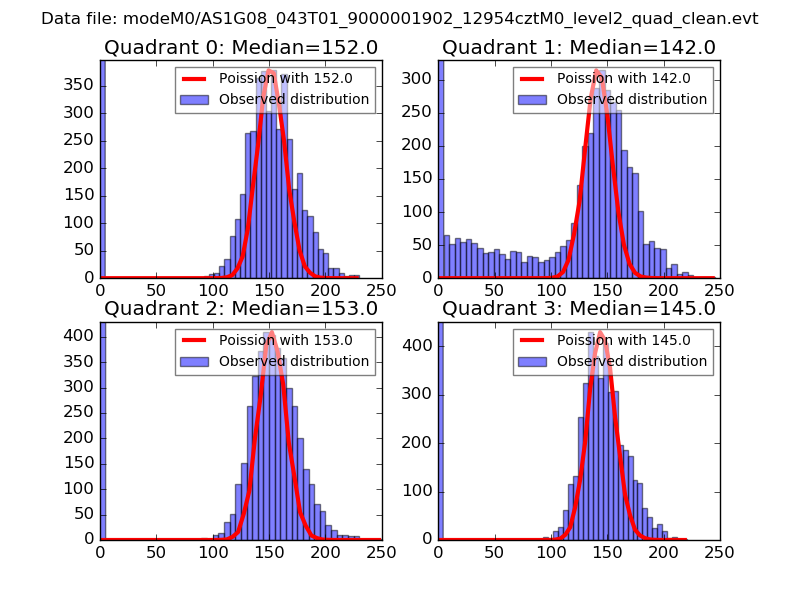 |
 |
| Quadrant-wise count rates Data is divided into 100 sec bins |
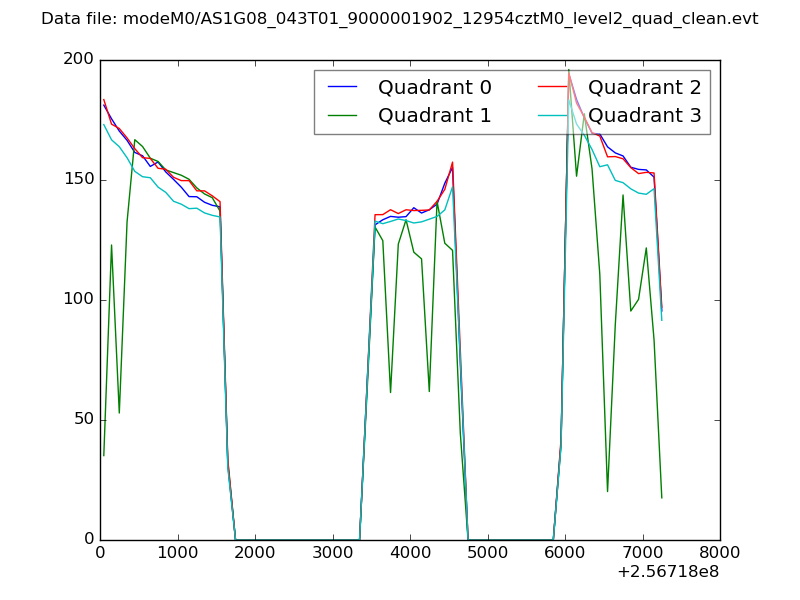 |
|
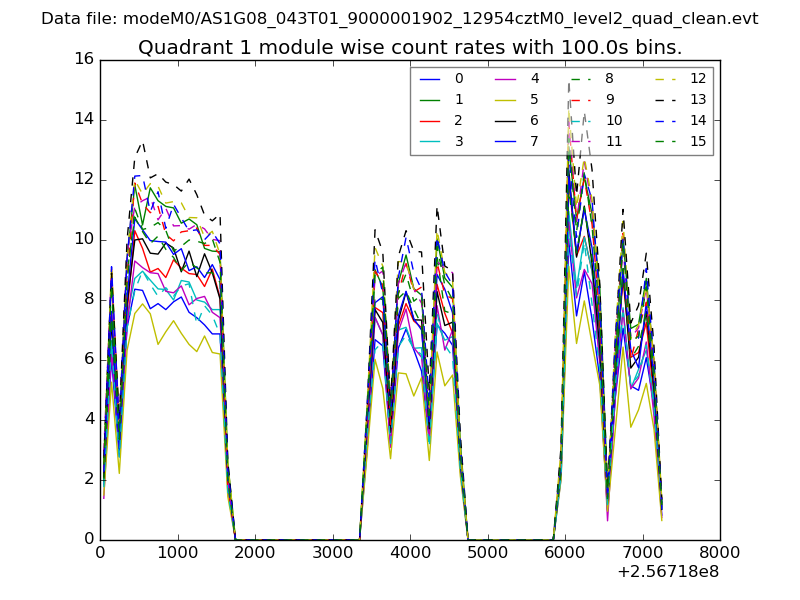
| Module-wise count rates for Quadrant A Data is divided into 100 sec bins |
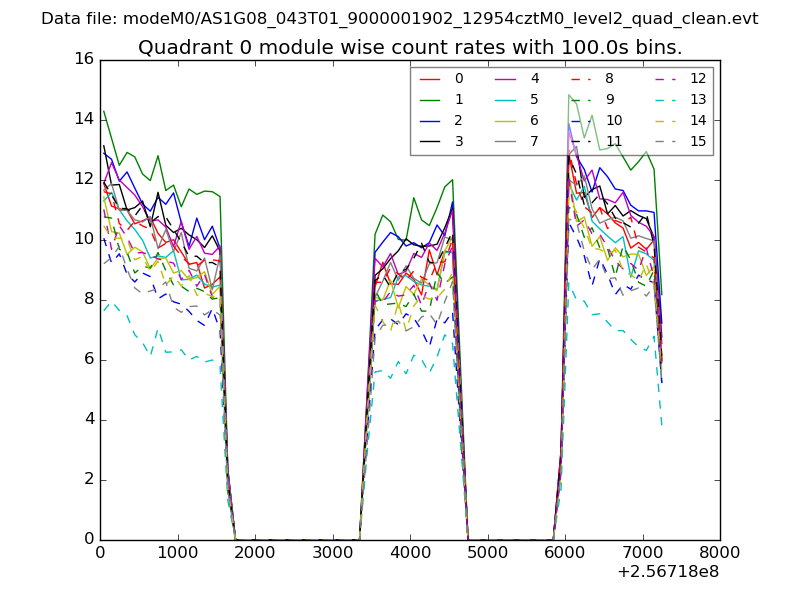 |
 |
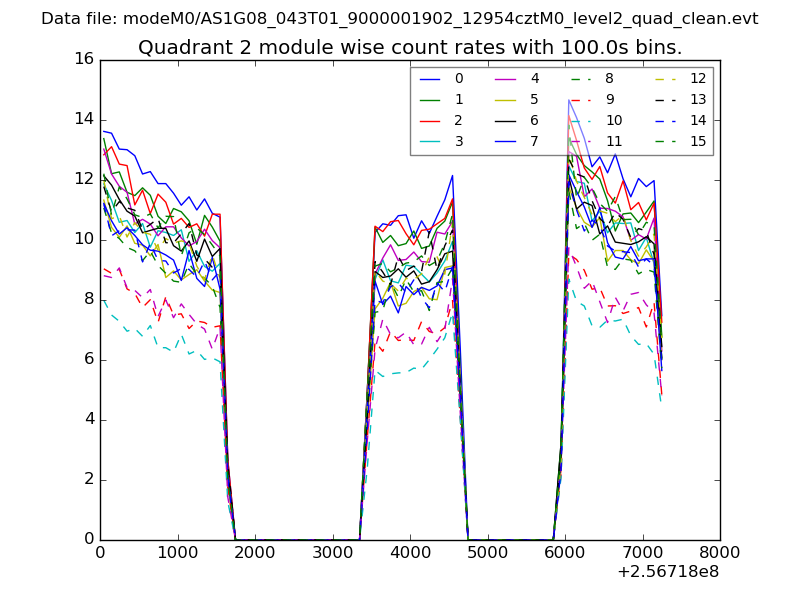
| Module-wise count rates for Quadrant B Data is divided into 100 sec bins |
 |
 |
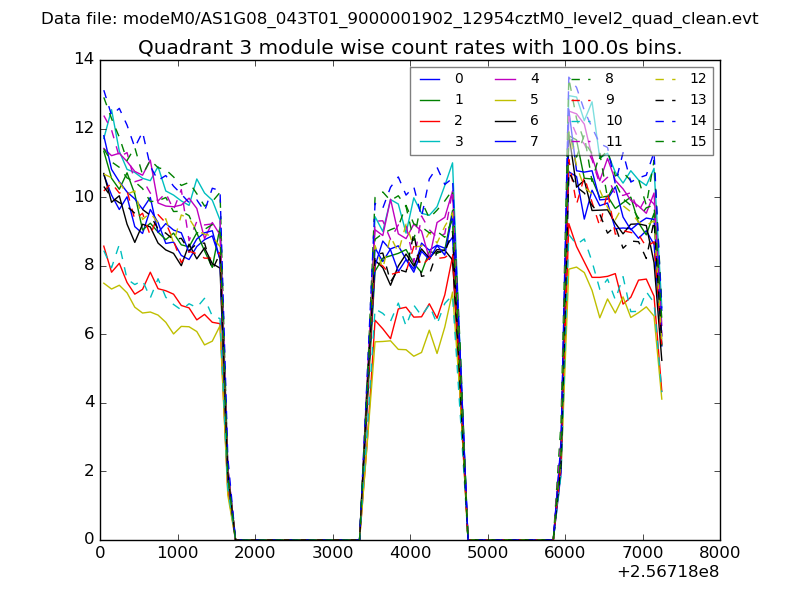
| Module-wise count rates for Quadrant C Data is divided into 100 sec bins |
 |
 |
| Module-wise count rates for Quadrant D Data is divided into 100 sec bins |
 |
 |
| Parameter | Plot |
|---|---|
| CZT HV Monitor | 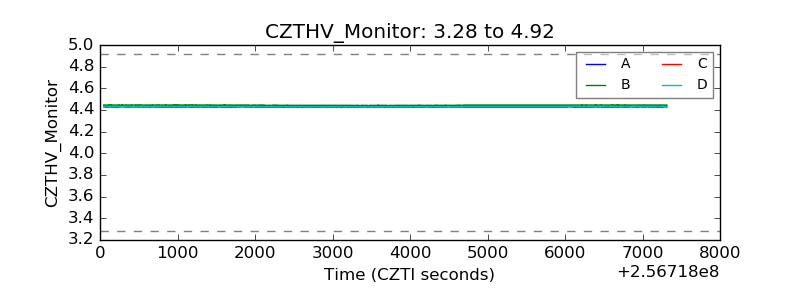 |
| D_VDD | 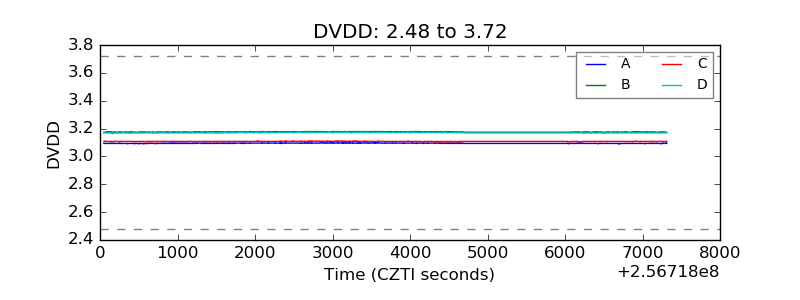 |
| Temperature 1 | 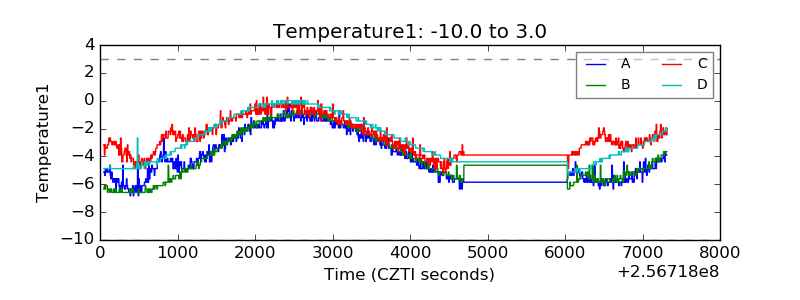 |
| Veto HV Monitor | 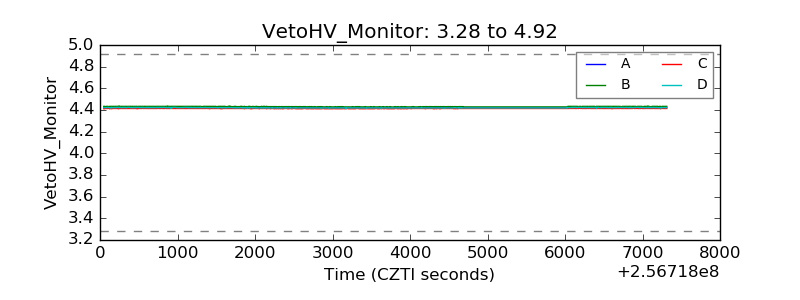 |
| Veto LLD |  |
| Alpha Counter | 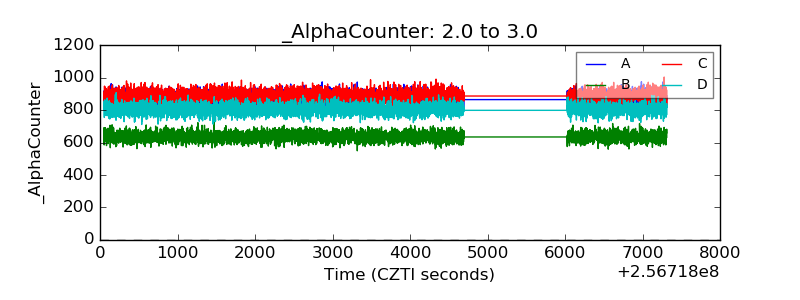 |
| _CPM_Rate | 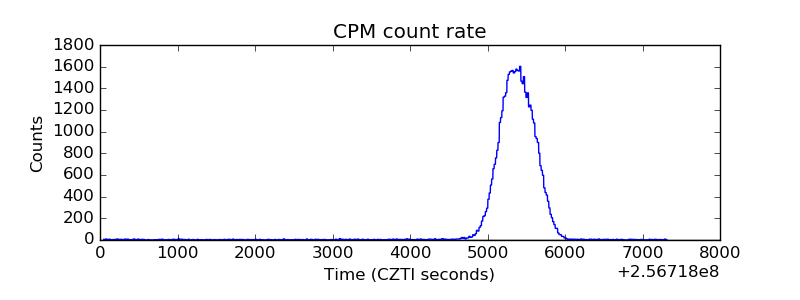 |
| CZT Counter | 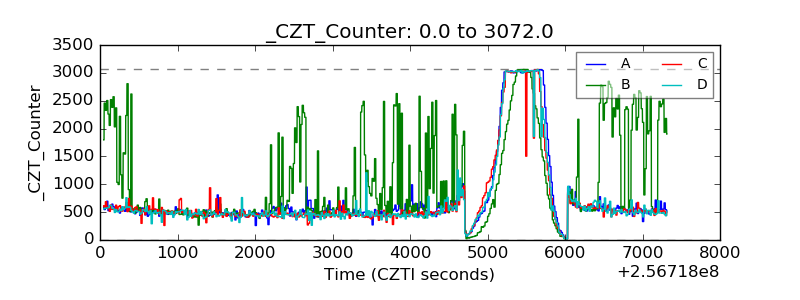 |
| +2.5 Volts monitor |  |
| +5 Volts monitor |  |
| _ROLL_ROT | 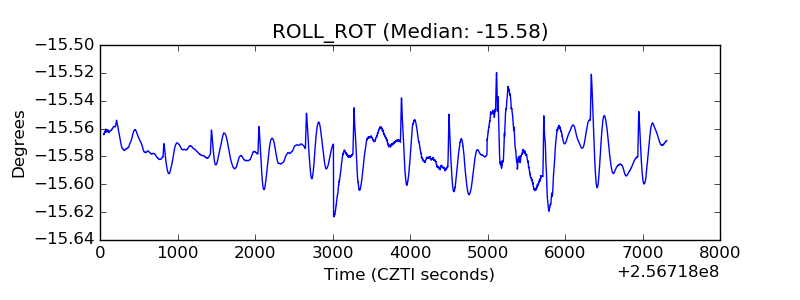 |
| _Roll_DEC | 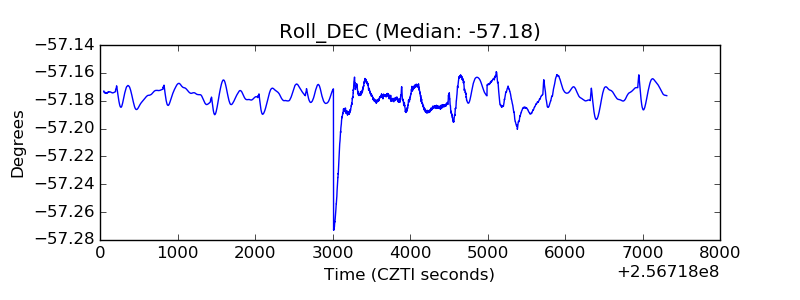 |
| _Roll_RA | 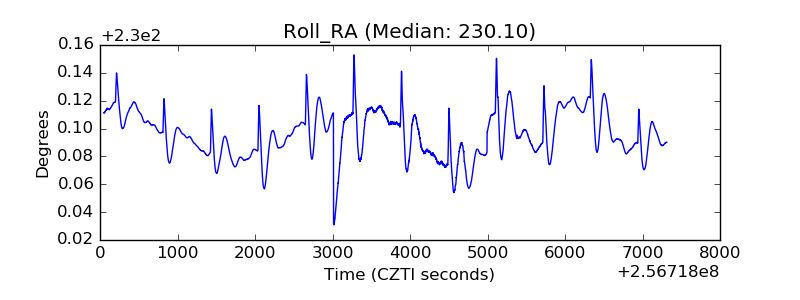 |
| Veto Counter | 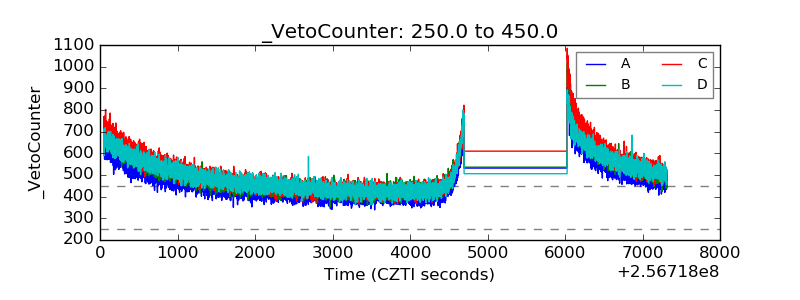 |