| Param | Original file | Final file |
|---|---|---|
| Filename | modeM0/AS1G08_043T01_9000001902_12955cztM0_level2.evt | modeM0/AS1G08_043T01_9000001902_12955cztM0_level2_quad_clean.evt |
| Size (bytes) | 501,094,080 | 86,659,200 |
| Size | 477.9 MB | 82.6 MB |
| Events in quadrant A | 3,146,780 | 589,435 |
| Events in quadrant B | 5,440,873 | 475,186 |
| Events in quadrant C | 2,954,107 | 588,044 |
| Events in quadrant D | 3,233,130 | 558,914 |
| Mode M0 | |||
|---|---|---|---|
| Quadrant | BADHDUFLAG | Total packets | Discarded packets |
| A | 0 | 12804 | 2 |
| B | 0 | 19787 | 1 |
| C | 0 | 12301 | 1 |
| D | 0 | 13242 | 1 |
| Mode M9 | |||
|---|---|---|---|
| Quadrant | BADHDUFLAG | Total packets | Discarded packets |
| A | 0 | 13 | 0 |
| B | 0 | 13 | 0 |
| C | 0 | 13 | 0 |
| D | 0 | 13 | 0 |
| Mode SS | |||
|---|---|---|---|
| Quadrant | BADHDUFLAG | Total packets | Discarded packets |
| A | 0 | 120 | 0 |
| B | 0 | 120 | 0 |
| C | 0 | 120 | 0 |
| D | 0 | 120 | 0 |
| Quadrant | Total seconds | Saturated seconds | Saturation percentage |
|---|---|---|---|
| A | 5900 | 91 | 1.542373% |
| B | 5900 | 1218 | 20.644068% |
| C | 5900 | 67 | 1.135593% |
| D | 5900 | 94 | 1.593220% |
Noise dominated data is calculated using 1-second bins in cleaned event files. If a bin has >2000 counts, and if more than 50% of those come from <1% of pixels, then it is considered to be noise-dominated and hence unusable.
| Quadrant | # 1 sec bins | Bins with >0 counts | Bins with >2000 counts | High rate bins dominated by noise | Noise dominated (total time) | Noise dominated (detector-on time) | Marked lightcurve |
|---|---|---|---|---|---|---|---|
| A | 7182 | 5904 | 0 | 0 | 0.00% | 0.00% | 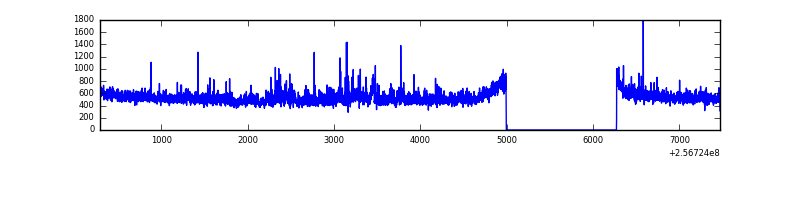 |
| B | 7182 | 5902 | 787 | 787 | 10.96% | 13.33% | 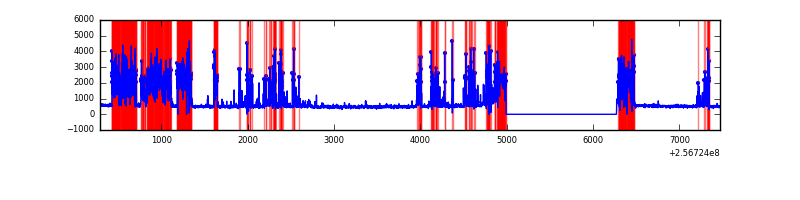 |
| C | 7182 | 5904 | 0 | 0 | 0.00% | 0.00% | 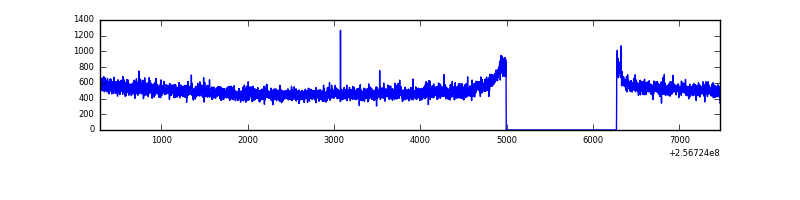 |
| D | 7182 | 5904 | 25 | 25 | 0.35% | 0.42% | 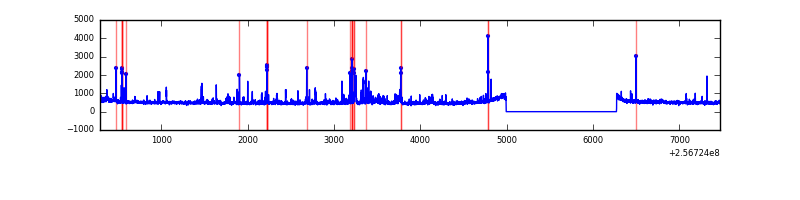 |
Top three noisy pixels from each quadrant. If the there are fewer than three noisy pixels in the level2.evt file, extra rows are filled as -1
| Pixel properties | Quadrant properties | ||||||
|---|---|---|---|---|---|---|---|
| Quadrant | DetID | PixID | Counts | Sigma | Mean | Median | Sigma |
| A | 1 | 162 | 75841 | 493.07 | 764 | 748 | 152.3 |
| A | 12 | 189 | 50690 | 327.92 | 764 | 748 | 152.3 |
| A | 1 | 178 | 31245 | 200.25 | 764 | 748 | 152.3 |
| B | 4 | 239 | 2507080 | 20836.26 | 649 | 635 | 120.3 |
| B | 3 | 64 | 316949 | 2629.54 | 649 | 635 | 120.3 |
| B | 0 | 219 | 26134 | 211.98 | 649 | 635 | 120.3 |
| C | 3 | 248 | 36363 | 207.68 | 748 | 753 | 171.5 |
| C | 13 | 61 | 5379 | 26.98 | 748 | 753 | 171.5 |
| C | 3 | 202 | 1876 | 6.55 | 748 | 753 | 171.5 |
| D | 1 | 52 | 204522 | 1136.19 | 748 | 728 | 179.4 |
| D | 8 | 195 | 132515 | 734.74 | 748 | 728 | 179.4 |
| D | 10 | 253 | 29521 | 160.53 | 748 | 728 | 179.4 |
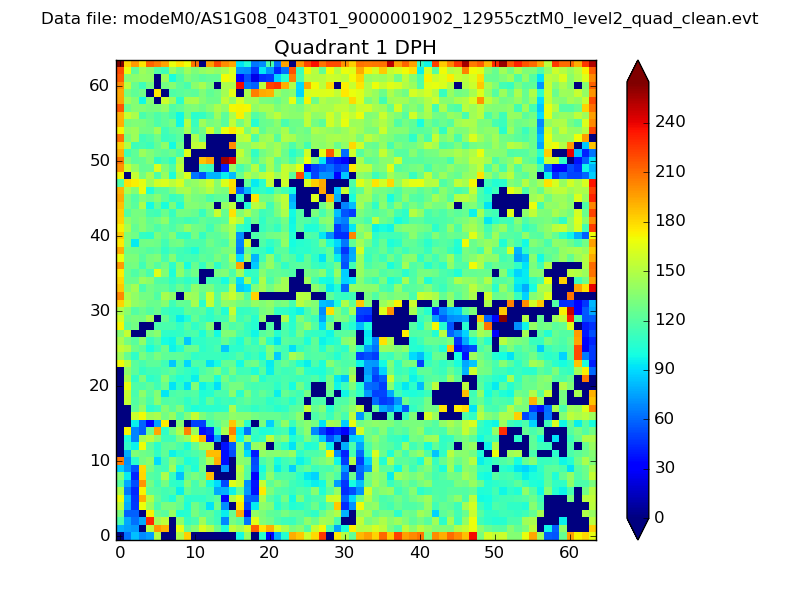
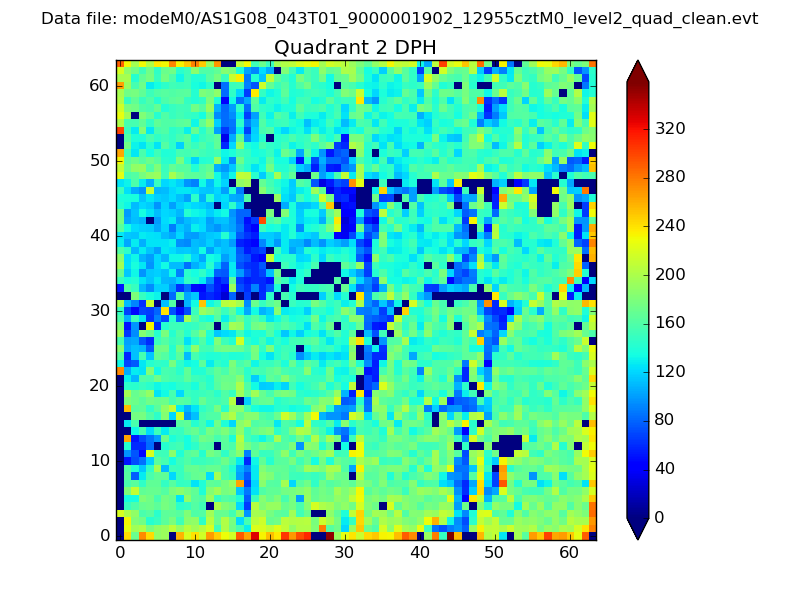
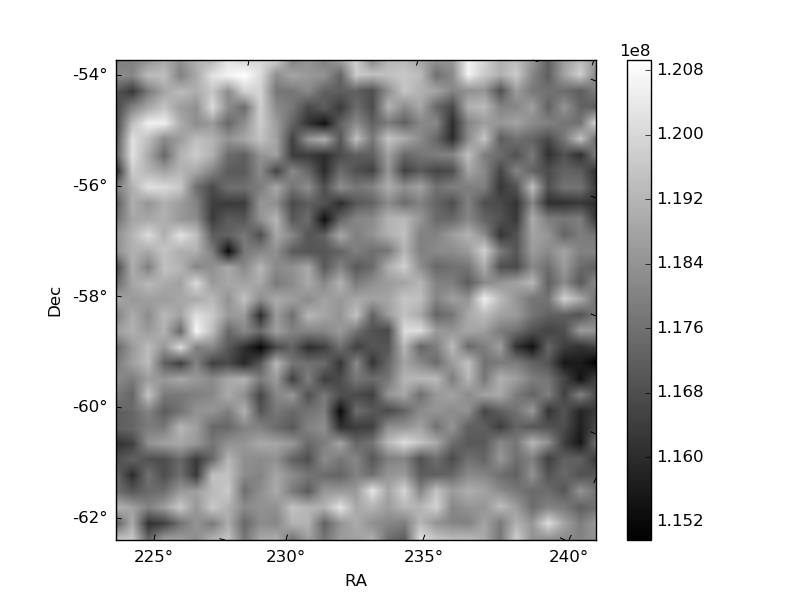
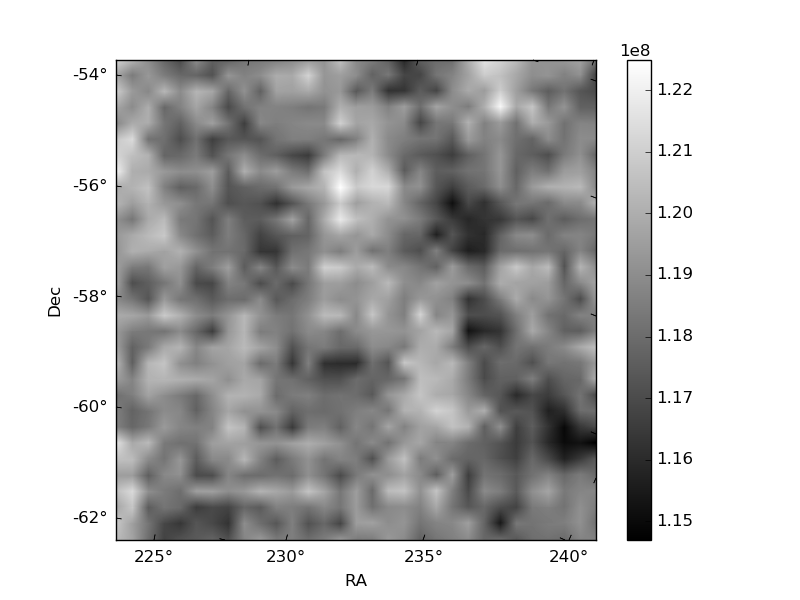
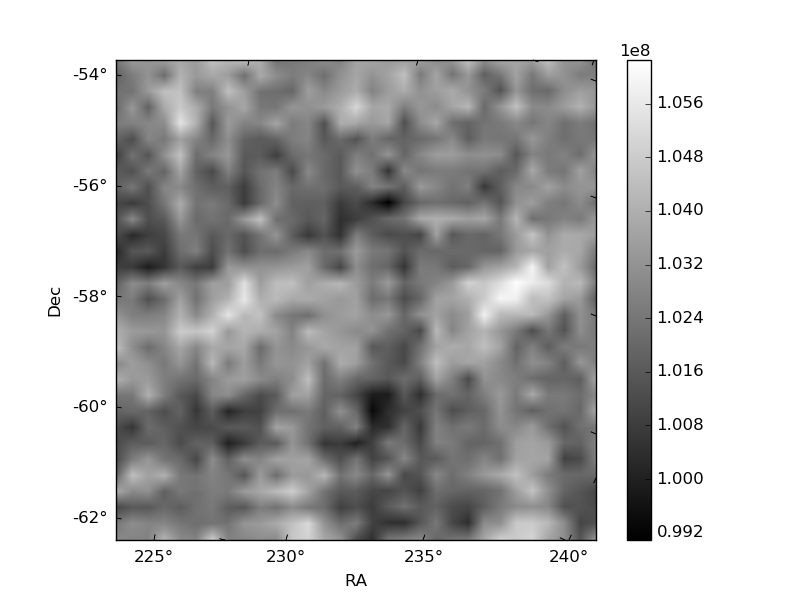
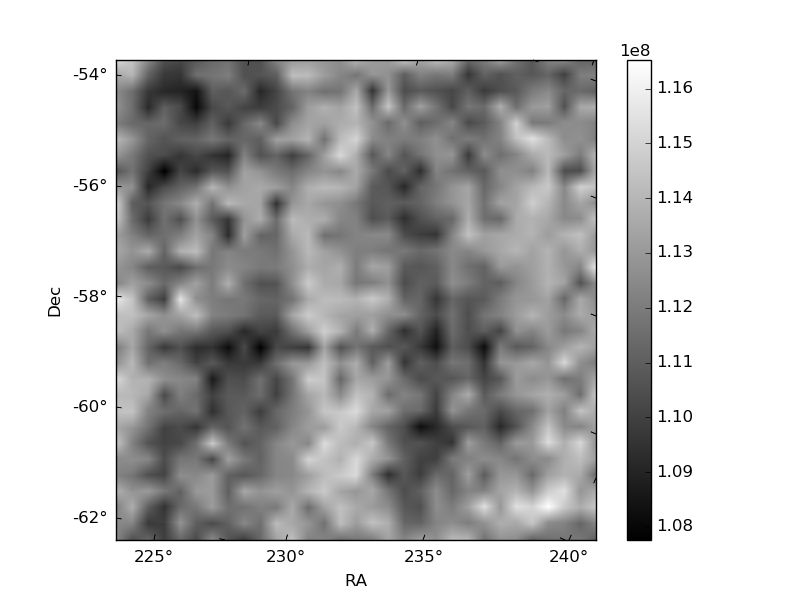
Histogram calculated using DETX and DETY for each event in the final _common_clean file
| Quadrant A |  |
 |
Quadrant B |
|---|---|---|---|
| Quadrant D |  |
 |
Quadrant C |
| Plot type | Count rate plots | Images |
|---|---|---|
| Comparison with Poisson distribution Blue bars denote a histogram of data divided into 1 sec bins. Red curve is a Poisson curve with rate = median count rate of data. |
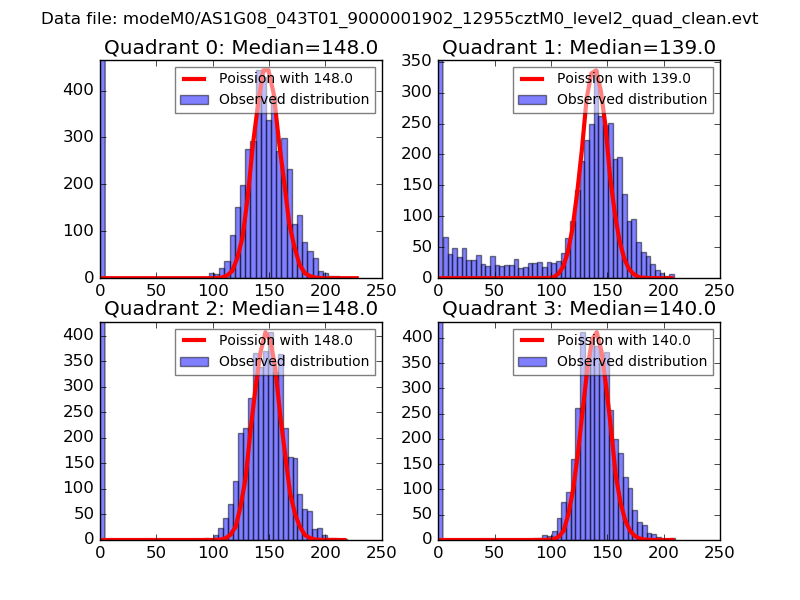 |
 |
| Quadrant-wise count rates Data is divided into 100 sec bins |
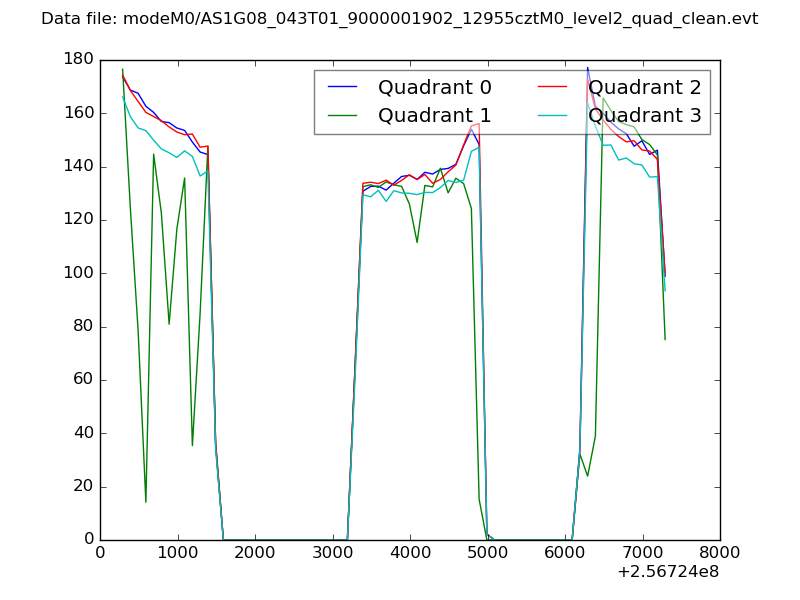 |
|
| Module-wise count rates for Quadrant A Data is divided into 100 sec bins |
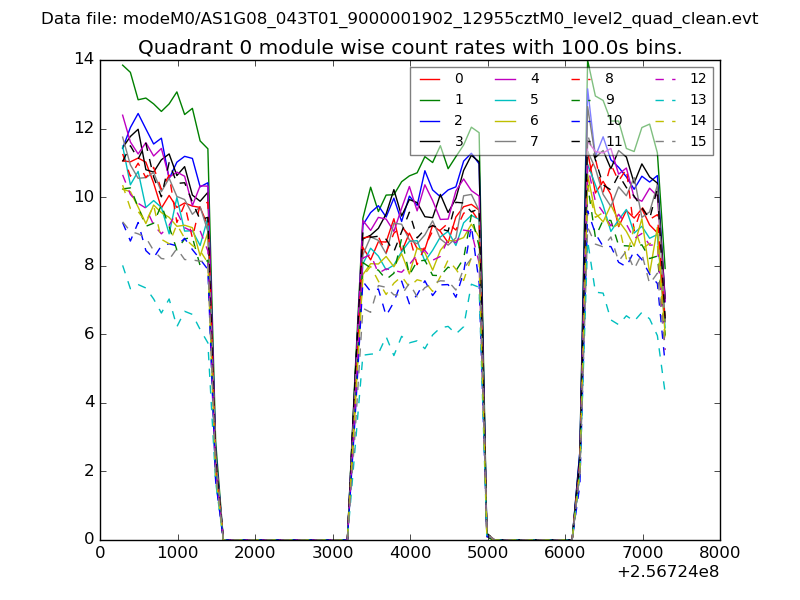 |
 |
| Module-wise count rates for Quadrant B Data is divided into 100 sec bins |
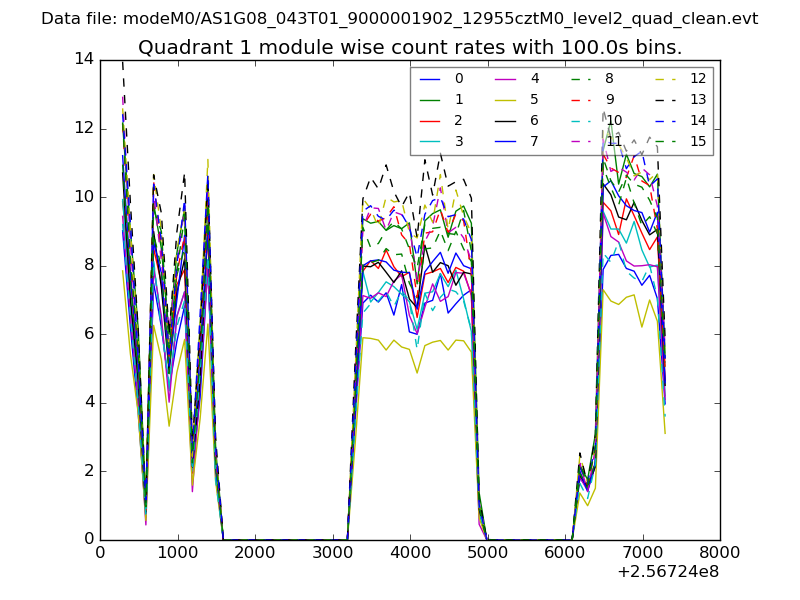 |
 |
| Module-wise count rates for Quadrant C Data is divided into 100 sec bins |
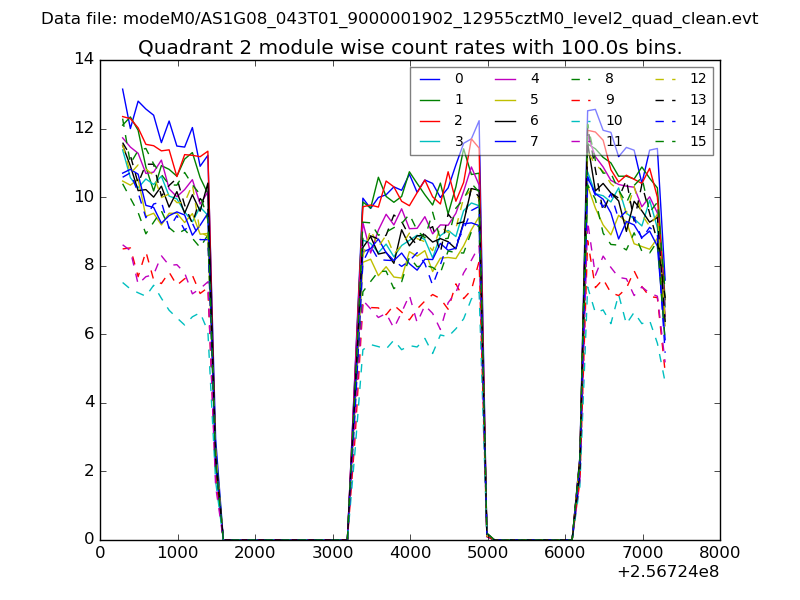 |
 |
| Module-wise count rates for Quadrant D Data is divided into 100 sec bins |
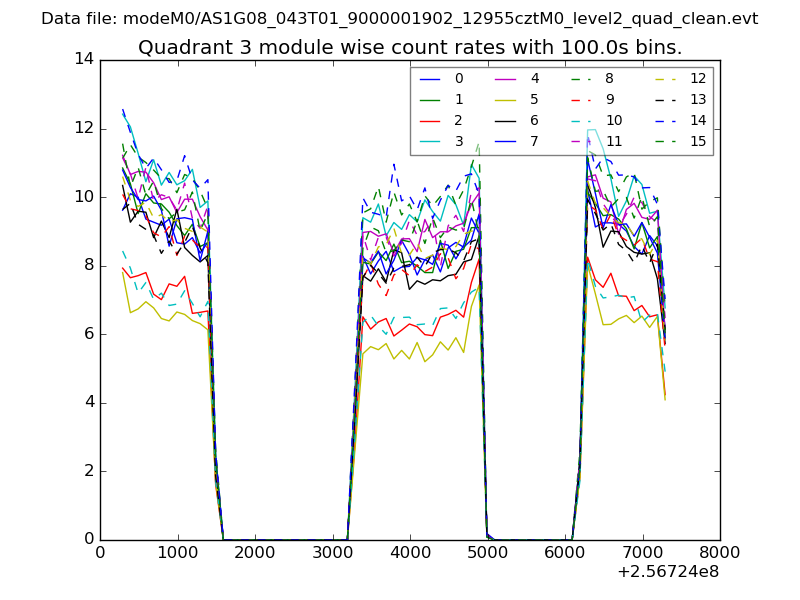 |
 |
| Parameter | Plot |
|---|---|
| CZT HV Monitor | 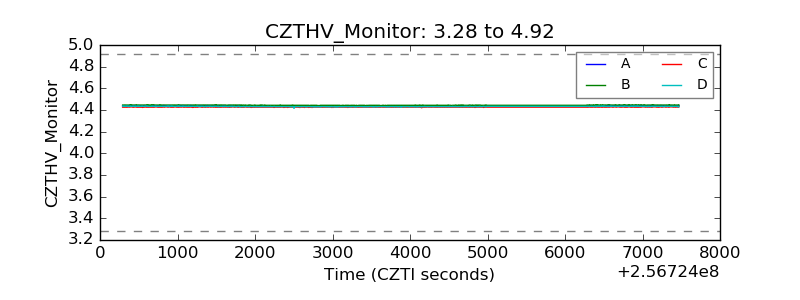 |
| D_VDD | 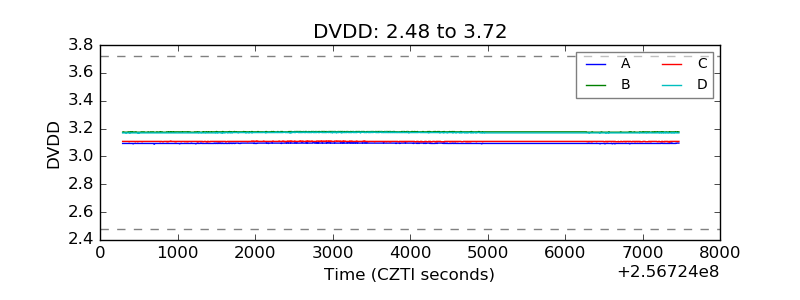 |
| Temperature 1 | 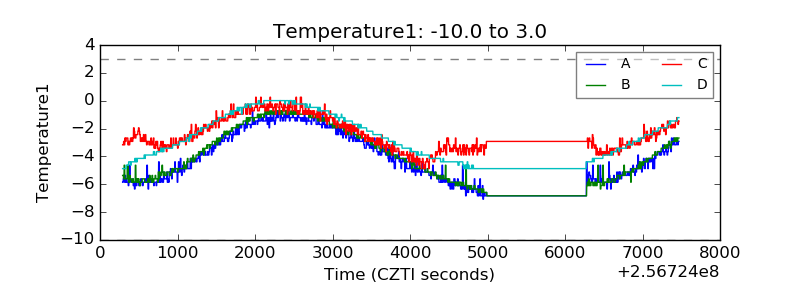 |
| Veto HV Monitor | 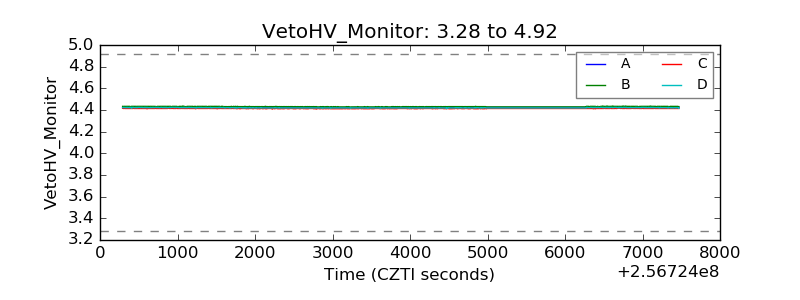 |
| Veto LLD | 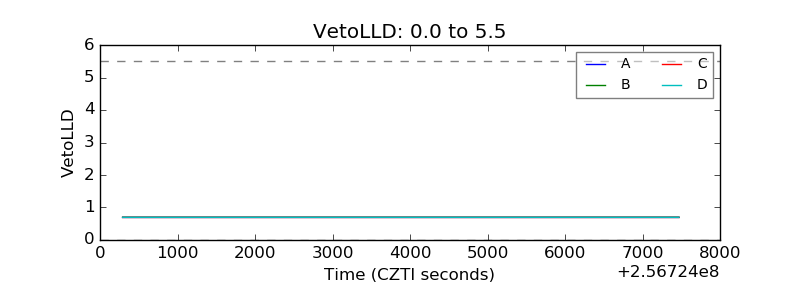 |
| Alpha Counter | 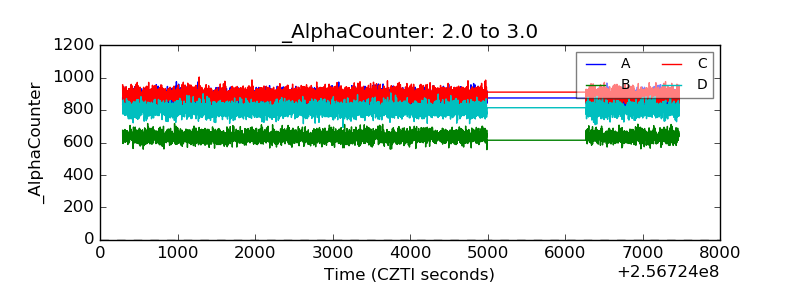 |
| _CPM_Rate | 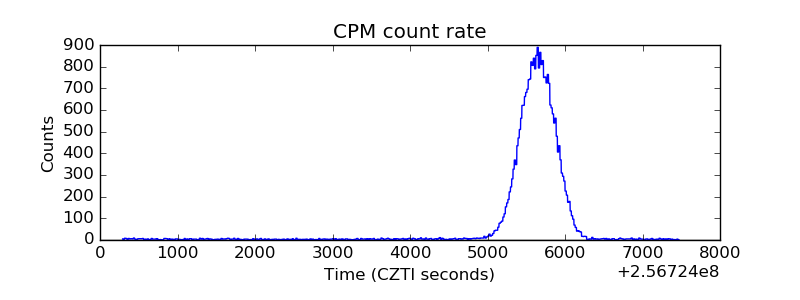 |
| CZT Counter |  |
| +2.5 Volts monitor |  |
| +5 Volts monitor | 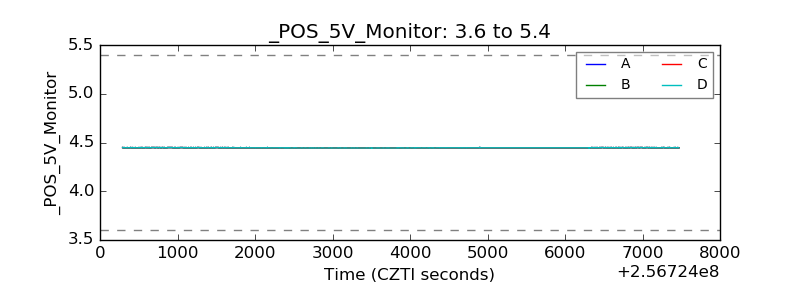 |
| _ROLL_ROT | 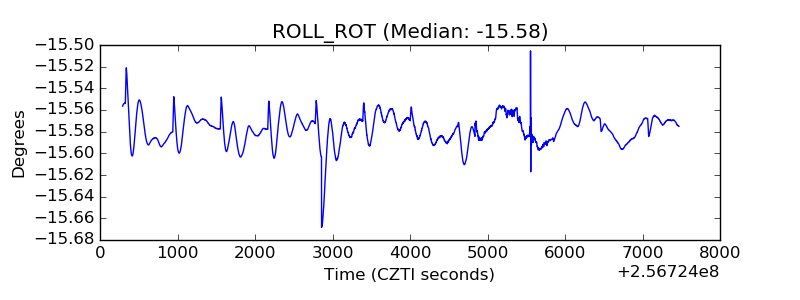 |
| _Roll_DEC | 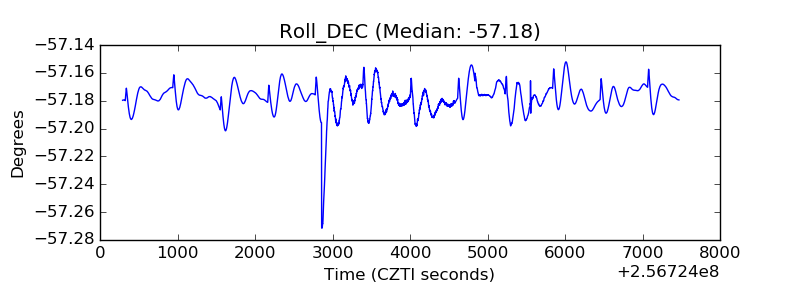 |
| _Roll_RA |  |
| Veto Counter | 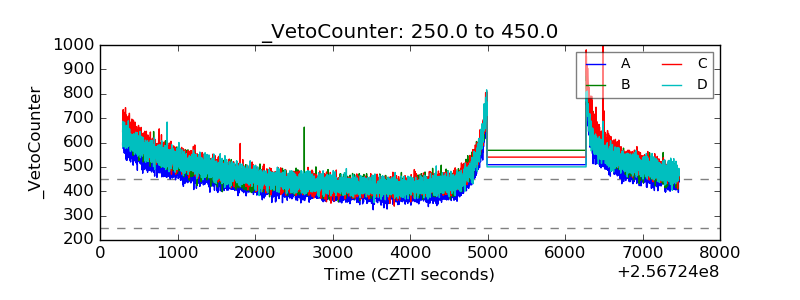 |