| Param | Original file | Final file |
|---|---|---|
| Filename | modeM0/AS1G08_043T01_9000001902_12957cztM0_level2.evt | modeM0/AS1G08_043T01_9000001902_12957cztM0_level2_quad_clean.evt |
| Size (bytes) | 529,577,280 | 84,542,400 |
| Size | 505.0 MB | 80.6 MB |
| Events in quadrant A | 3,651,322 | 525,656 |
| Events in quadrant B | 4,839,538 | 500,450 |
| Events in quadrant C | 3,353,934 | 528,109 |
| Events in quadrant D | 3,705,461 | 505,295 |
| Mode M0 | |||
|---|---|---|---|
| Quadrant | BADHDUFLAG | Total packets | Discarded packets |
| A | 0 | 15247 | 3 |
| B | 0 | 18909 | 2 |
| C | 0 | 14809 | 2 |
| D | 0 | 15677 | 2 |
| Mode M9 | |||
|---|---|---|---|
| Quadrant | BADHDUFLAG | Total packets | Discarded packets |
| A | 0 | 8 | 0 |
| B | 0 | 8 | 0 |
| C | 0 | 8 | 0 |
| D | 0 | 9 | 0 |
| Mode SS | |||
|---|---|---|---|
| Quadrant | BADHDUFLAG | Total packets | Discarded packets |
| A | 0 | 144 | 0 |
| B | 0 | 144 | 0 |
| C | 0 | 144 | 0 |
| D | 0 | 144 | 0 |
| Quadrant | Total seconds | Saturated seconds | Saturation percentage |
|---|---|---|---|
| A | 7191 | 150 | 2.085941% |
| B | 7191 | 668 | 9.289390% |
| C | 7191 | 107 | 1.487971% |
| D | 7191 | 105 | 1.460159% |
Noise dominated data is calculated using 1-second bins in cleaned event files. If a bin has >2000 counts, and if more than 50% of those come from <1% of pixels, then it is considered to be noise-dominated and hence unusable.
| Quadrant | # 1 sec bins | Bins with >0 counts | Bins with >2000 counts | High rate bins dominated by noise | Noise dominated (total time) | Noise dominated (detector-on time) | Marked lightcurve |
|---|---|---|---|---|---|---|---|
| A | 7917 | 7193 | 0 | 0 | 0.00% | 0.00% | 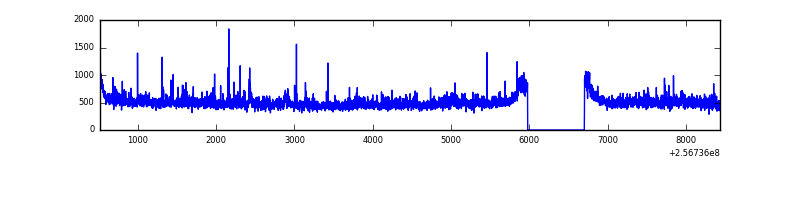 |
| B | 7917 | 7193 | 282 | 282 | 3.56% | 3.92% | 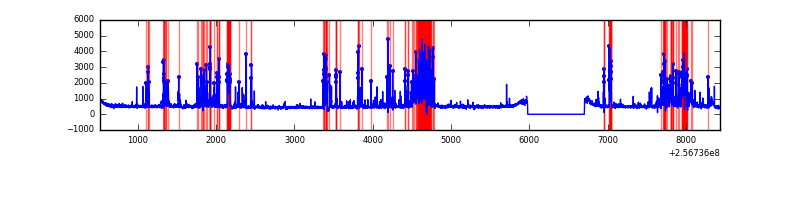 |
| C | 7917 | 7193 | 0 | 0 | 0.00% | 0.00% | 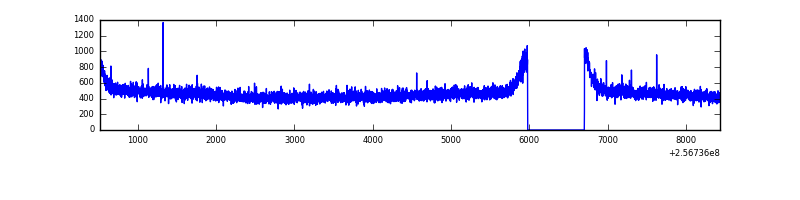 |
| D | 7917 | 7193 | 3 | 3 | 0.04% | 0.04% | 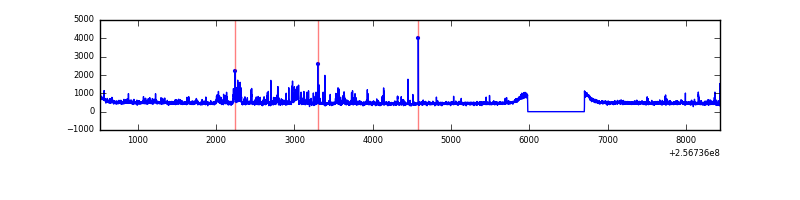 |
Top three noisy pixels from each quadrant. If the there are fewer than three noisy pixels in the level2.evt file, extra rows are filled as -1
| Pixel properties | Quadrant properties | ||||||
|---|---|---|---|---|---|---|---|
| Quadrant | DetID | PixID | Counts | Sigma | Mean | Median | Sigma |
| A | 12 | 189 | 131153 | 727.2 | 879 | 856 | 179.2 |
| A | 1 | 162 | 65455 | 360.53 | 879 | 856 | 179.2 |
| A | 1 | 178 | 27662 | 149.61 | 879 | 856 | 179.2 |
| B | 4 | 239 | 734173 | 4603.37 | 843 | 821 | 159.3 |
| B | 3 | 64 | 467410 | 2928.85 | 843 | 821 | 159.3 |
| B | 0 | 85 | 268109 | 1677.81 | 843 | 821 | 159.3 |
| C | 13 | 61 | 6156 | 26.83 | 858 | 860 | 197.4 |
| C | 8 | 222 | 4616 | 19.03 | 858 | 860 | 197.4 |
| C | 14 | 234 | 2170 | 6.64 | 858 | 860 | 197.4 |
| D | 8 | 195 | 342663 | 1638.28 | 860 | 835 | 208.7 |
| D | 1 | 52 | 88648 | 420.86 | 860 | 835 | 208.7 |
| D | 2 | 234 | 34099 | 159.42 | 860 | 835 | 208.7 |
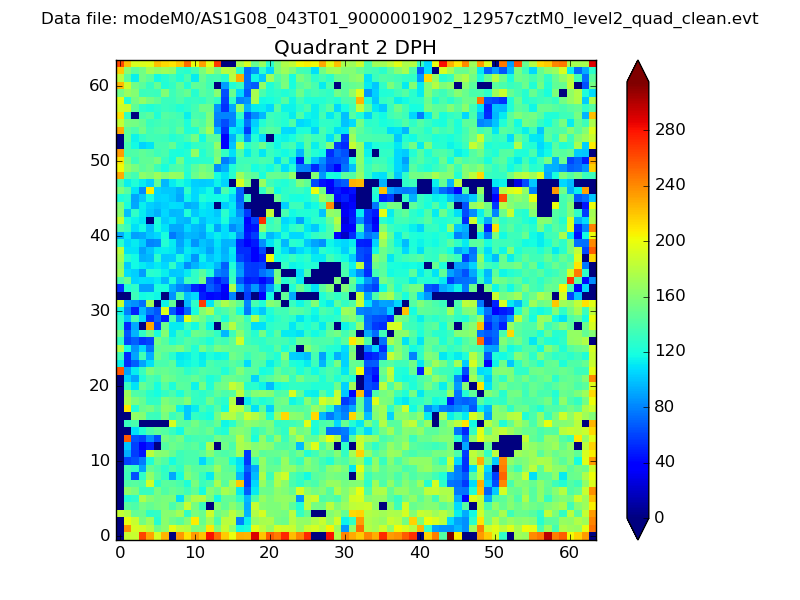
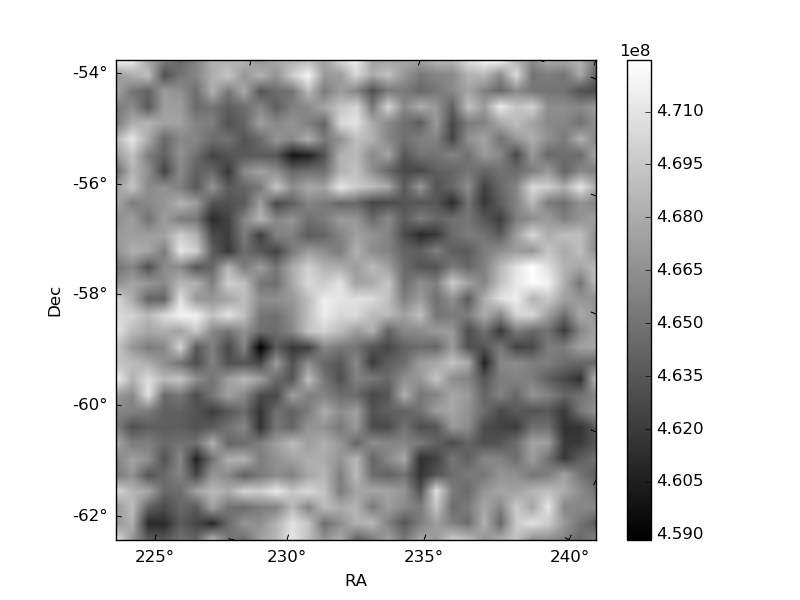
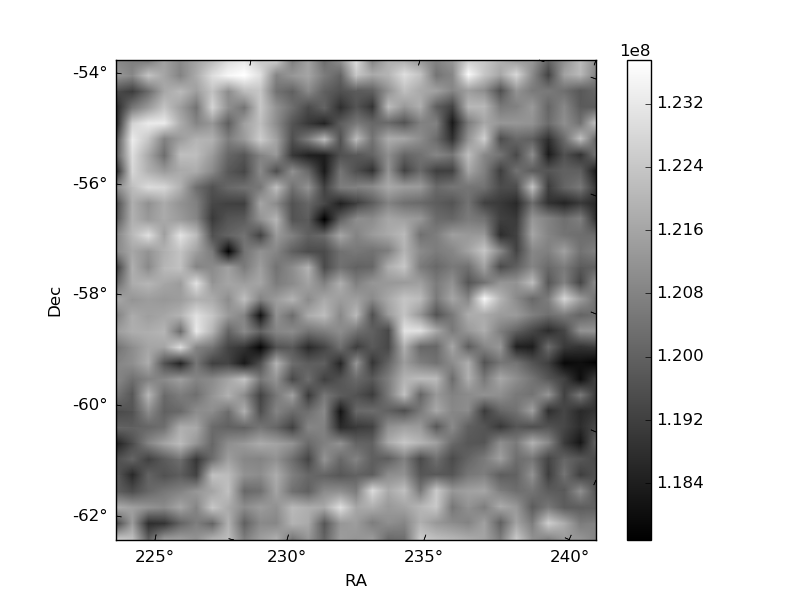
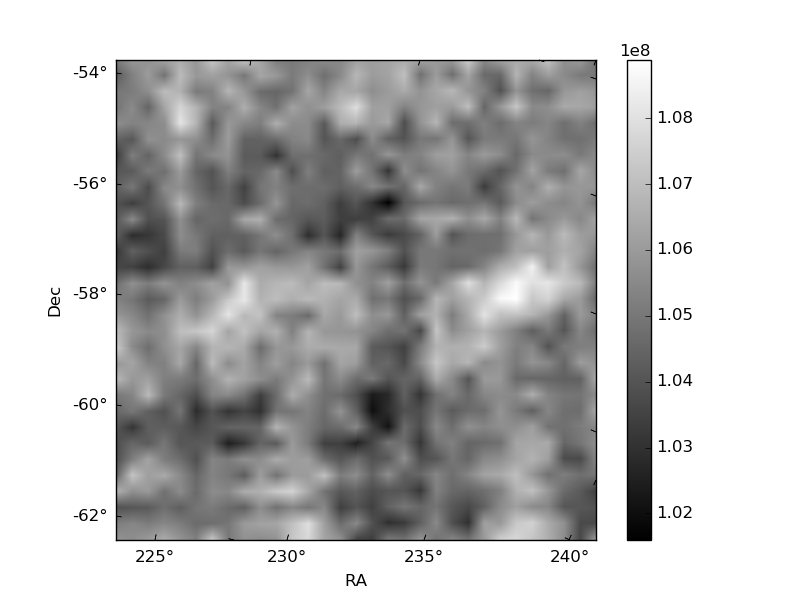
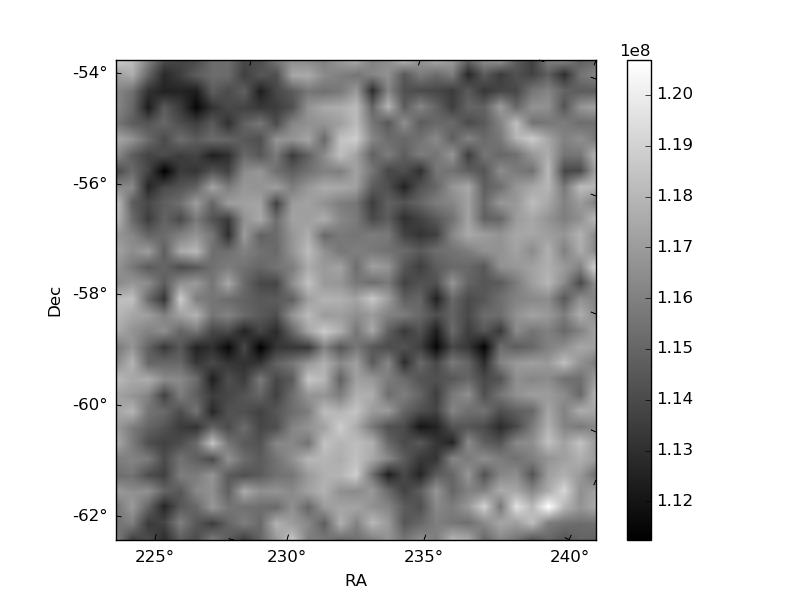
Histogram calculated using DETX and DETY for each event in the final _common_clean file
| Quadrant A | 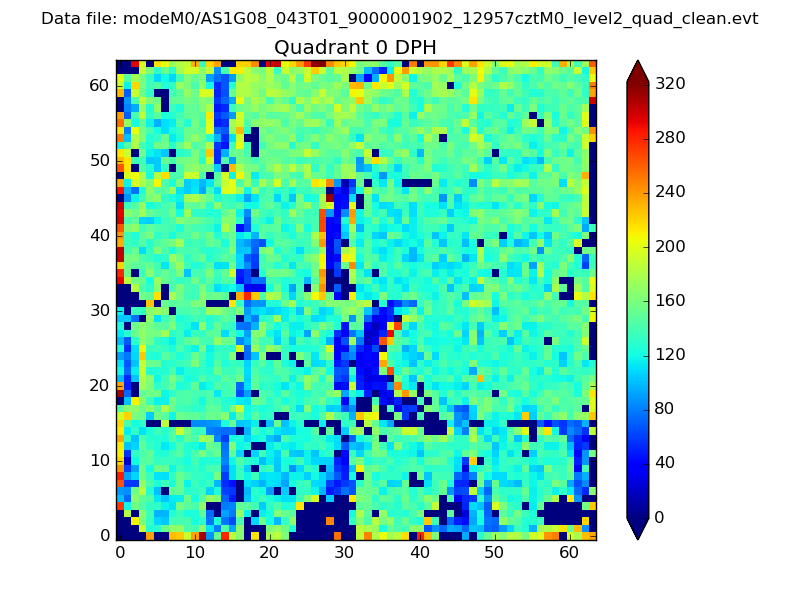 |
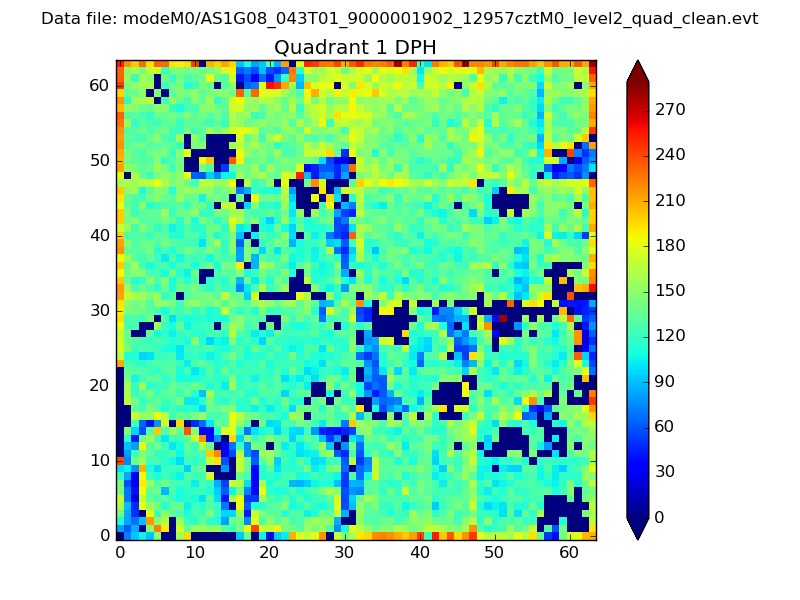 |
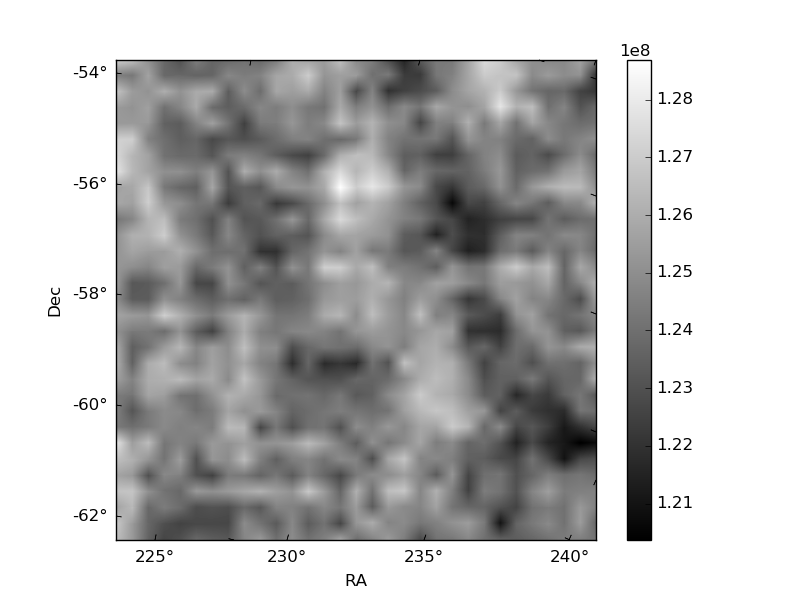
Quadrant B |
|---|---|---|---|
| Quadrant D | 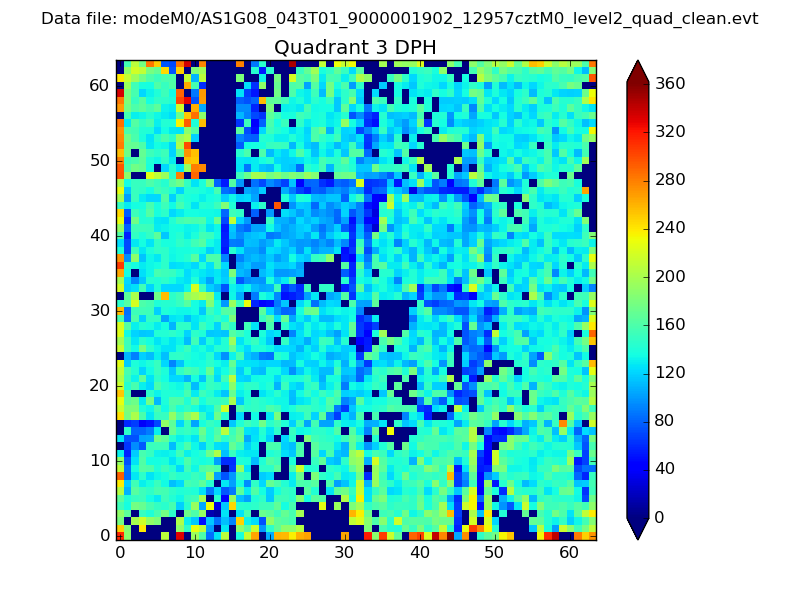 |
 |
Quadrant C |
| Plot type | Count rate plots | Images |
|---|---|---|
| Comparison with Poisson distribution Blue bars denote a histogram of data divided into 1 sec bins. Red curve is a Poisson curve with rate = median count rate of data. |
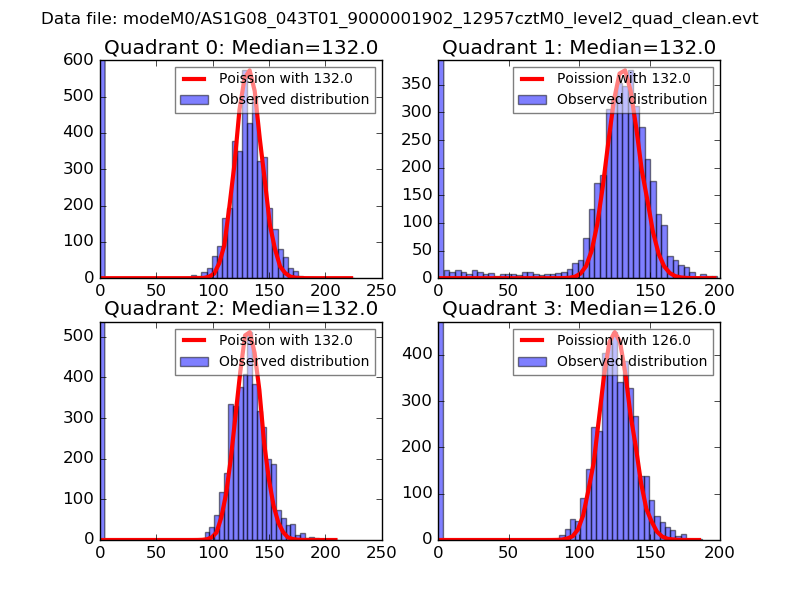 |
 |
| Quadrant-wise count rates Data is divided into 100 sec bins |
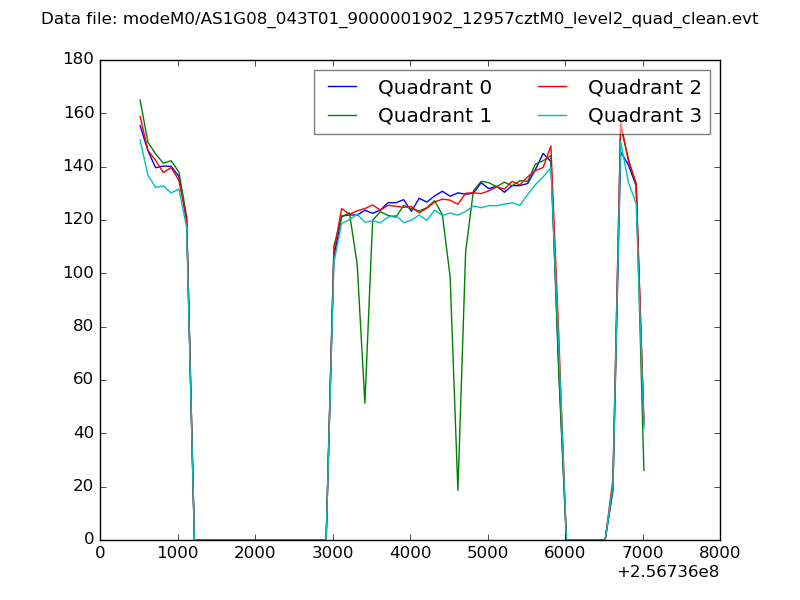 |
|
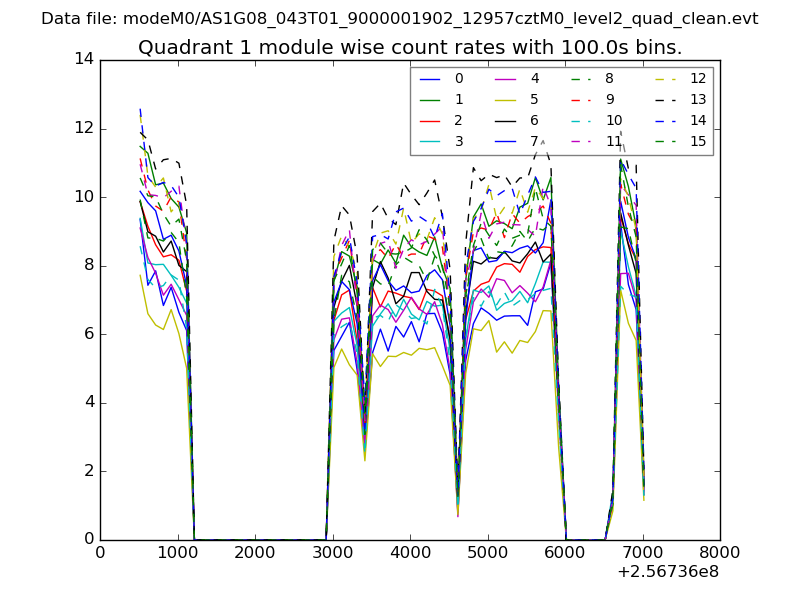
| Module-wise count rates for Quadrant A Data is divided into 100 sec bins |
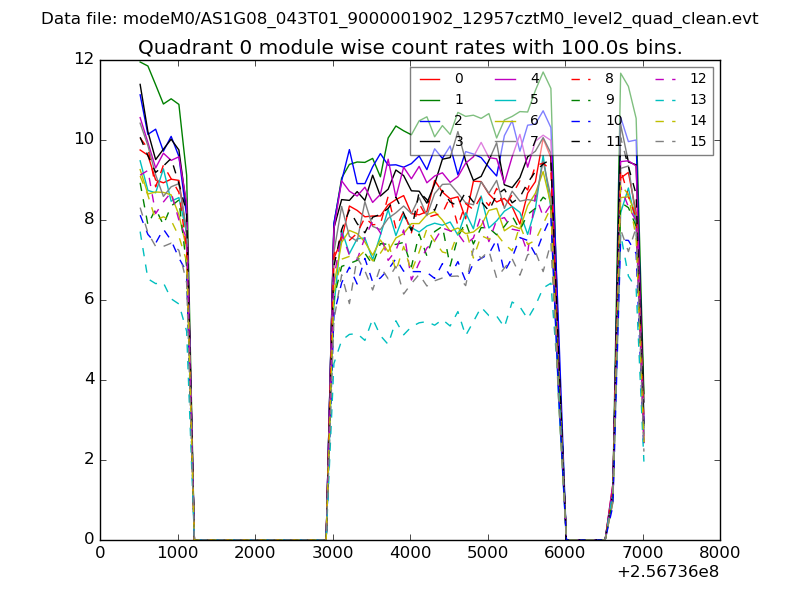 |
 |
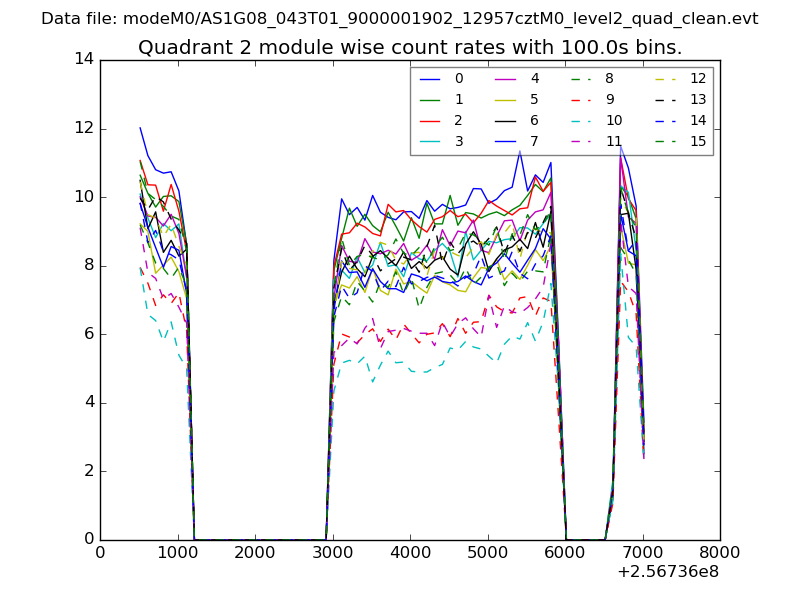
| Module-wise count rates for Quadrant B Data is divided into 100 sec bins |
 |
 |
| Module-wise count rates for Quadrant C Data is divided into 100 sec bins |
 |
 |
| Module-wise count rates for Quadrant D Data is divided into 100 sec bins |
 |
 |
| Parameter | Plot |
|---|---|
| CZT HV Monitor | 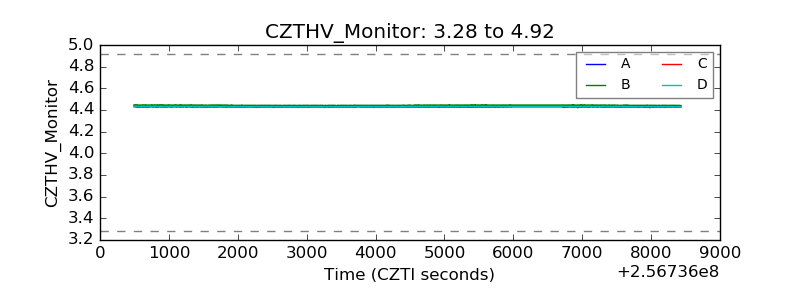 |
| D_VDD | 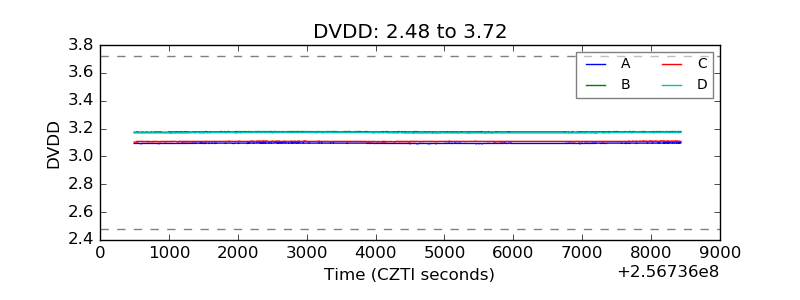 |
| Temperature 1 | 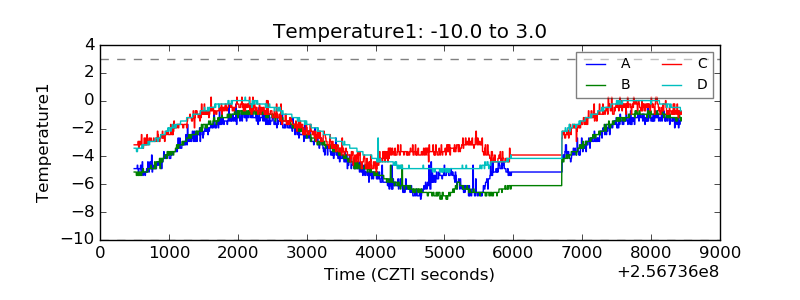 |
| Veto HV Monitor | 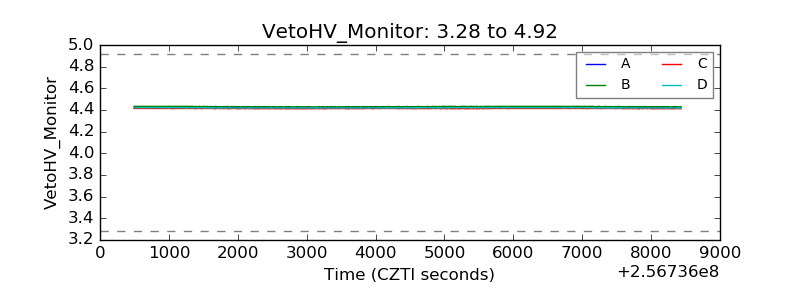 |
| Veto LLD | 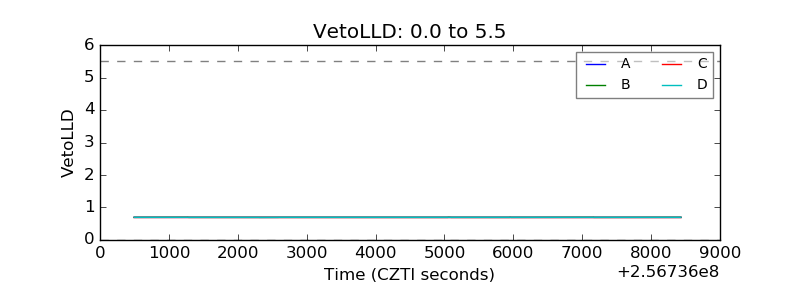 |
| Alpha Counter | 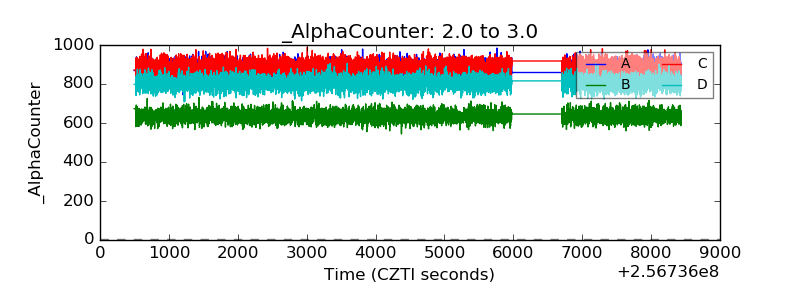 |
| _CPM_Rate | 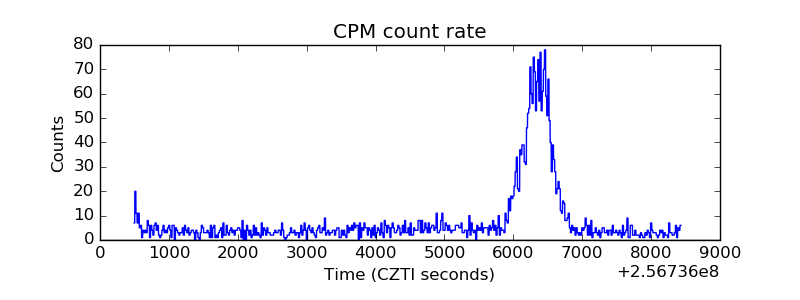 |
| CZT Counter |  |
| +2.5 Volts monitor |  |
| +5 Volts monitor |  |
| _ROLL_ROT |  |
| _Roll_DEC | 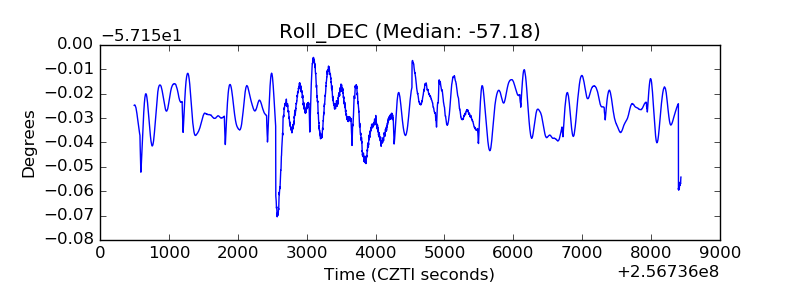 |
| _Roll_RA | 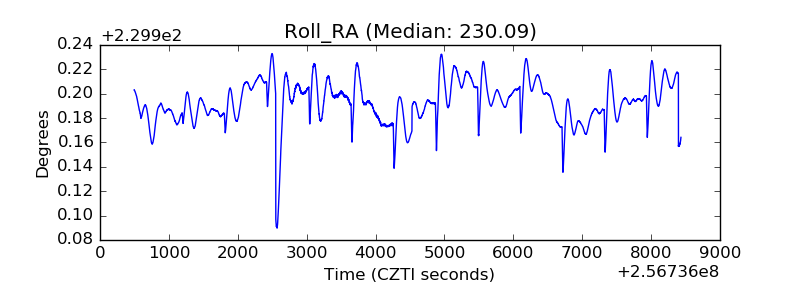 |
| Veto Counter |  |