| Param | Original file | Final file |
|---|---|---|
| Filename | modeM0/AS1G08_043T01_9000001902_12958cztM0_level2.evt | modeM0/AS1G08_043T01_9000001902_12958cztM0_level2_quad_clean.evt |
| Size (bytes) | 319,095,360 | 49,956,480 |
| Size | 304.3 MB | 47.6 MB |
| Events in quadrant A | 2,098,477 | 315,151 |
| Events in quadrant B | 3,323,414 | 272,458 |
| Events in quadrant C | 1,882,047 | 313,942 |
| Events in quadrant D | 2,059,872 | 301,477 |
| Mode M0 | |||
|---|---|---|---|
| Quadrant | BADHDUFLAG | Total packets | Discarded packets |
| A | 0 | 9017 | 0 |
| B | 0 | 12809 | 0 |
| C | 0 | 8797 | 0 |
| D | 0 | 9203 | 0 |
| Mode SS | |||
|---|---|---|---|
| Quadrant | BADHDUFLAG | Total packets | Discarded packets |
| A | 0 | 88 | 0 |
| B | 0 | 88 | 0 |
| C | 0 | 88 | 0 |
| D | 0 | 88 | 0 |
| Quadrant | Total seconds | Saturated seconds | Saturation percentage |
|---|---|---|---|
| A | 4393 | 3 | 0.068290% |
| B | 4393 | 576 | 13.111769% |
| C | 4393 | 3 | 0.068290% |
| D | 4393 | 9 | 0.204871% |
Noise dominated data is calculated using 1-second bins in cleaned event files. If a bin has >2000 counts, and if more than 50% of those come from <1% of pixels, then it is considered to be noise-dominated and hence unusable.
| Quadrant | # 1 sec bins | Bins with >0 counts | Bins with >2000 counts | High rate bins dominated by noise | Noise dominated (total time) | Noise dominated (detector-on time) | Marked lightcurve |
|---|---|---|---|---|---|---|---|
| A | 4393 | 4393 | 0 | 0 | 0.00% | 0.00% | 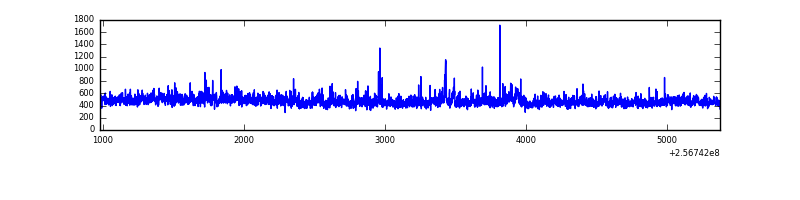 |
| B | 4393 | 4393 | 331 | 331 | 7.53% | 7.53% | 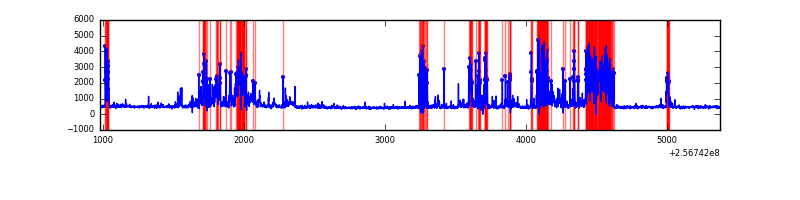 |
| C | 4393 | 4393 | 0 | 0 | 0.00% | 0.00% | 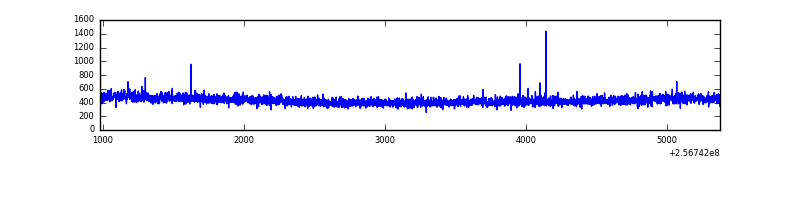 |
| D | 4393 | 4393 | 8 | 8 | 0.18% | 0.18% | 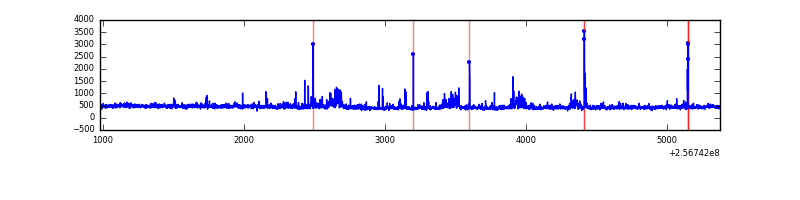 |
Top three noisy pixels from each quadrant. If the there are fewer than three noisy pixels in the level2.evt file, extra rows are filled as -1
| Pixel properties | Quadrant properties | ||||||
|---|---|---|---|---|---|---|---|
| Quadrant | DetID | PixID | Counts | Sigma | Mean | Median | Sigma |
| A | 12 | 189 | 67449 | 657.65 | 495 | 483 | 101.8 |
| A | 1 | 162 | 56725 | 552.33 | 495 | 483 | 101.8 |
| A | 1 | 178 | 24373 | 234.62 | 495 | 483 | 101.8 |
| B | 4 | 239 | 1006244 | 11501.38 | 455 | 444 | 87.5 |
| B | 3 | 64 | 294235 | 3359.52 | 455 | 444 | 87.5 |
| B | 0 | 85 | 224007 | 2556.46 | 455 | 444 | 87.5 |
| C | 13 | 61 | 3540 | 27.29 | 482 | 483 | 112.0 |
| C | 8 | 222 | 2203 | 15.35 | 482 | 483 | 112.0 |
| C | 14 | 234 | 1611 | 10.07 | 482 | 483 | 112.0 |
| D | 8 | 195 | 154960 | 1313.29 | 478 | 464 | 117.6 |
| D | 1 | 52 | 42714 | 359.15 | 478 | 464 | 117.6 |
| D | 2 | 234 | 18844 | 156.24 | 478 | 464 | 117.6 |
Histogram calculated using DETX and DETY for each event in the final _common_clean file
| Quadrant A | 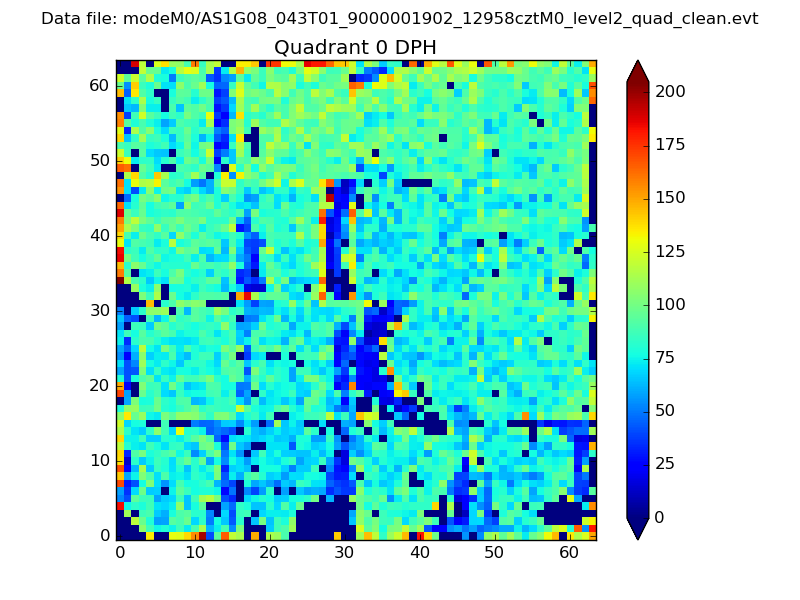 |
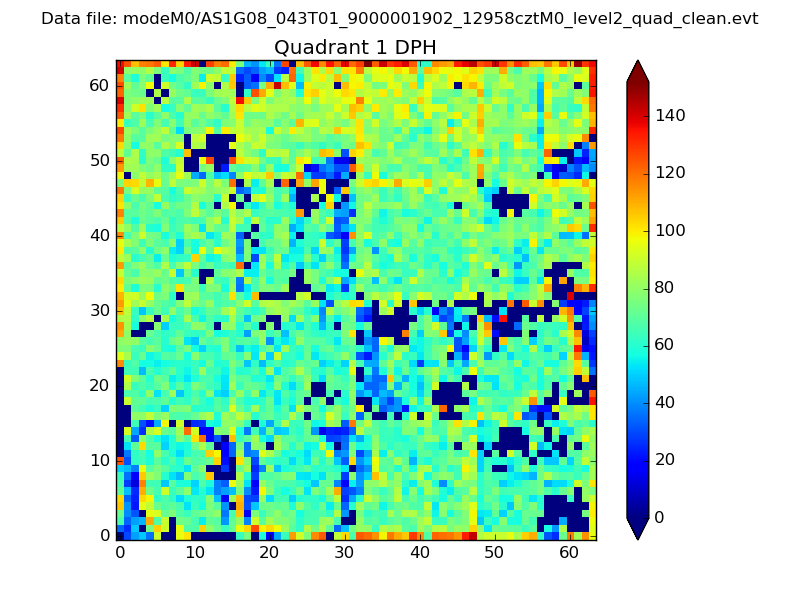 |
Quadrant B |
|---|---|---|---|
| Quadrant D | 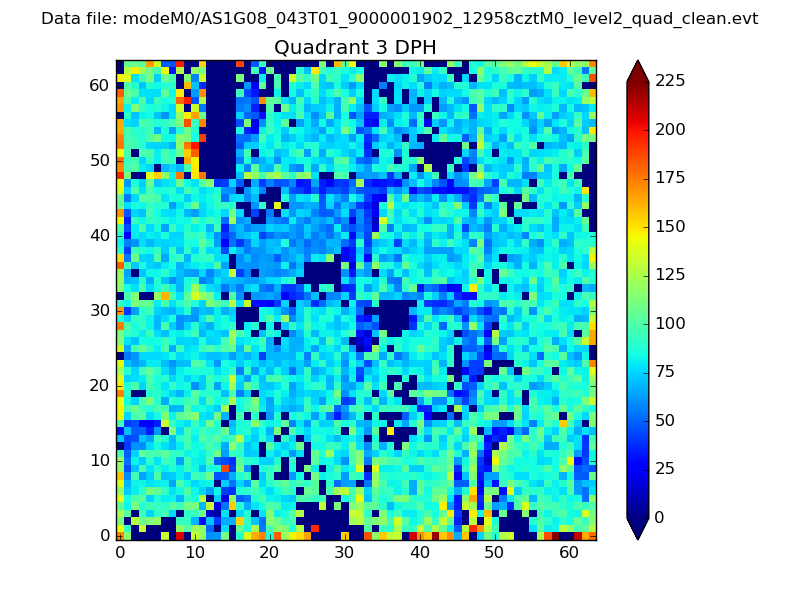 |
 |
Quadrant C |
| Plot type | Count rate plots | Images |
|---|---|---|
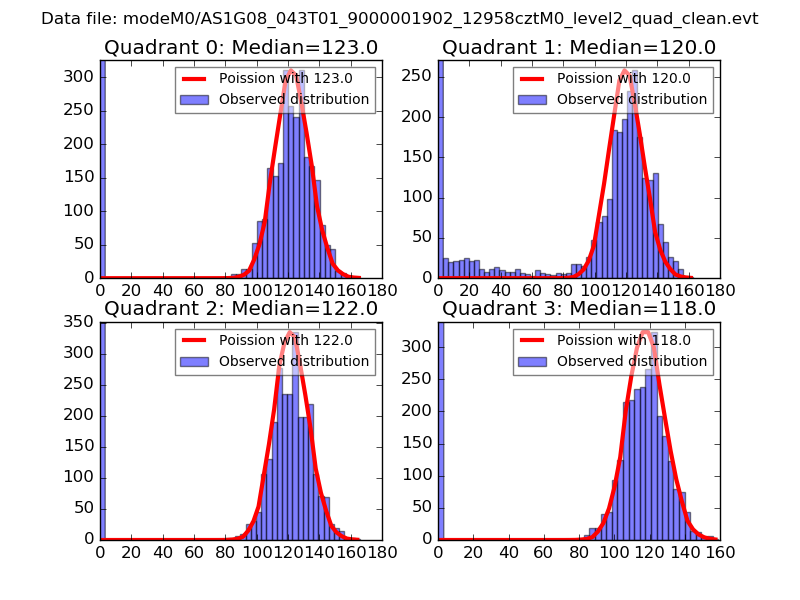
| Comparison with Poisson distribution Blue bars denote a histogram of data divided into 1 sec bins. Red curve is a Poisson curve with rate = median count rate of data. |
 |
 |
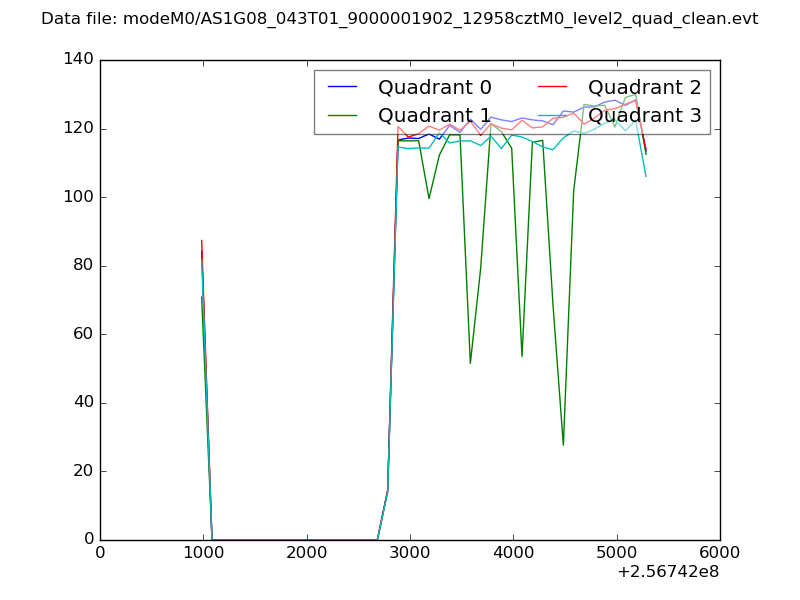
| Quadrant-wise count rates Data is divided into 100 sec bins |
 |
|
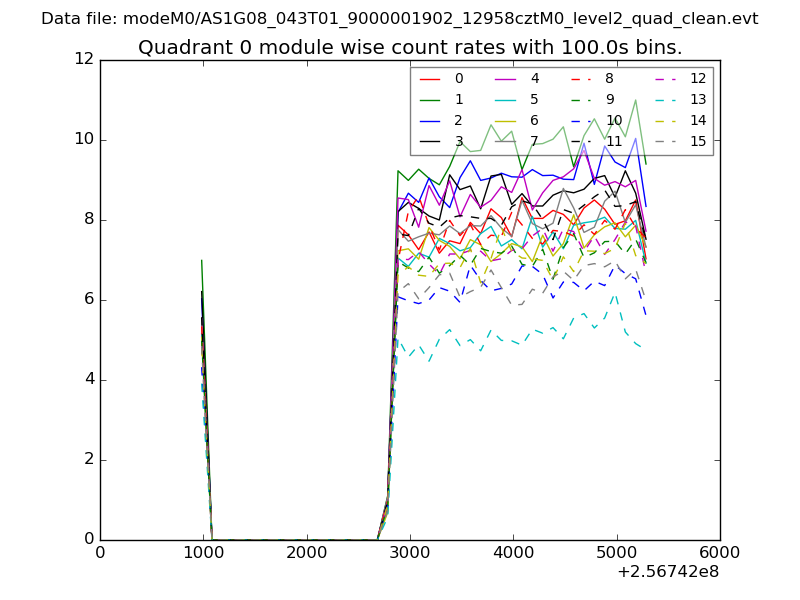
| Module-wise count rates for Quadrant A Data is divided into 100 sec bins |
 |
 |
| Module-wise count rates for Quadrant B Data is divided into 100 sec bins |
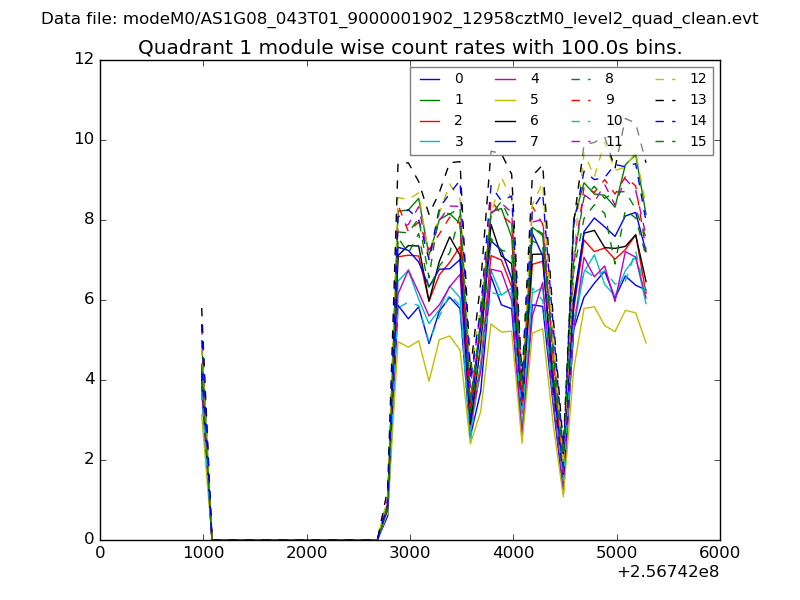 |
 |
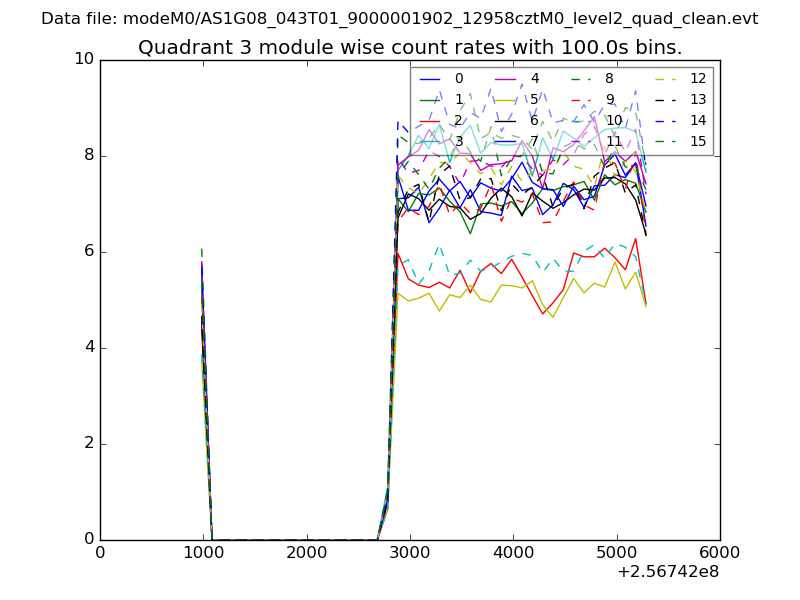
| Module-wise count rates for Quadrant C Data is divided into 100 sec bins |
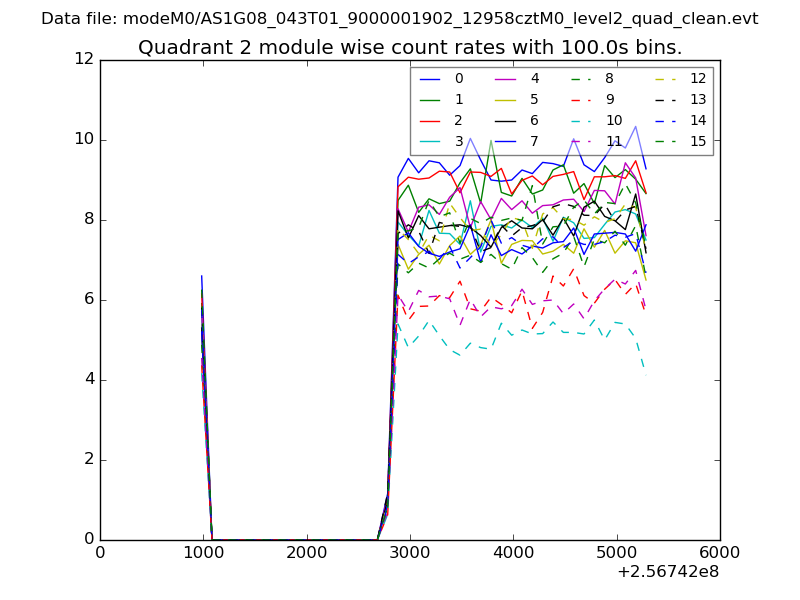 |
 |
| Module-wise count rates for Quadrant D Data is divided into 100 sec bins |
 |
 |
| Parameter | Plot |
|---|---|
| CZT HV Monitor | 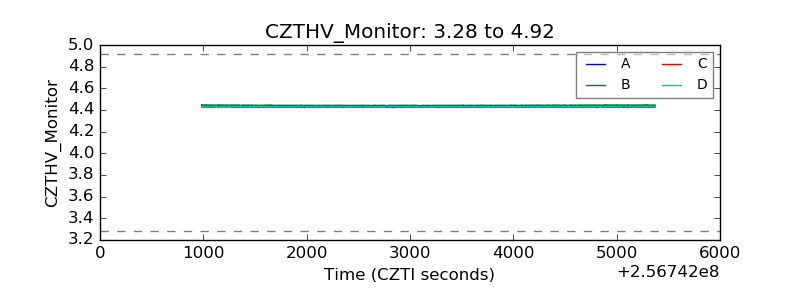 |
| D_VDD | 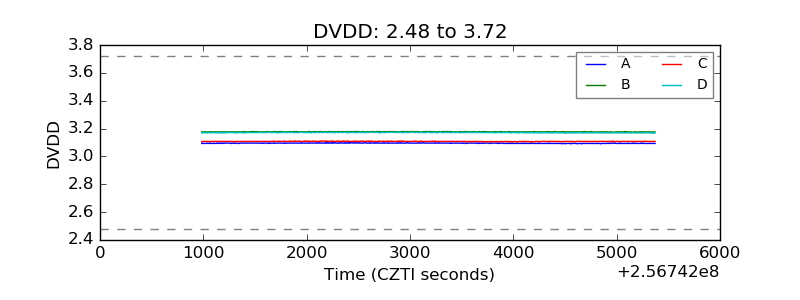 |
| Temperature 1 |  |
| Veto HV Monitor | 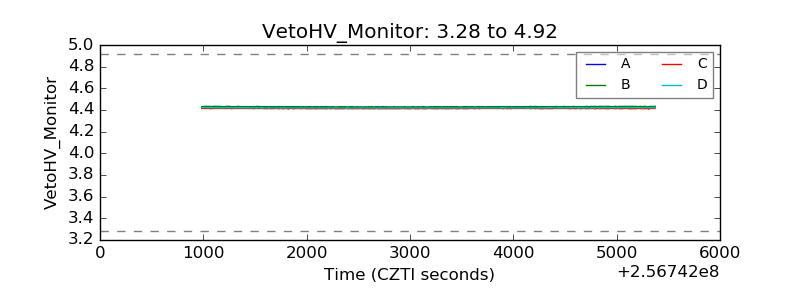 |
| Veto LLD | 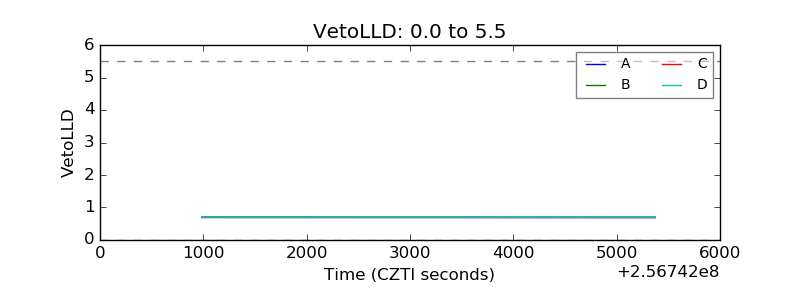 |
| Alpha Counter | 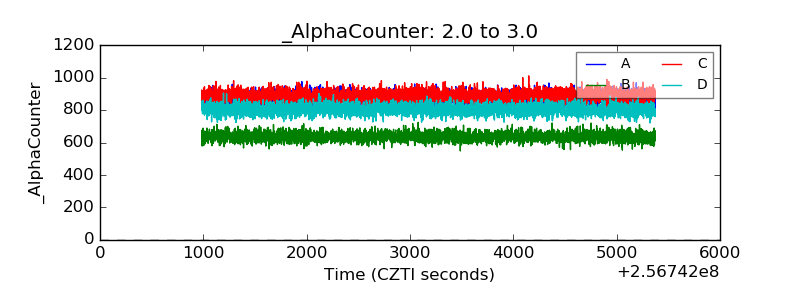 |
| _CPM_Rate | 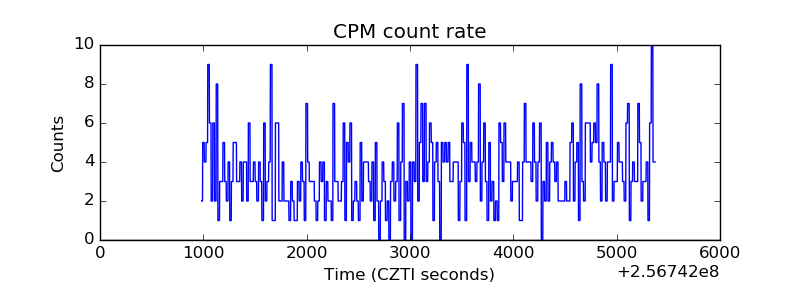 |
| CZT Counter | 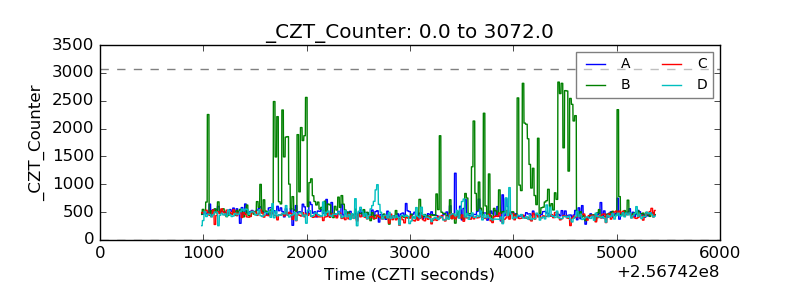 |
| +2.5 Volts monitor |  |
| +5 Volts monitor | 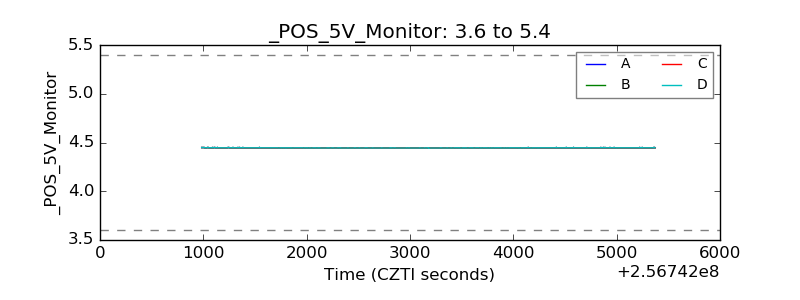 |
| _ROLL_ROT | 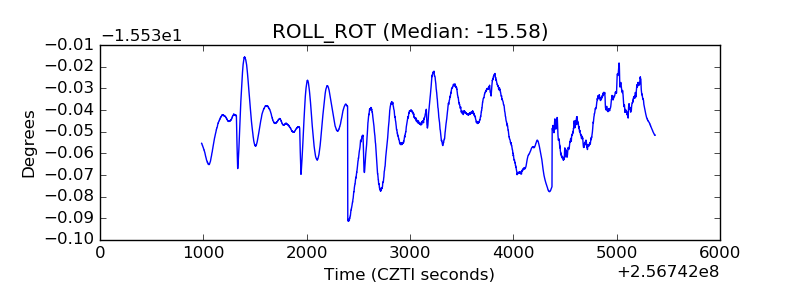 |
| _Roll_DEC | 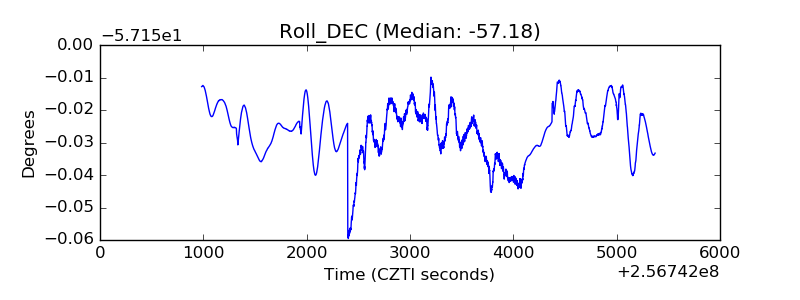 |
| _Roll_RA | 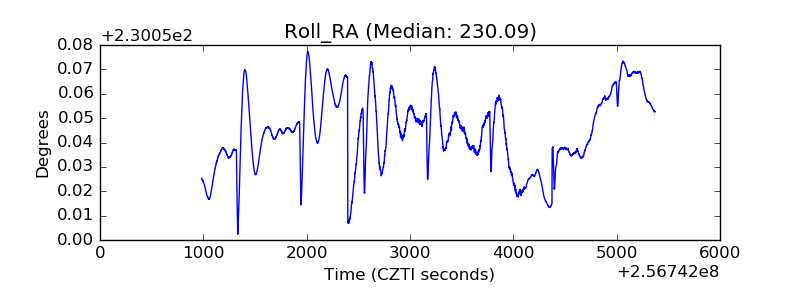 |
| Veto Counter | 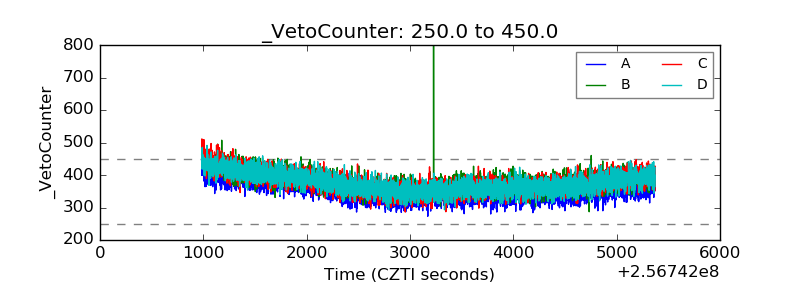 |