| Param | Original file | Final file |
|---|---|---|
| Filename | modeM0/AS1G08_033T01_9000001906cztM0_level2.fits | modeM0/AS1G08_033T01_9000001906cztM0_level2_quad_clean.evt |
| Size (bytes) | 161,303,040 | 172,512,000 |
| Size | 153.8 MB | 164.5 MB |
| Events in quadrant A | 971,028 | 1,060,217 |
| Events in quadrant B | 882,582 | 1,009,864 |
| Events in quadrant C | 975,660 | 1,027,725 |
| Events in quadrant D | 835,402 | 906,464 |
| Mode SS | |||
|---|---|---|---|
| Quadrant | BADHDUFLAG | Total packets | Discarded packets |
| A | 0 | 356 | 0 |
| B | 0 | 356 | 0 |
| C | 0 | 356 | 0 |
| D | 0 | 356 | 0 |
| Mode M0 | |||
|---|---|---|---|
| Quadrant | BADHDUFLAG | Total packets | Discarded packets |
| A | 0 | 41523 | 0 |
| B | 0 | 48369 | 0 |
| C | 0 | 35762 | 0 |
| D | 0 | 43138 | 0 |
| Mode M9 | |||
|---|---|---|---|
| Quadrant | BADHDUFLAG | Total packets | Discarded packets |
| A | 0 | 28 | 0 |
| B | 0 | 28 | 0 |
| C | 0 | 28 | 0 |
| D | 0 | 28 | 0 |
| Quadrant | Total seconds | Saturated seconds | Saturation percentage |
|---|---|---|---|
| A | 17708 | 246 | 1.389203% |
| B | 17708 | 1662 | 9.385588% |
| C | 17708 | 42 | 0.237181% |
| D | 17708 | 522 | 2.947820% |
Noise dominated data is calculated using 1-second bins in cleaned event files. If a bin has >2000 counts, and if more than 50% of those come from <1% of pixels, then it is considered to be noise-dominated and hence unusable.
| Quadrant | # 1 sec bins | Bins with >0 counts | Bins with >2000 counts | High rate bins dominated by noise | Noise dominated (total time) | Noise dominated (detector-on time) | Marked lightcurve |
|---|---|---|---|---|---|---|---|
| A | 20364 | 17709 | 0 | 0 | 0.00% | 0.00% |  |
| B | 20364 | 17519 | 0 | 0 | 0.00% | 0.00% |  |
| C | 20364 | 17709 | 0 | 0 | 0.00% | 0.00% |  |
| D | 20364 | 17709 | 0 | 0 | 0.00% | 0.00% |  |
Top three noisy pixels from each quadrant. If the there are fewer than three noisy pixels in the level2.evt file, extra rows are filled as -1
| Pixel properties | Quadrant properties | ||||||
|---|---|---|---|---|---|---|---|
| Quadrant | DetID | PixID | Counts | Sigma | Mean | Median | Sigma |
| A | 14 | 188 | 1010 | 11.92 | 252 | 236 | 65.0 |
| A | 0 | 29 | 919 | 10.52 | 252 | 236 | 65.0 |
| A | 14 | 204 | 864 | 9.67 | 252 | 236 | 65.0 |
| B | 2 | 9 | 811 | 11.9 | 233 | 222 | 49.5 |
| B | 3 | 17 | 637 | 8.39 | 233 | 222 | 49.5 |
| B | 2 | 8 | 578 | 7.19 | 233 | 222 | 49.5 |
| C | 12 | 241 | 728 | 7.19 | 257 | 239 | 68.0 |
| C | 3 | 158 | 675 | 6.41 | 257 | 239 | 68.0 |
| C | 7 | 111 | 659 | 6.18 | 257 | 239 | 68.0 |
| D | 10 | 189 | 631 | 6.33 | 238 | 216 | 65.6 |
| D | 3 | 14 | 605 | 5.93 | 238 | 216 | 65.6 |
| D | 6 | 231 | 604 | 5.92 | 238 | 216 | 65.6 |
Histogram calculated using DETX and DETY for each event in the final _common_clean file
| Quadrant A | 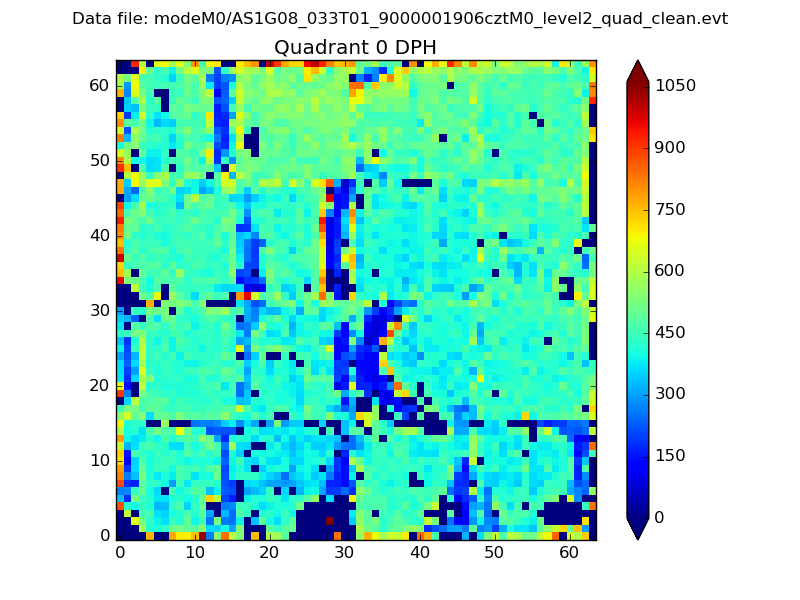 |
 |
Quadrant B |
|---|---|---|---|
| Quadrant D |  |
 |
Quadrant C |
| Plot type | Count rate plots | Images |
|---|---|---|
| Comparison with Poisson distribution Blue bars denote a histogram of data divided into 1 sec bins. Red curve is a Poisson curve with rate = median count rate of data. |
 |
 |
| Quadrant-wise count rates Data is divided into 100 sec bins |
 |
|
| Module-wise count rates for Quadrant A Data is divided into 100 sec bins |
 |
 |
| Module-wise count rates for Quadrant B Data is divided into 100 sec bins |
 |
 |
| Module-wise count rates for Quadrant C Data is divided into 100 sec bins |
 |
 |
| Module-wise count rates for Quadrant D Data is divided into 100 sec bins |
 |
 |
| Parameter | Plot |
|---|---|
| CZT HV Monitor |  |
| D_VDD |  |
| Temperature 1 |  |
| Veto HV Monitor |  |
| Veto LLD |  |
| Alpha Counter |  |
| _CPM_Rate |  |
| CZT Counter |  |
| +2.5 Volts monitor |  |
| +5 Volts monitor |  |
| _ROLL_ROT |  |
| _Roll_DEC |  |
| _Roll_RA |  |
| Veto Counter |  |