| Param | Original file | Final file |
|---|---|---|
| Filename | modeM0/AS1G08_033T01_9000001906_12962cztM0_level2.evt | modeM0/AS1G08_033T01_9000001906_12962cztM0_level2_quad_clean.evt |
| Size (bytes) | 407,462,400 | 74,545,920 |
| Size | 388.6 MB | 71.1 MB |
| Events in quadrant A | 3,013,374 | 485,616 |
| Events in quadrant B | 3,674,071 | 464,709 |
| Events in quadrant C | 2,341,797 | 483,440 |
| Events in quadrant D | 2,957,398 | 459,612 |
| Mode SS | |||
|---|---|---|---|
| Quadrant | BADHDUFLAG | Total packets | Discarded packets |
| A | 0 | 104 | 0 |
| B | 0 | 104 | 0 |
| C | 0 | 104 | 0 |
| D | 0 | 104 | 0 |
| Mode M0 | |||
|---|---|---|---|
| Quadrant | BADHDUFLAG | Total packets | Discarded packets |
| A | 0 | 12516 | 2 |
| B | 0 | 14368 | 1 |
| C | 0 | 10535 | 1 |
| D | 0 | 12381 | 1 |
| Mode M9 | |||
|---|---|---|---|
| Quadrant | BADHDUFLAG | Total packets | Discarded packets |
| A | 0 | 8 | 0 |
| B | 0 | 8 | 0 |
| C | 0 | 8 | 0 |
| D | 0 | 8 | 0 |
| Quadrant | Total seconds | Saturated seconds | Saturation percentage |
|---|---|---|---|
| A | 5198 | 69 | 1.327434% |
| B | 5198 | 532 | 10.234706% |
| C | 5198 | 19 | 0.365525% |
| D | 5198 | 180 | 3.462870% |
Noise dominated data is calculated using 1-second bins in cleaned event files. If a bin has >2000 counts, and if more than 50% of those come from <1% of pixels, then it is considered to be noise-dominated and hence unusable.
| Quadrant | # 1 sec bins | Bins with >0 counts | Bins with >2000 counts | High rate bins dominated by noise | Noise dominated (total time) | Noise dominated (detector-on time) | Marked lightcurve |
|---|---|---|---|---|---|---|---|
| A | 5909 | 5200 | 23 | 23 | 0.39% | 0.44% | 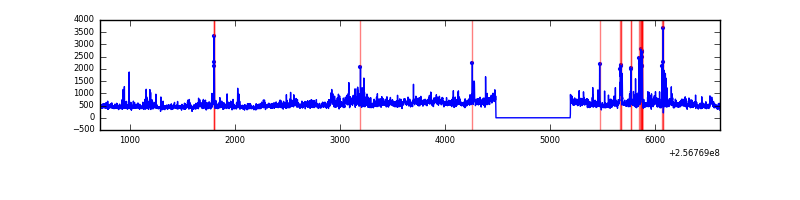 |
| B | 5909 | 5200 | 324 | 324 | 5.48% | 6.23% | 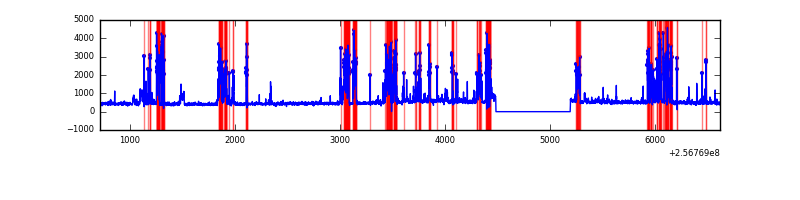 |
| C | 5909 | 5200 | 1 | 1 | 0.02% | 0.02% | 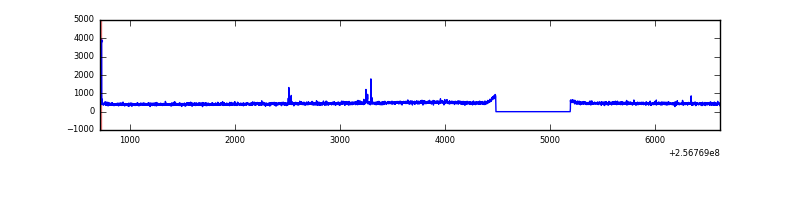 |
| D | 5909 | 5200 | 140 | 140 | 2.37% | 2.69% | 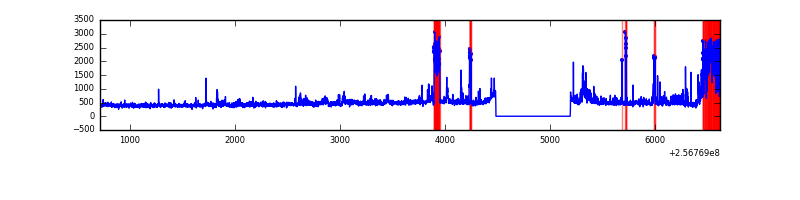 |
Top three noisy pixels from each quadrant. If the there are fewer than three noisy pixels in the level2.evt file, extra rows are filled as -1
| Pixel properties | Quadrant properties | ||||||
|---|---|---|---|---|---|---|---|
| Quadrant | DetID | PixID | Counts | Sigma | Mean | Median | Sigma |
| A | 12 | 189 | 232679 | 1861.89 | 607 | 594 | 124.7 |
| A | 1 | 162 | 116895 | 933.02 | 607 | 594 | 124.7 |
| A | 15 | 223 | 116795 | 932.22 | 607 | 594 | 124.7 |
| B | 4 | 239 | 1098136 | 9959.56 | 577 | 563 | 110.2 |
| B | 3 | 64 | 227998 | 2063.78 | 577 | 563 | 110.2 |
| B | 0 | 219 | 30485 | 271.52 | 577 | 563 | 110.2 |
| C | 14 | 234 | 20381 | 143.04 | 594 | 596 | 138.3 |
| C | 13 | 61 | 4489 | 28.15 | 594 | 596 | 138.3 |
| C | 8 | 222 | 2361 | 12.76 | 594 | 596 | 138.3 |
| D | 1 | 52 | 433430 | 3009.96 | 587 | 568 | 143.8 |
| D | 8 | 195 | 129714 | 898.03 | 587 | 568 | 143.8 |
| D | 12 | 110 | 100215 | 692.9 | 587 | 568 | 143.8 |
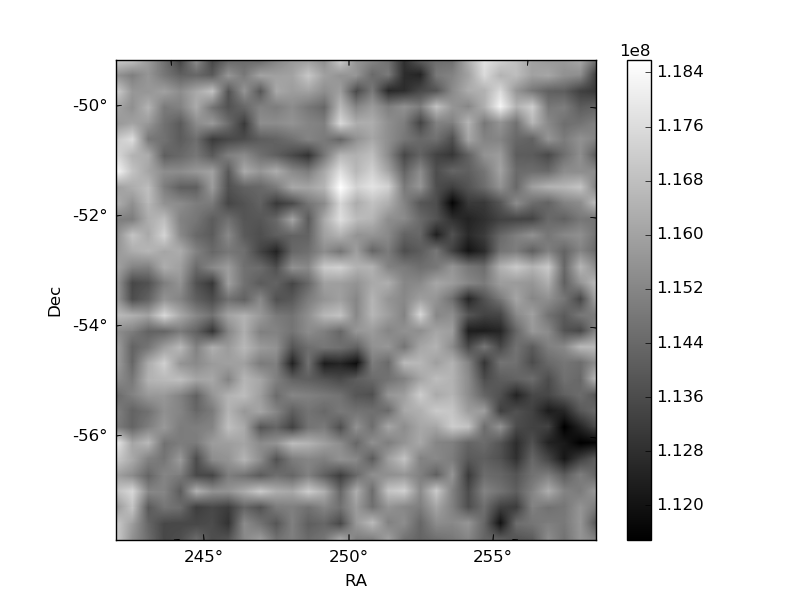
Histogram calculated using DETX and DETY for each event in the final _common_clean file
| Quadrant A | 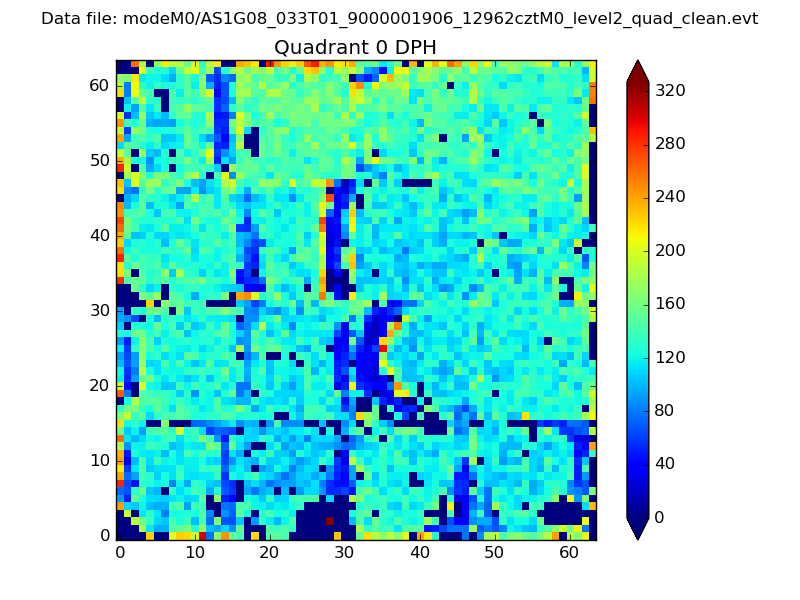 |
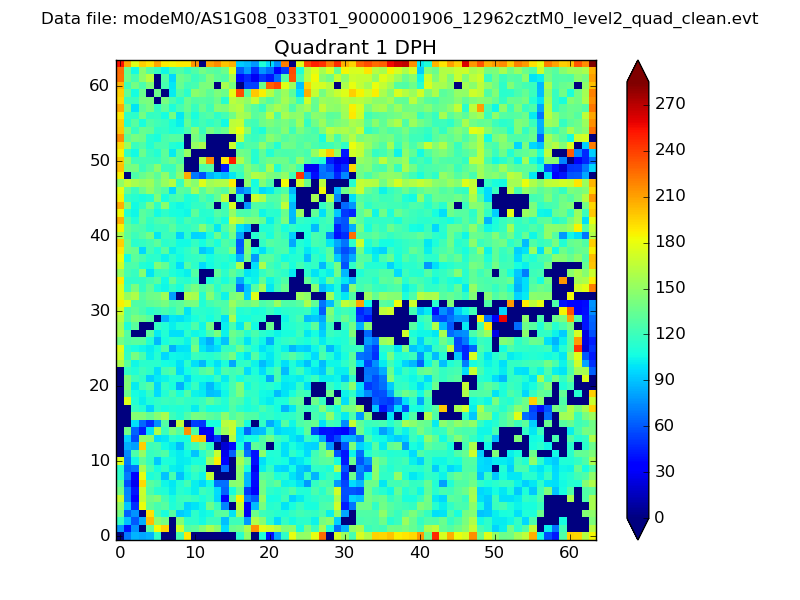 |
Quadrant B |
|---|---|---|---|
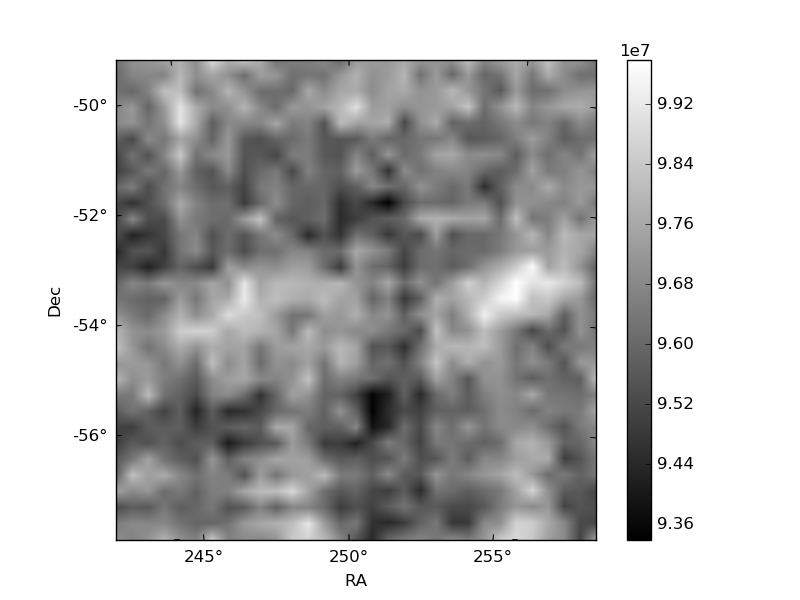
| Quadrant D | 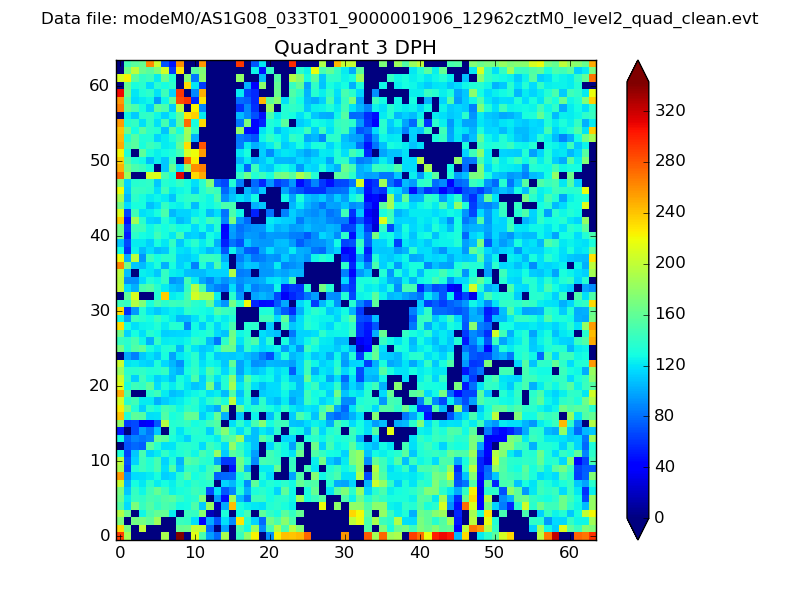 |
 |
Quadrant C |
| Plot type | Count rate plots | Images |
|---|---|---|
| Comparison with Poisson distribution Blue bars denote a histogram of data divided into 1 sec bins. Red curve is a Poisson curve with rate = median count rate of data. |
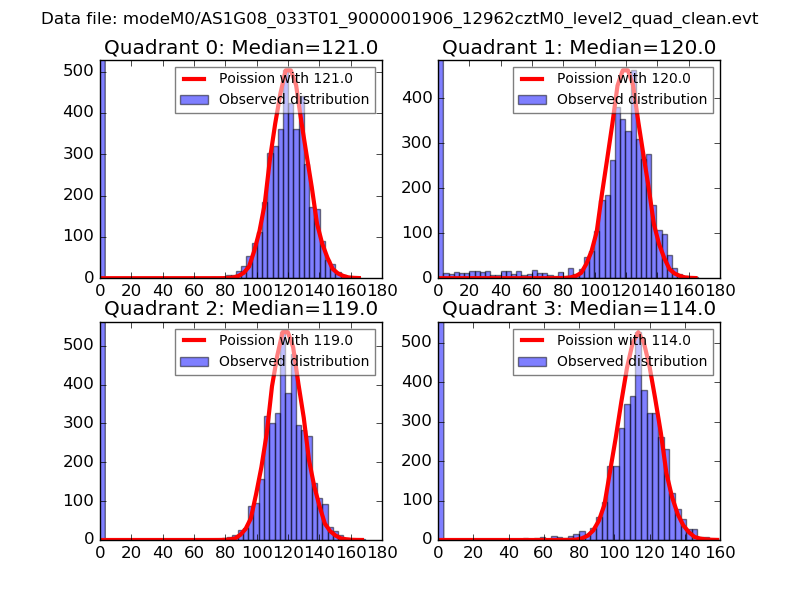 |
 |
| Quadrant-wise count rates Data is divided into 100 sec bins |
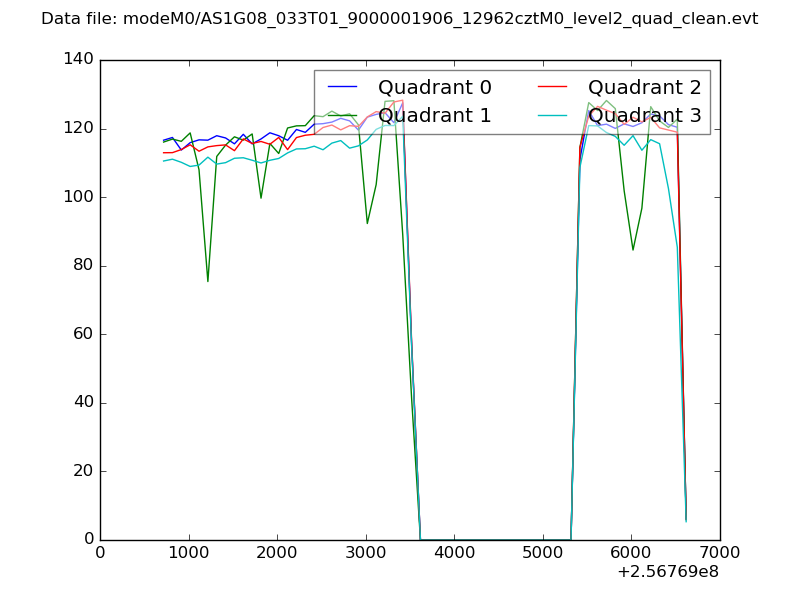 |
|
| Module-wise count rates for Quadrant A Data is divided into 100 sec bins |
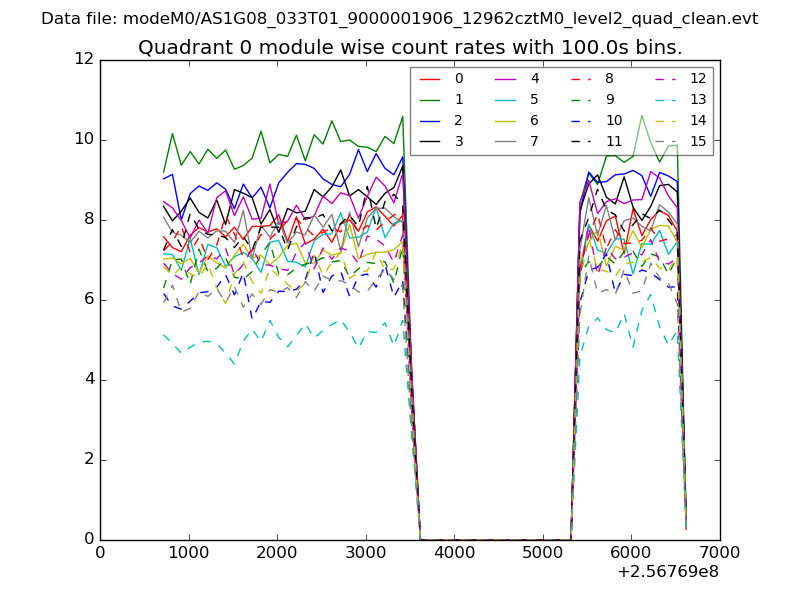 |
 |
| Module-wise count rates for Quadrant B Data is divided into 100 sec bins |
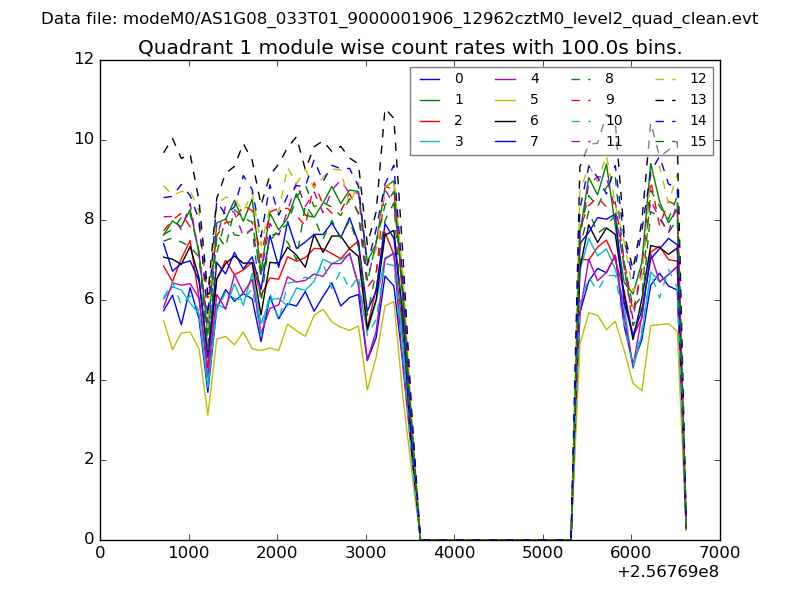 |
 |
| Module-wise count rates for Quadrant C Data is divided into 100 sec bins |
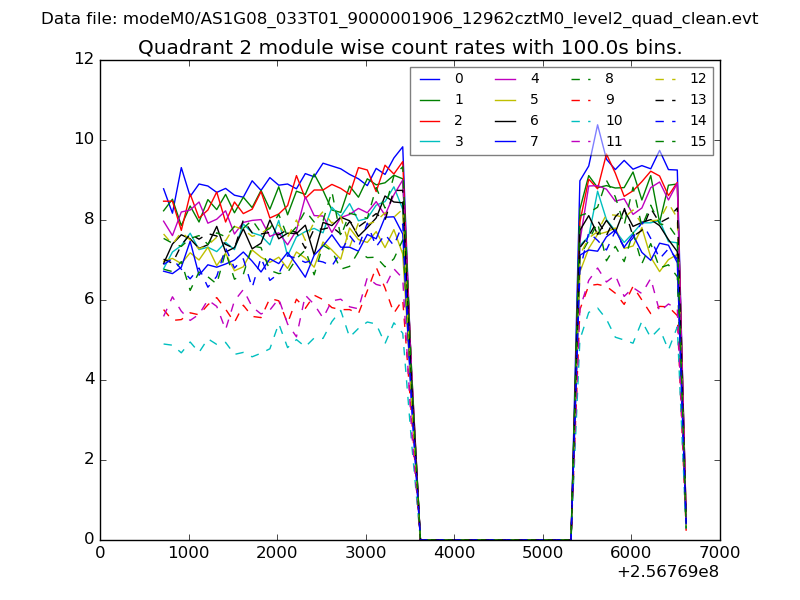 |
 |
| Module-wise count rates for Quadrant D Data is divided into 100 sec bins |
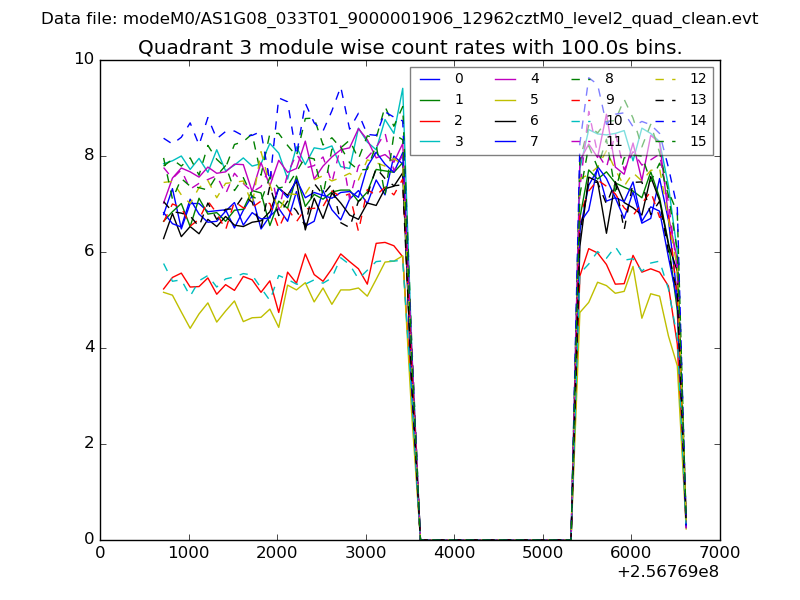 |
 |
| Parameter | Plot |
|---|---|
| CZT HV Monitor | 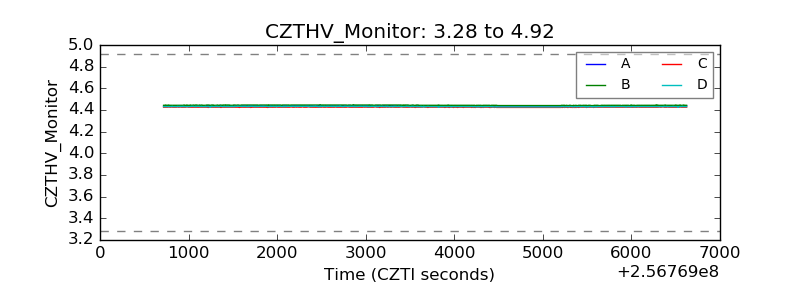 |
| D_VDD |  |
| Temperature 1 | 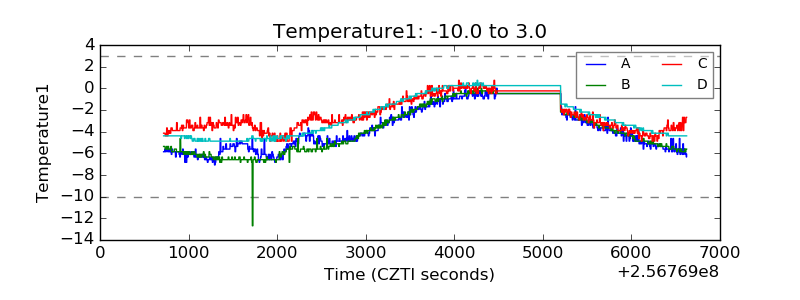 |
| Veto HV Monitor | 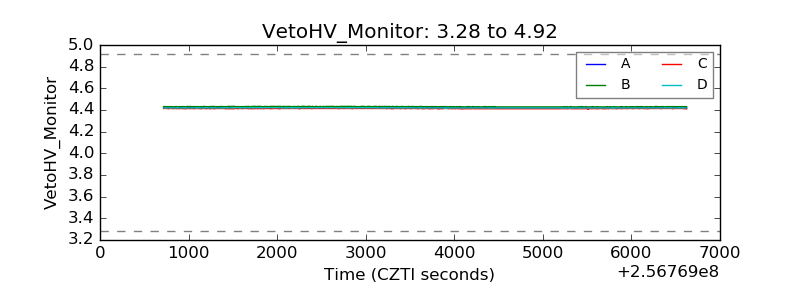 |
| Veto LLD | 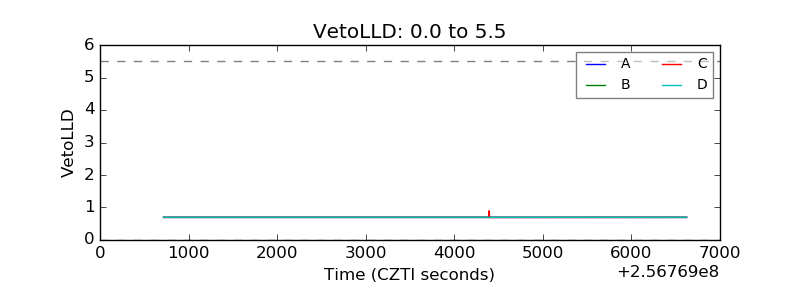 |
| Alpha Counter | 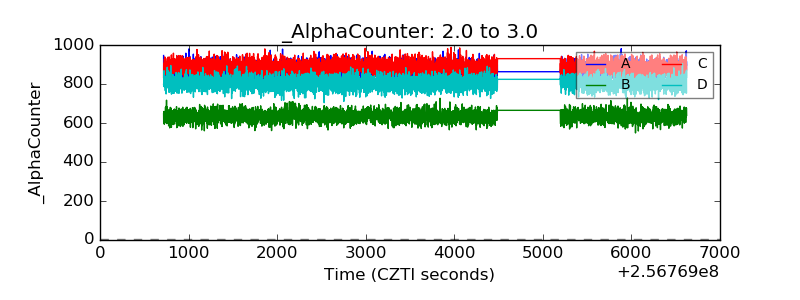 |
| _CPM_Rate | 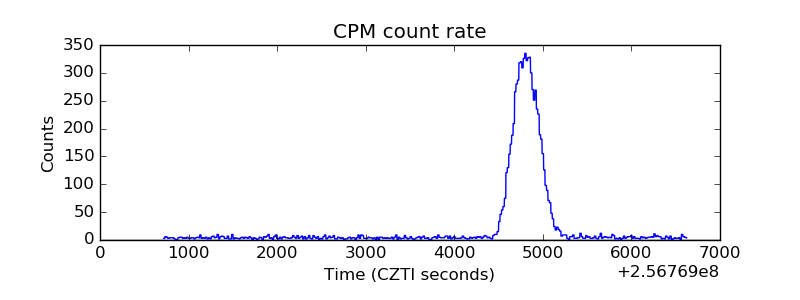 |
| CZT Counter |  |
| +2.5 Volts monitor |  |
| +5 Volts monitor | 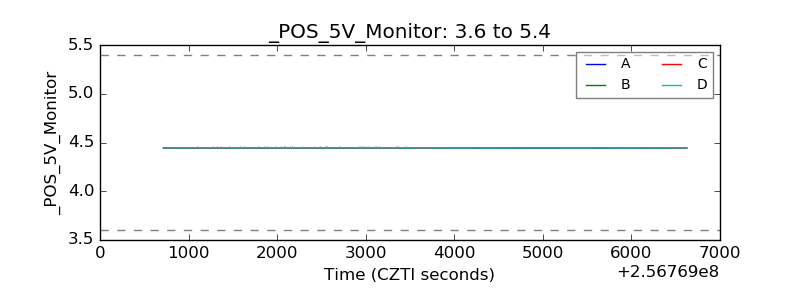 |
| _ROLL_ROT | 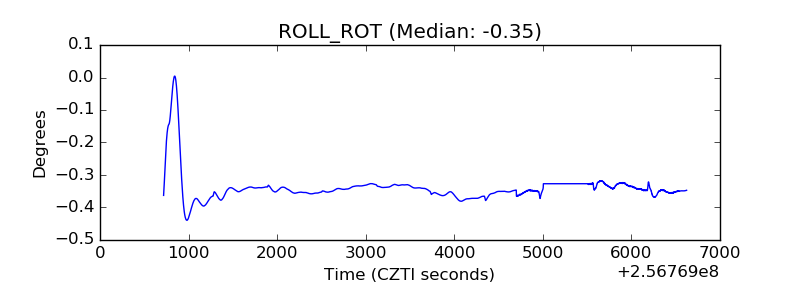 |
| _Roll_DEC | 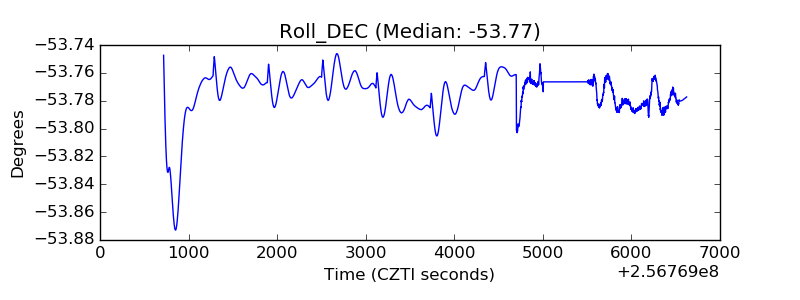 |
| _Roll_RA | 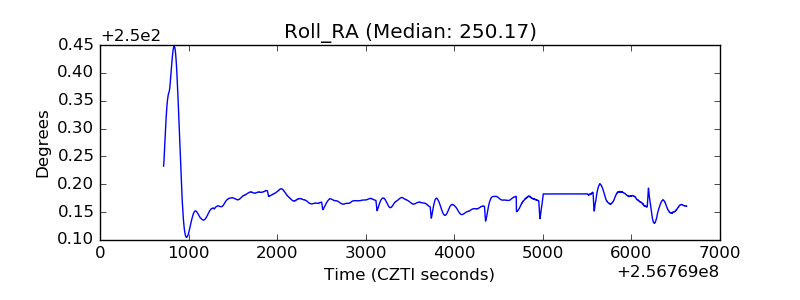 |
| Veto Counter | 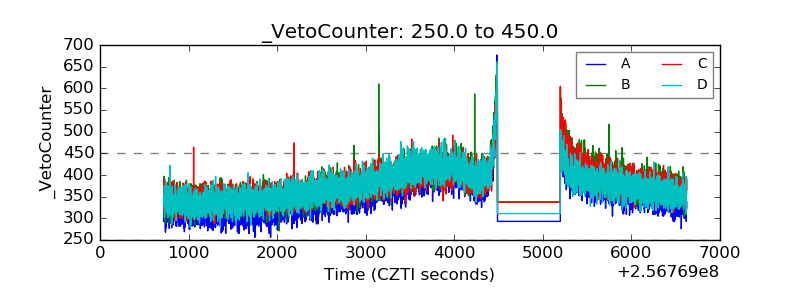 |