| Param | Original file | Final file |
|---|---|---|
| Filename | modeM0/AS1G08_033T01_9000001906_12963cztM0_level2.evt | modeM0/AS1G08_033T01_9000001906_12963cztM0_level2_quad_clean.evt |
| Size (bytes) | 597,133,440 | 101,018,880 |
| Size | 569.5 MB | 96.3 MB |
| Events in quadrant A | 4,219,754 | 652,129 |
| Events in quadrant B | 5,171,612 | 627,125 |
| Events in quadrant C | 3,339,908 | 656,746 |
| Events in quadrant D | 4,853,736 | 610,640 |
| Mode SS | |||
|---|---|---|---|
| Quadrant | BADHDUFLAG | Total packets | Discarded packets |
| A | 0 | 150 | 0 |
| B | 0 | 150 | 0 |
| C | 0 | 150 | 0 |
| D | 0 | 150 | 0 |
| Mode M0 | |||
|---|---|---|---|
| Quadrant | BADHDUFLAG | Total packets | Discarded packets |
| A | 0 | 17473 | 3 |
| B | 0 | 20199 | 2 |
| C | 0 | 14892 | 2 |
| D | 0 | 19290 | 2 |
| Mode M9 | |||
|---|---|---|---|
| Quadrant | BADHDUFLAG | Total packets | Discarded packets |
| A | 0 | 17 | 0 |
| B | 0 | 17 | 0 |
| C | 0 | 17 | 0 |
| D | 0 | 17 | 0 |
| Quadrant | Total seconds | Saturated seconds | Saturation percentage |
|---|---|---|---|
| A | 7366 | 125 | 1.696986% |
| B | 7366 | 745 | 10.114037% |
| C | 7366 | 28 | 0.380125% |
| D | 7366 | 363 | 4.928048% |
Noise dominated data is calculated using 1-second bins in cleaned event files. If a bin has >2000 counts, and if more than 50% of those come from <1% of pixels, then it is considered to be noise-dominated and hence unusable.
| Quadrant | # 1 sec bins | Bins with >0 counts | Bins with >2000 counts | High rate bins dominated by noise | Noise dominated (total time) | Noise dominated (detector-on time) | Marked lightcurve |
|---|---|---|---|---|---|---|---|
| A | 8972 | 7369 | 43 | 43 | 0.48% | 0.58% | 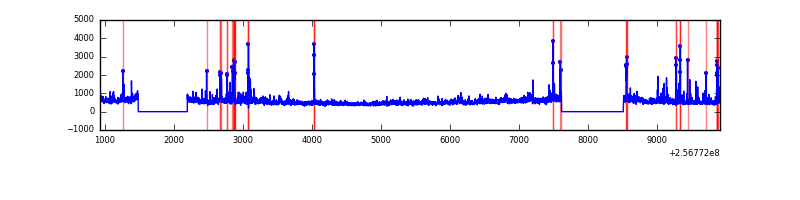 |
| B | 8972 | 7369 | 409 | 409 | 4.56% | 5.55% | 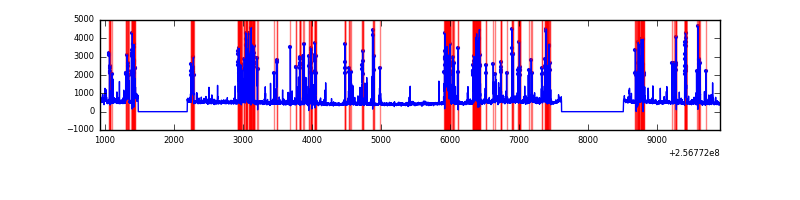 |
| C | 8972 | 7369 | 0 | 0 | 0.00% | 0.00% |  |
| D | 8972 | 7369 | 342 | 342 | 3.81% | 4.64% | 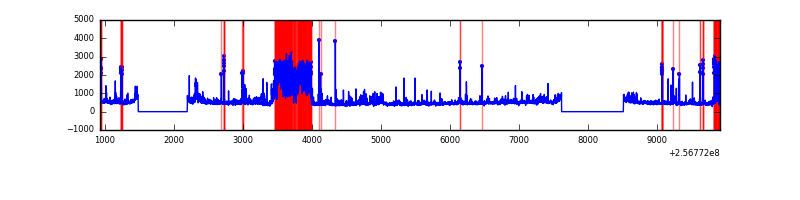 |
Top three noisy pixels from each quadrant. If the there are fewer than three noisy pixels in the level2.evt file, extra rows are filled as -1
| Pixel properties | Quadrant properties | ||||||
|---|---|---|---|---|---|---|---|
| Quadrant | DetID | PixID | Counts | Sigma | Mean | Median | Sigma |
| A | 12 | 189 | 186376 | 1048.05 | 873 | 855 | 177.0 |
| A | 15 | 223 | 181926 | 1022.91 | 873 | 855 | 177.0 |
| A | 1 | 162 | 166983 | 938.49 | 873 | 855 | 177.0 |
| B | 4 | 239 | 1419954 | 8926.94 | 834 | 811 | 159.0 |
| B | 3 | 64 | 376821 | 2365.24 | 834 | 811 | 159.0 |
| B | 0 | 219 | 32443 | 198.98 | 834 | 811 | 159.0 |
| C | 14 | 234 | 6563 | 28.74 | 854 | 857 | 198.5 |
| C | 13 | 61 | 6326 | 27.55 | 854 | 857 | 198.5 |
| C | 8 | 222 | 3440 | 13.01 | 854 | 857 | 198.5 |
| D | 1 | 52 | 1128807 | 5440.45 | 842 | 814 | 207.3 |
| D | 8 | 195 | 281685 | 1354.68 | 842 | 814 | 207.3 |
| D | 12 | 110 | 84450 | 403.39 | 842 | 814 | 207.3 |
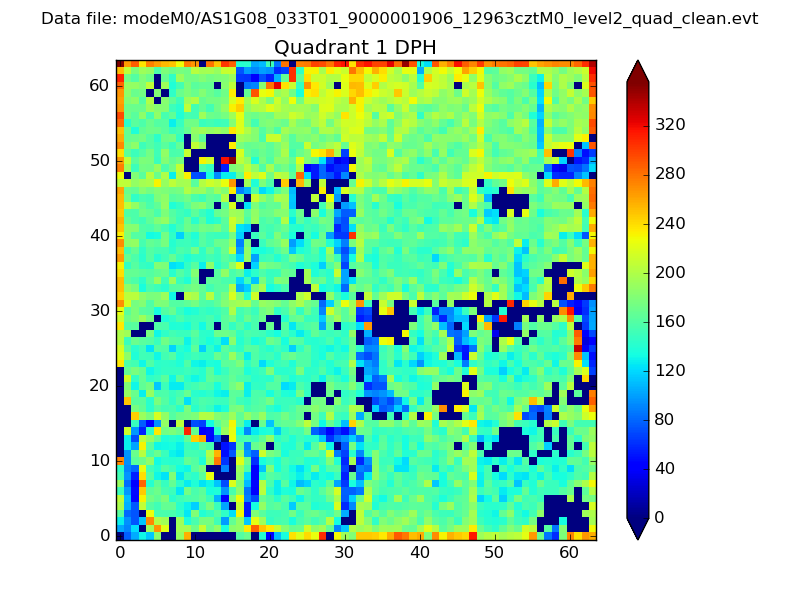
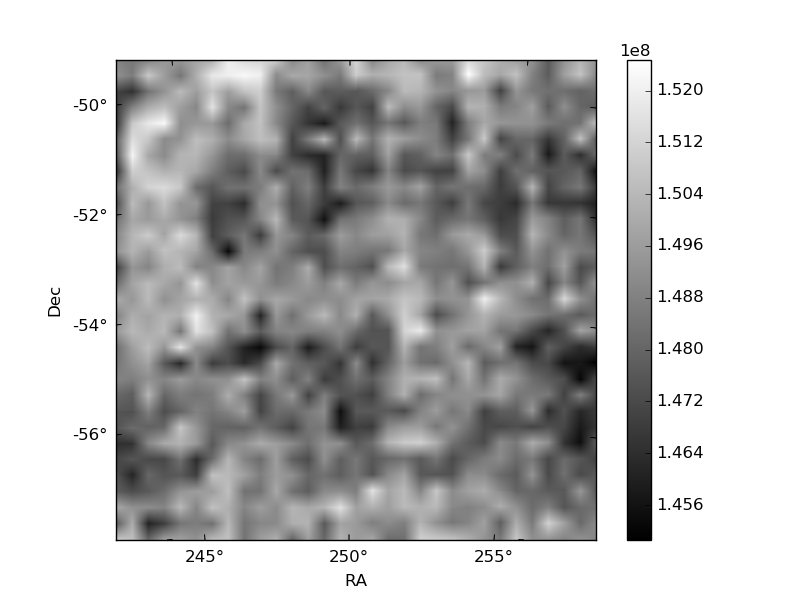
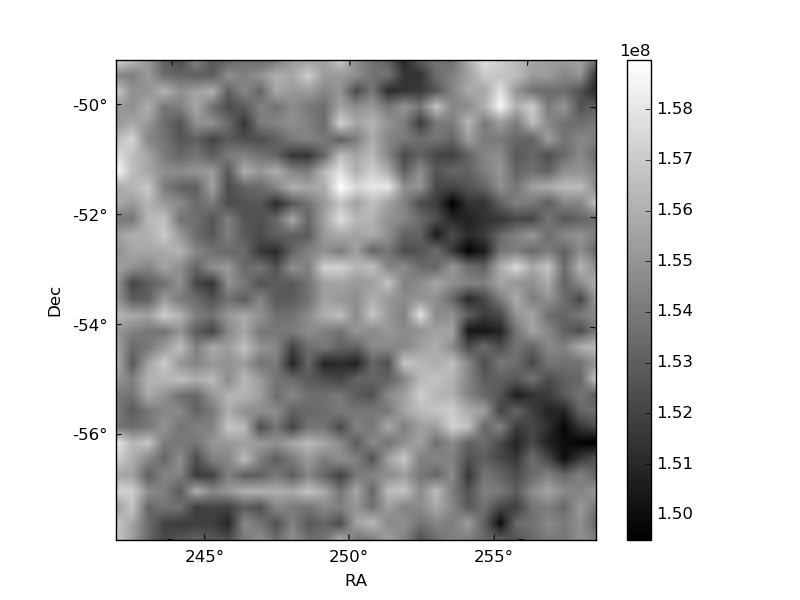
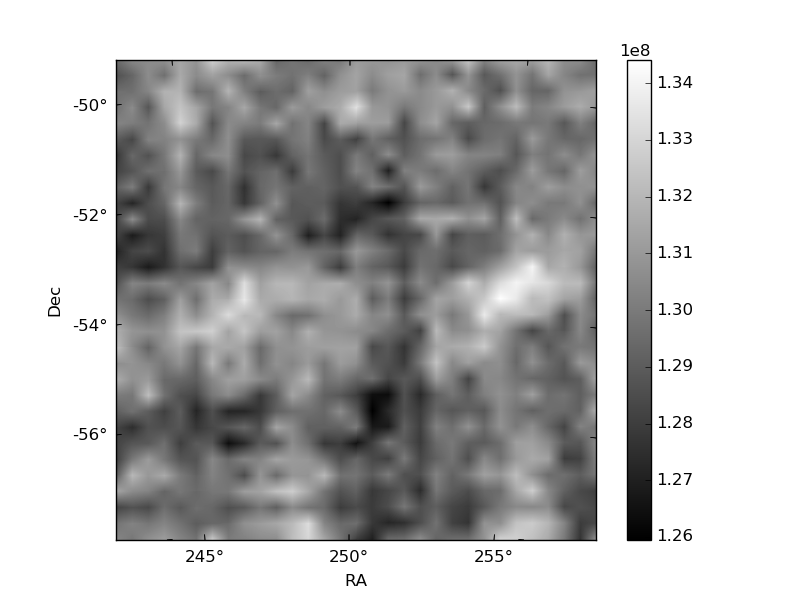
Histogram calculated using DETX and DETY for each event in the final _common_clean file
| Quadrant A | 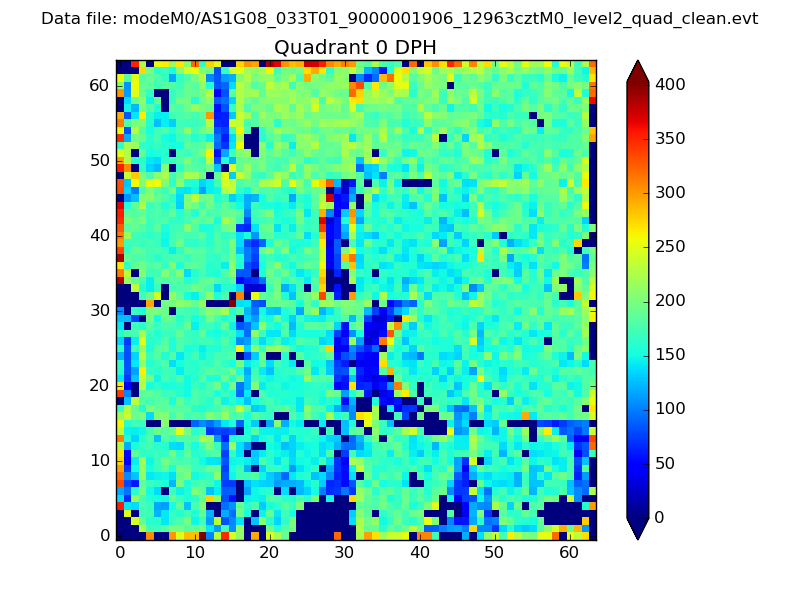 |
 |
Quadrant B |
|---|---|---|---|
| Quadrant D | 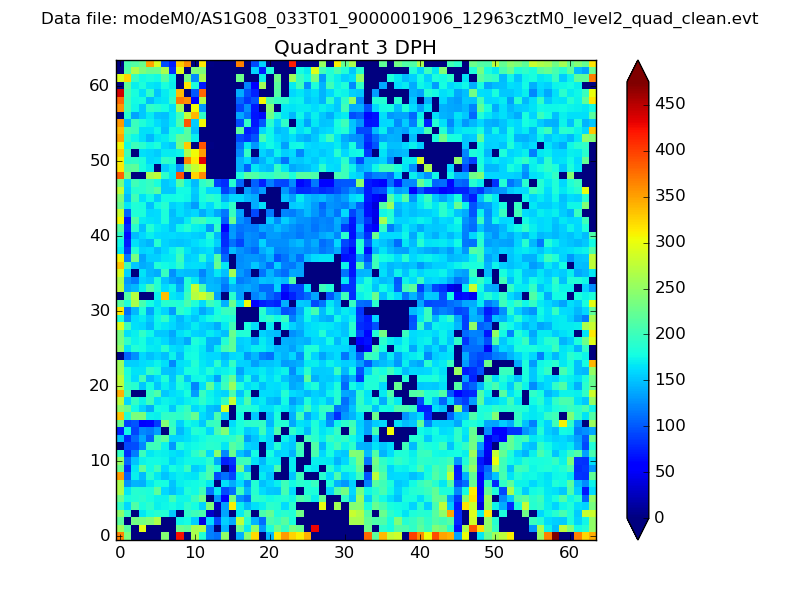 |
 |
Quadrant C |
| Plot type | Count rate plots | Images |
|---|---|---|
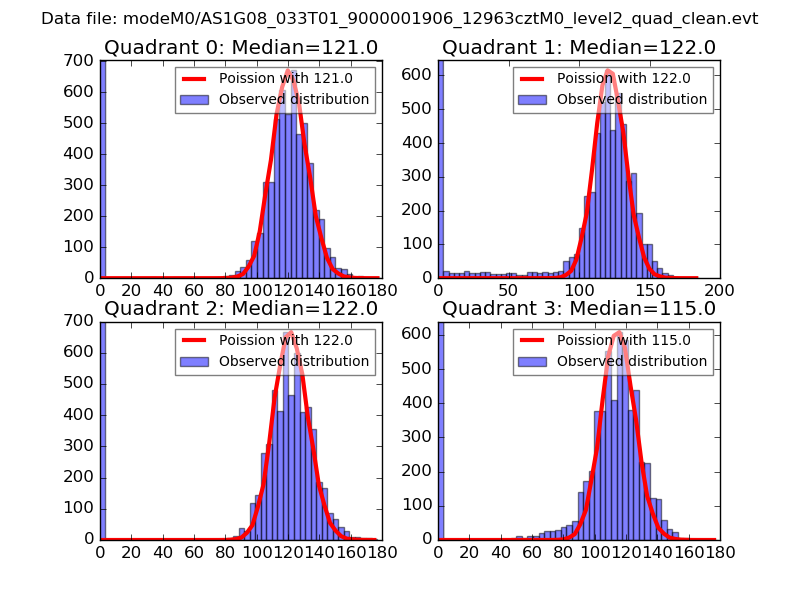
| Comparison with Poisson distribution Blue bars denote a histogram of data divided into 1 sec bins. Red curve is a Poisson curve with rate = median count rate of data. |
 |
 |
| Quadrant-wise count rates Data is divided into 100 sec bins |
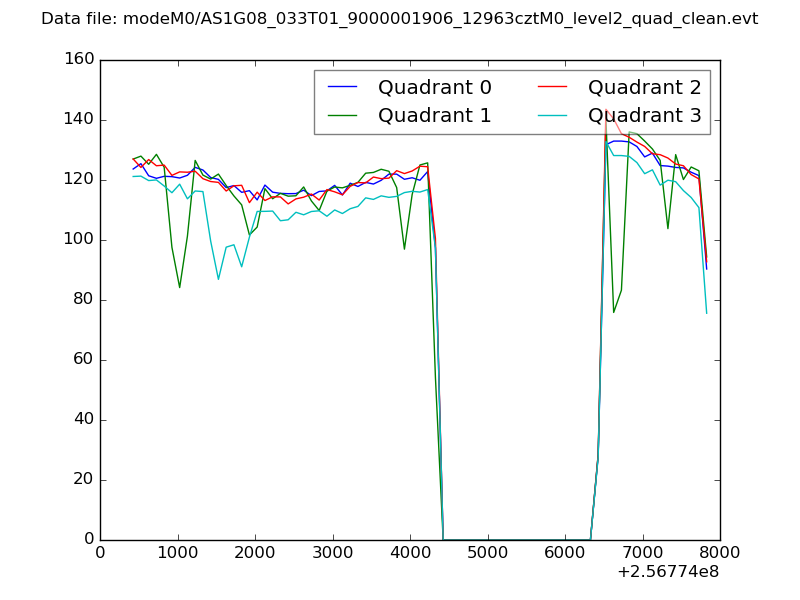 |
|
| Module-wise count rates for Quadrant A Data is divided into 100 sec bins |
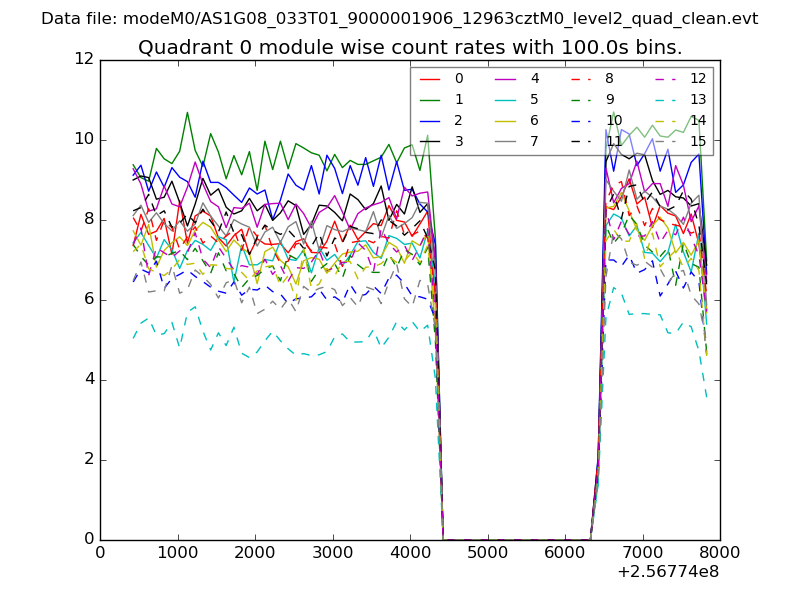 |
 |
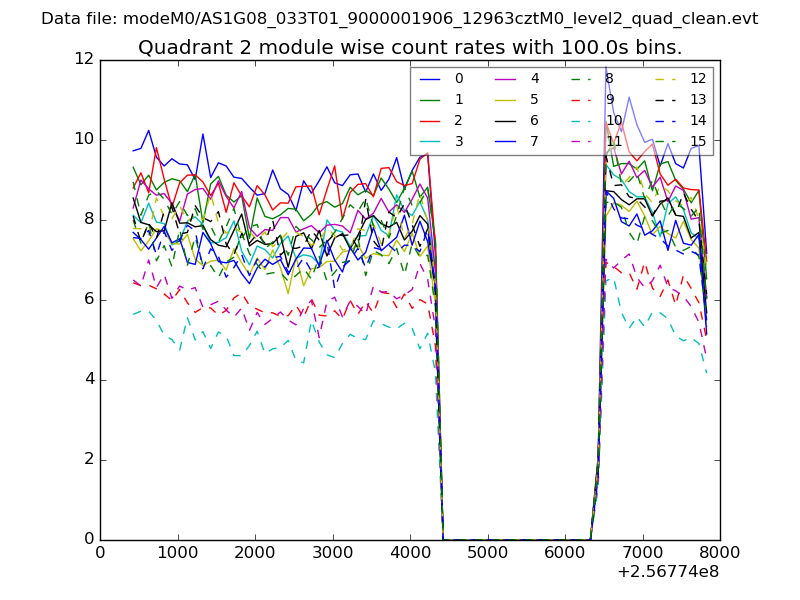
| Module-wise count rates for Quadrant B Data is divided into 100 sec bins |
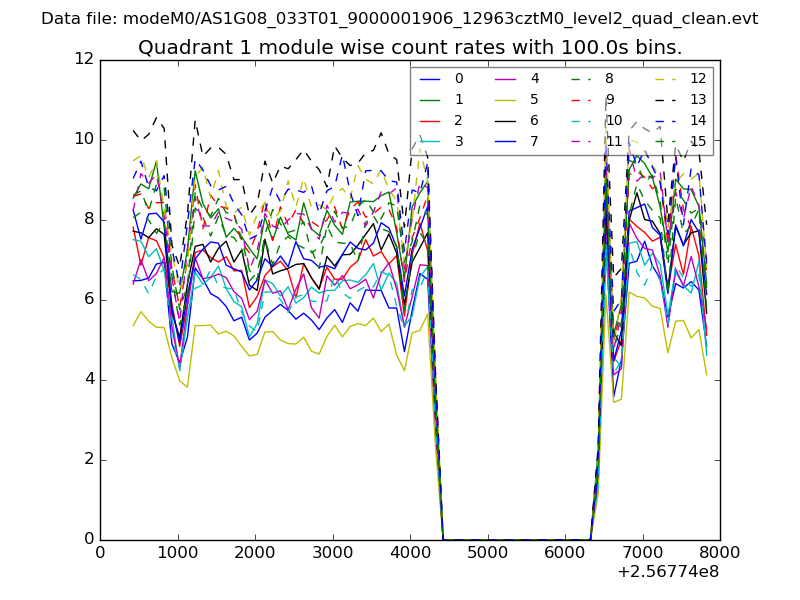 |
 |
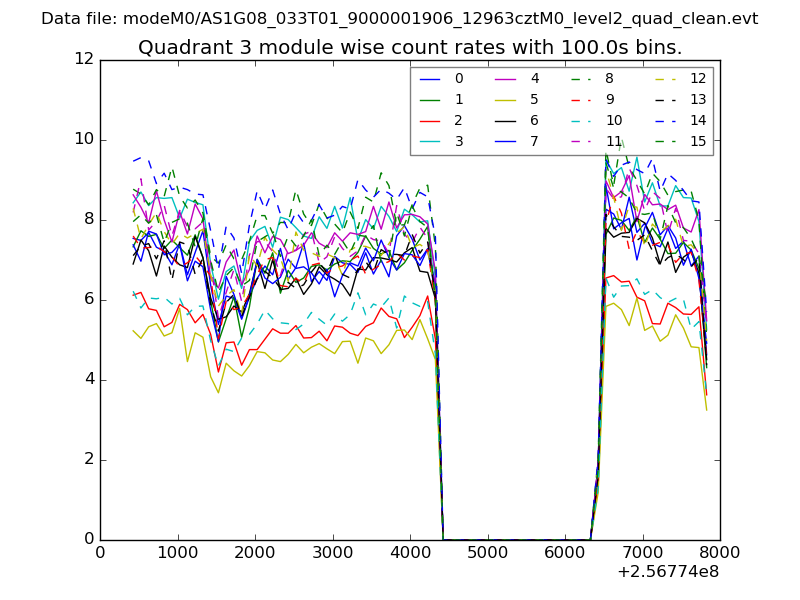
| Module-wise count rates for Quadrant C Data is divided into 100 sec bins |
 |
 |
| Module-wise count rates for Quadrant D Data is divided into 100 sec bins |
 |
 |
| Parameter | Plot |
|---|---|
| CZT HV Monitor | 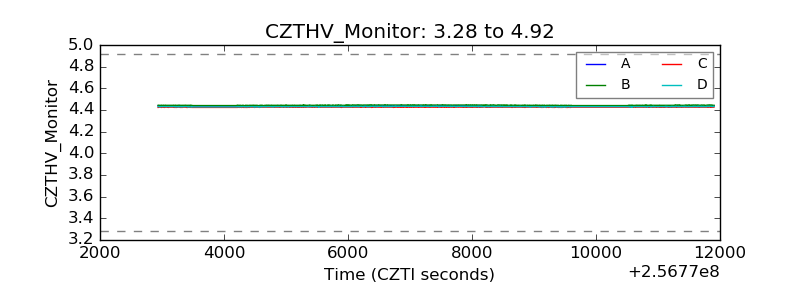 |
| D_VDD | 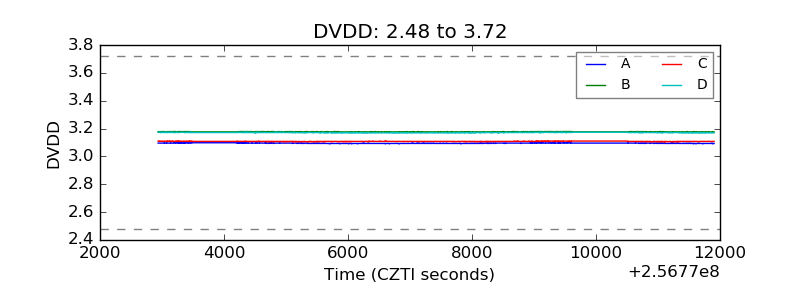 |
| Temperature 1 | 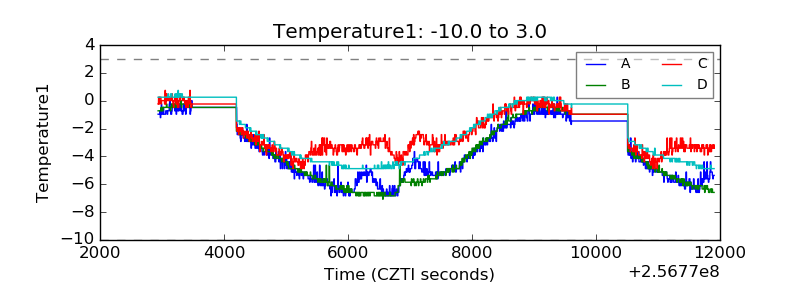 |
| Veto HV Monitor | 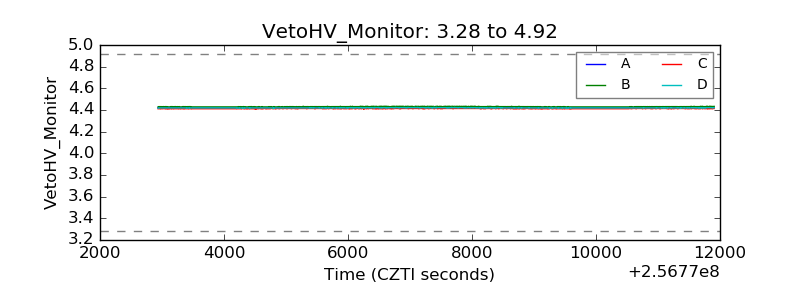 |
| Veto LLD | 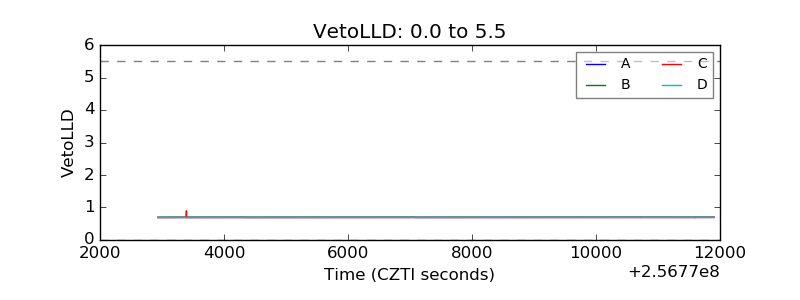 |
| Alpha Counter | 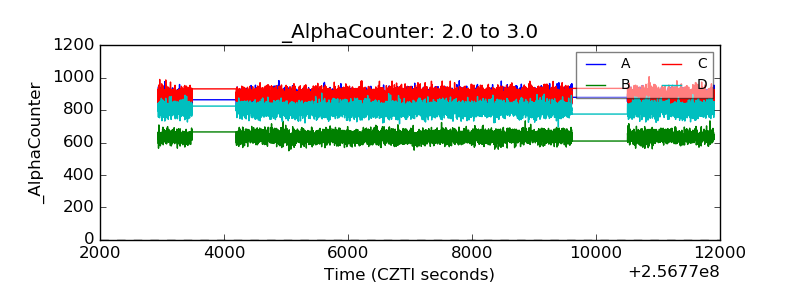 |
| _CPM_Rate | 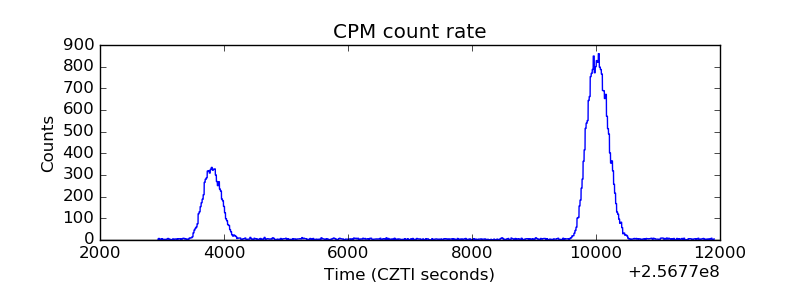 |
| CZT Counter | 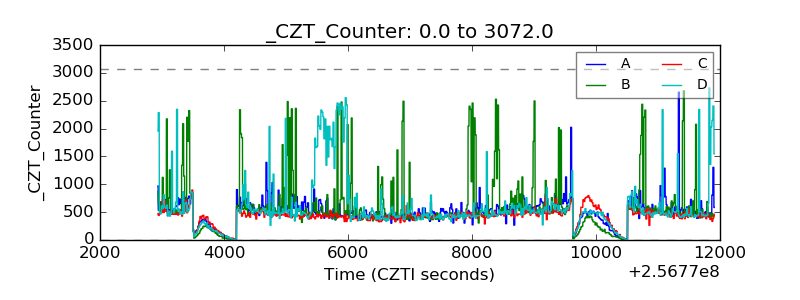 |
| +2.5 Volts monitor | 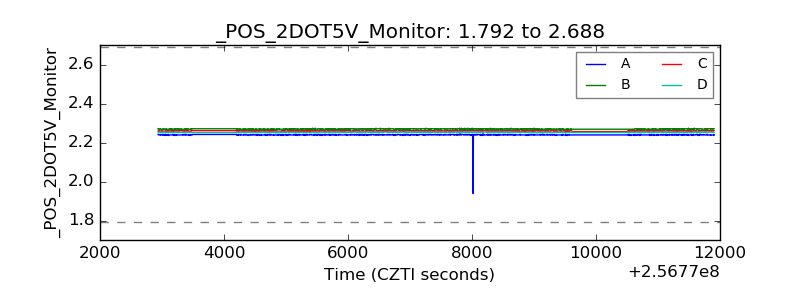 |
| +5 Volts monitor |  |
| _ROLL_ROT | 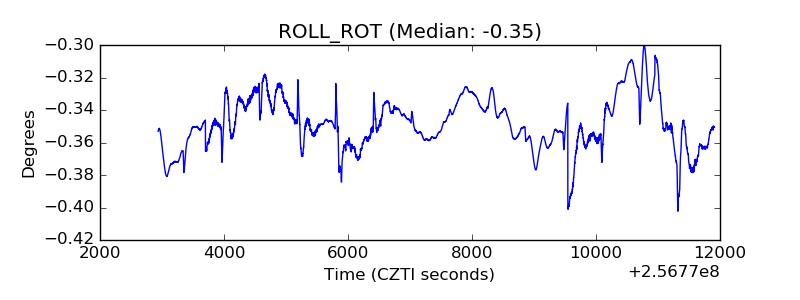 |
| _Roll_DEC | 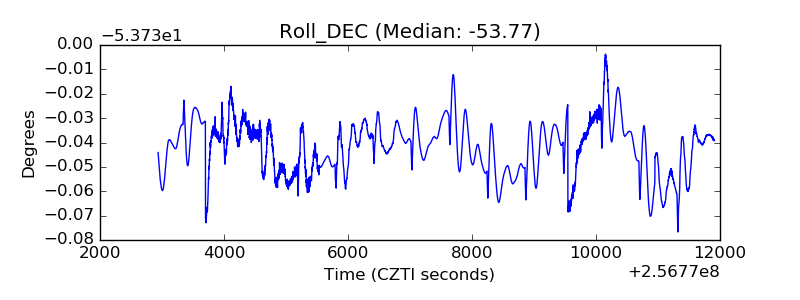 |
| _Roll_RA | 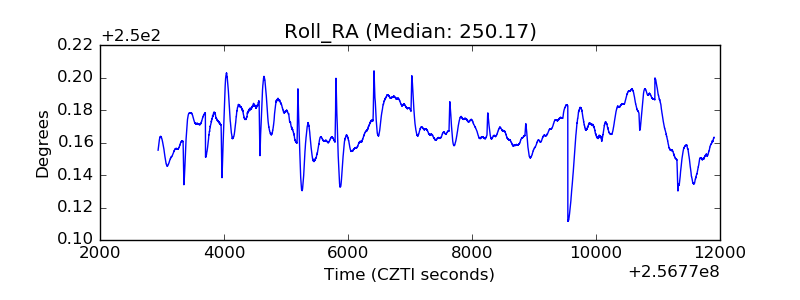 |
| Veto Counter | 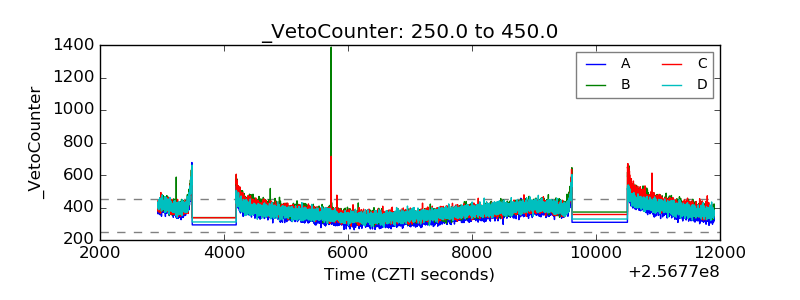 |