| Param | Original file | Final file |
|---|---|---|
| Filename | modeM0/AS1G08_033T01_9000001906_12964cztM0_level2.evt | modeM0/AS1G08_033T01_9000001906_12964cztM0_level2_quad_clean.evt |
| Size (bytes) | 544,377,600 | 98,311,680 |
| Size | 519.2 MB | 93.8 MB |
| Events in quadrant A | 4,079,118 | 637,626 |
| Events in quadrant B | 4,683,231 | 617,733 |
| Events in quadrant C | 3,072,613 | 648,920 |
| Events in quadrant D | 4,196,929 | 605,739 |
| Mode SS | |||
|---|---|---|---|
| Quadrant | BADHDUFLAG | Total packets | Discarded packets |
| A | 0 | 136 | 0 |
| B | 0 | 136 | 0 |
| C | 0 | 136 | 0 |
| D | 0 | 136 | 0 |
| Mode M0 | |||
|---|---|---|---|
| Quadrant | BADHDUFLAG | Total packets | Discarded packets |
| A | 0 | 16546 | 3 |
| B | 0 | 18413 | 2 |
| C | 0 | 13608 | 2 |
| D | 0 | 16962 | 2 |
| Mode M9 | |||
|---|---|---|---|
| Quadrant | BADHDUFLAG | Total packets | Discarded packets |
| A | 0 | 20 | 0 |
| B | 0 | 20 | 0 |
| C | 0 | 20 | 0 |
| D | 0 | 20 | 0 |
| Quadrant | Total seconds | Saturated seconds | Saturation percentage |
|---|---|---|---|
| A | 6707 | 153 | 2.281199% |
| B | 6707 | 708 | 10.556135% |
| C | 6707 | 20 | 0.298196% |
| D | 6707 | 174 | 2.594304% |
Noise dominated data is calculated using 1-second bins in cleaned event files. If a bin has >2000 counts, and if more than 50% of those come from <1% of pixels, then it is considered to be noise-dominated and hence unusable.
| Quadrant | # 1 sec bins | Bins with >0 counts | Bins with >2000 counts | High rate bins dominated by noise | Noise dominated (total time) | Noise dominated (detector-on time) | Marked lightcurve |
|---|---|---|---|---|---|---|---|
| A | 8653 | 6710 | 77 | 77 | 0.89% | 1.15% | 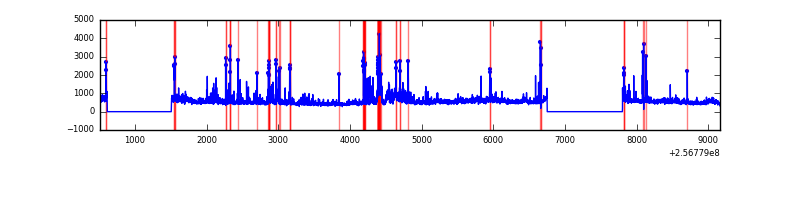 |
| B | 8653 | 6709 | 411 | 411 | 4.75% | 6.13% | 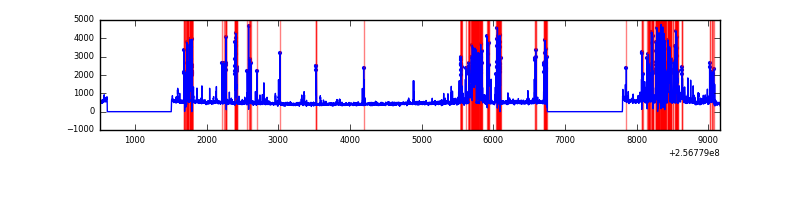 |
| C | 8653 | 6710 | 0 | 0 | 0.00% | 0.00% | 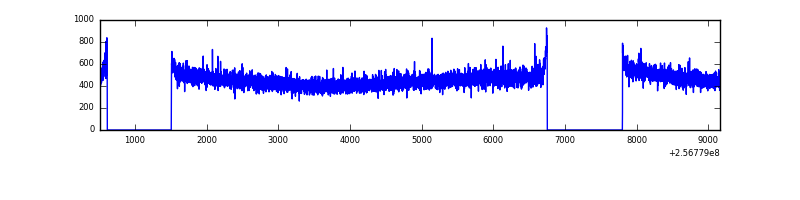 |
| D | 8653 | 6710 | 173 | 173 | 2.00% | 2.58% | 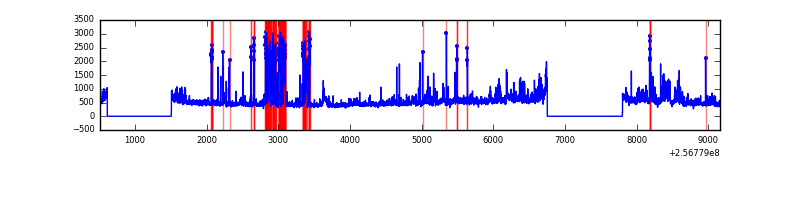 |
Top three noisy pixels from each quadrant. If the there are fewer than three noisy pixels in the level2.evt file, extra rows are filled as -1
| Pixel properties | Quadrant properties | ||||||
|---|---|---|---|---|---|---|---|
| Quadrant | DetID | PixID | Counts | Sigma | Mean | Median | Sigma |
| A | 15 | 223 | 389865 | 2395.14 | 791 | 772 | 162.5 |
| A | 12 | 189 | 209775 | 1286.56 | 791 | 772 | 162.5 |
| A | 15 | 239 | 157471 | 964.59 | 791 | 772 | 162.5 |
| B | 4 | 239 | 1122019 | 7849.53 | 751 | 732 | 142.8 |
| B | 3 | 64 | 500081 | 3495.68 | 751 | 732 | 142.8 |
| B | 0 | 85 | 78638 | 545.38 | 751 | 732 | 142.8 |
| C | 13 | 61 | 5641 | 26.55 | 787 | 790 | 182.7 |
| C | 0 | 207 | 2684 | 10.36 | 787 | 790 | 182.7 |
| C | 14 | 234 | 2346 | 8.52 | 787 | 790 | 182.7 |
| D | 1 | 52 | 581607 | 3101.5 | 775 | 753 | 187.3 |
| D | 8 | 195 | 347027 | 1848.95 | 775 | 753 | 187.3 |
| D | 13 | 122 | 195692 | 1040.89 | 775 | 753 | 187.3 |
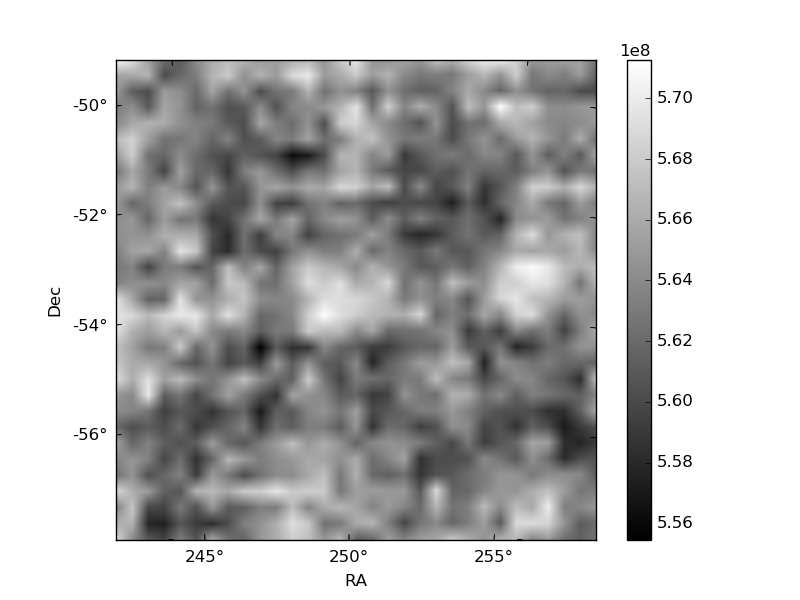
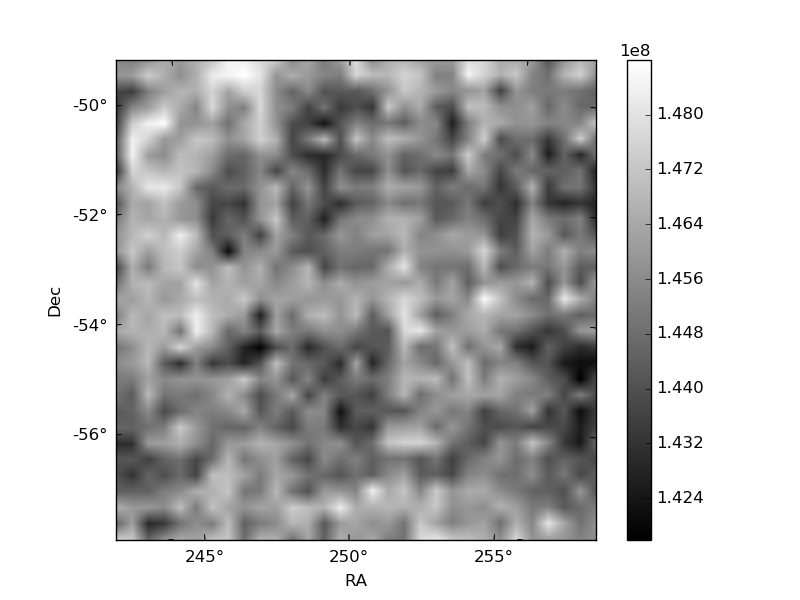
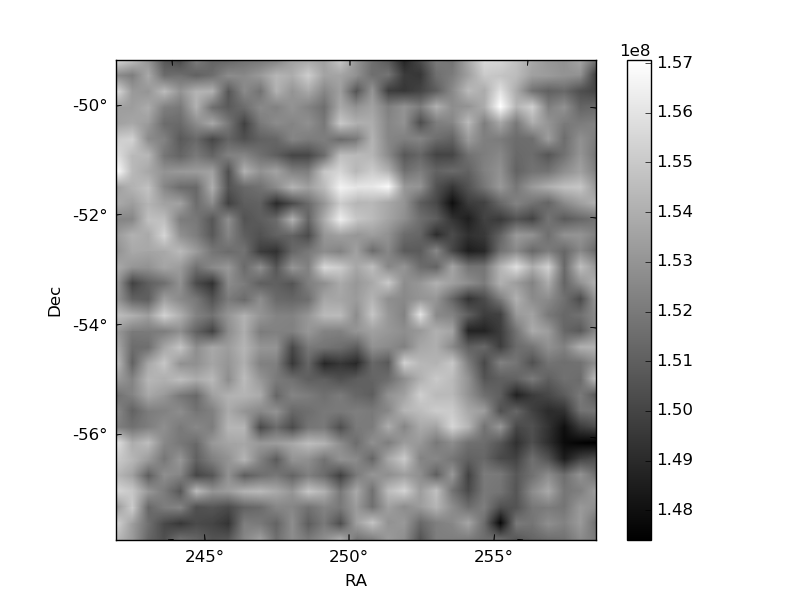
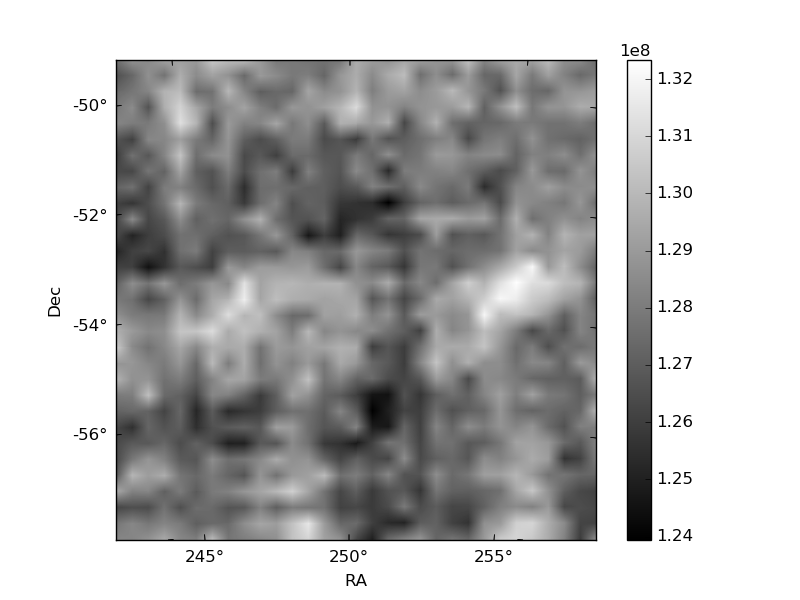
Histogram calculated using DETX and DETY for each event in the final _common_clean file
| Quadrant A | 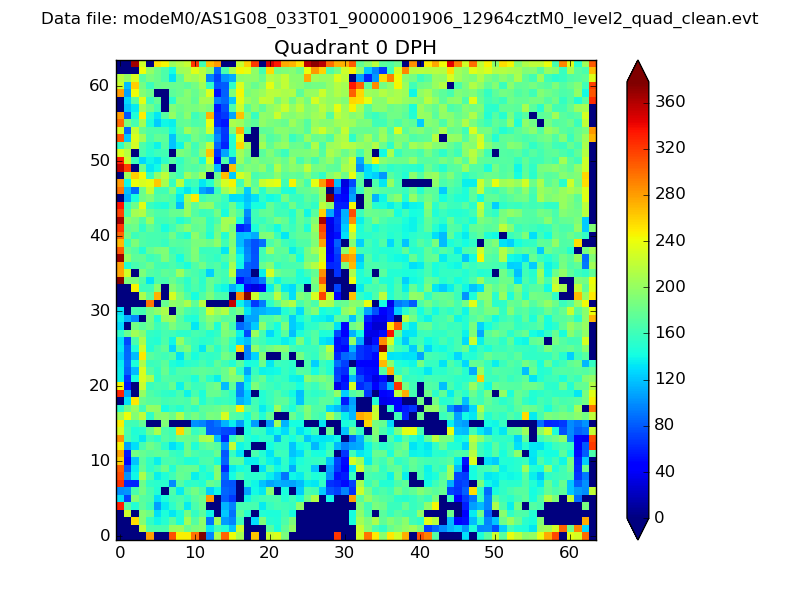 |
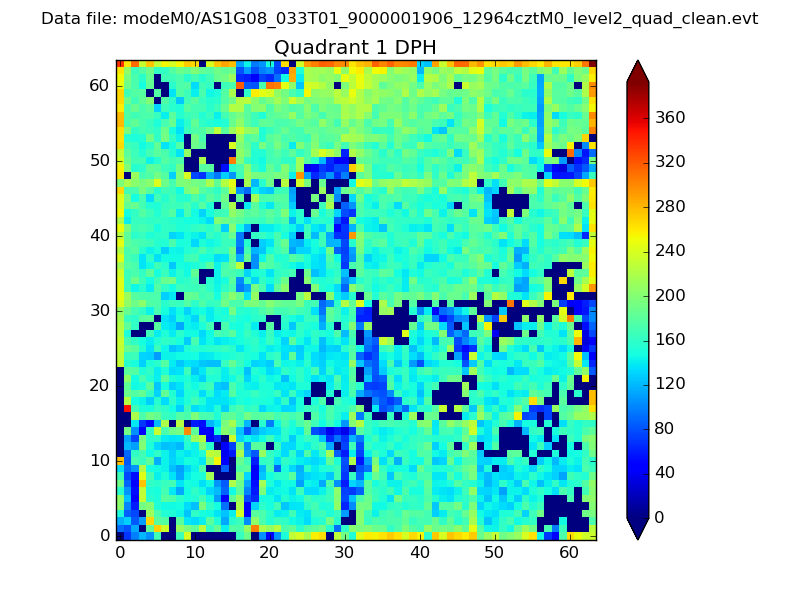 |
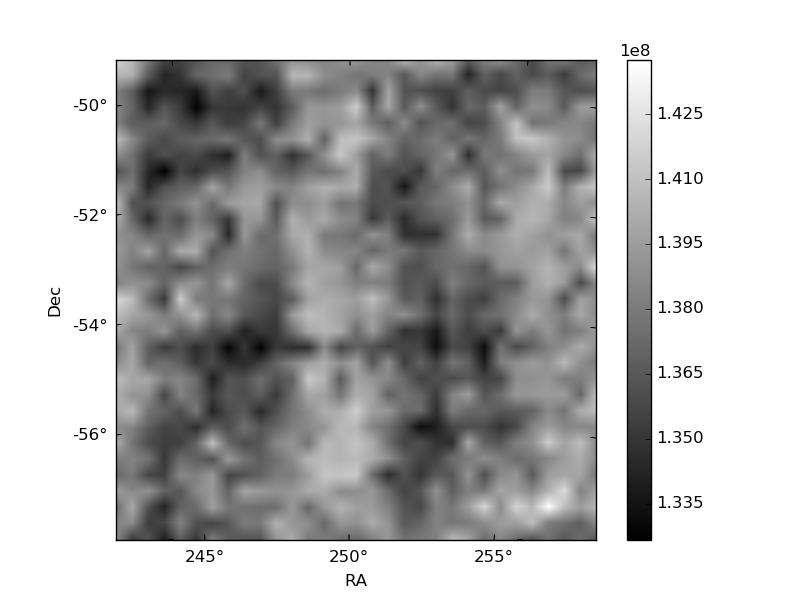
Quadrant B |
|---|---|---|---|
| Quadrant D | 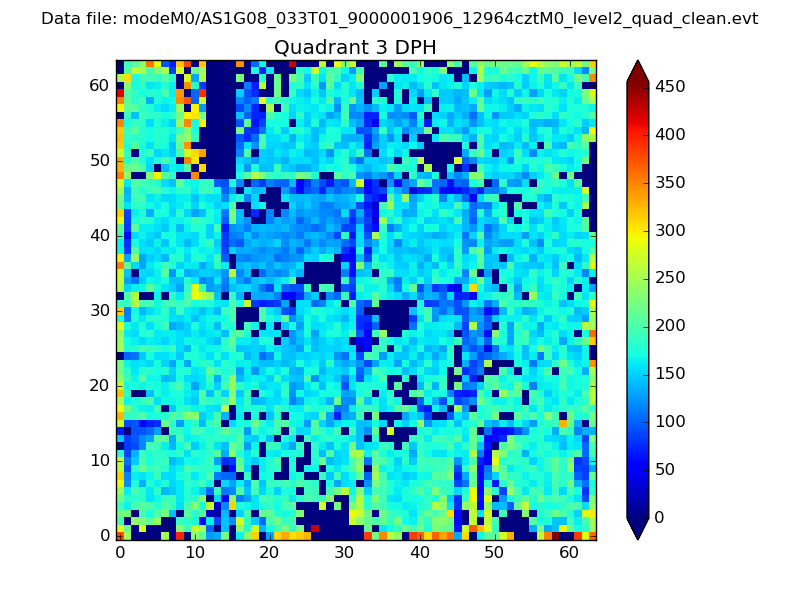 |
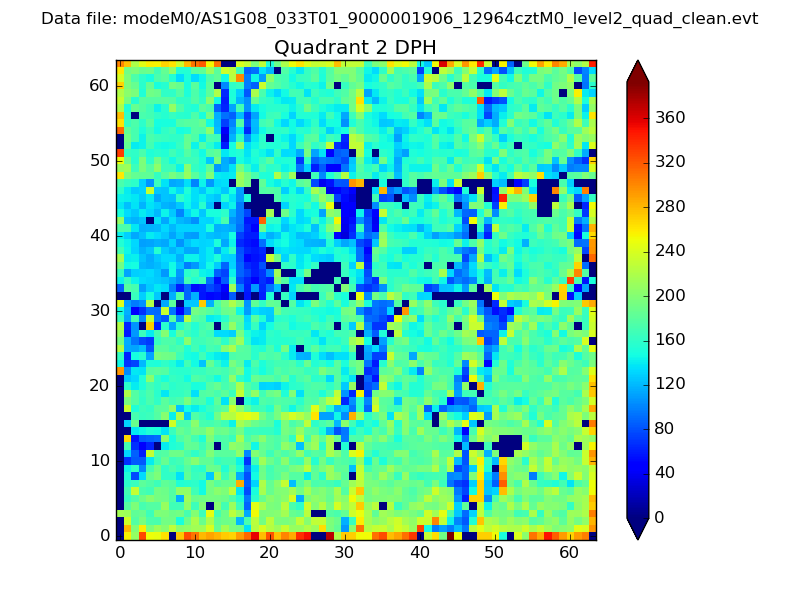 |
Quadrant C |
| Plot type | Count rate plots | Images |
|---|---|---|
| Comparison with Poisson distribution Blue bars denote a histogram of data divided into 1 sec bins. Red curve is a Poisson curve with rate = median count rate of data. |
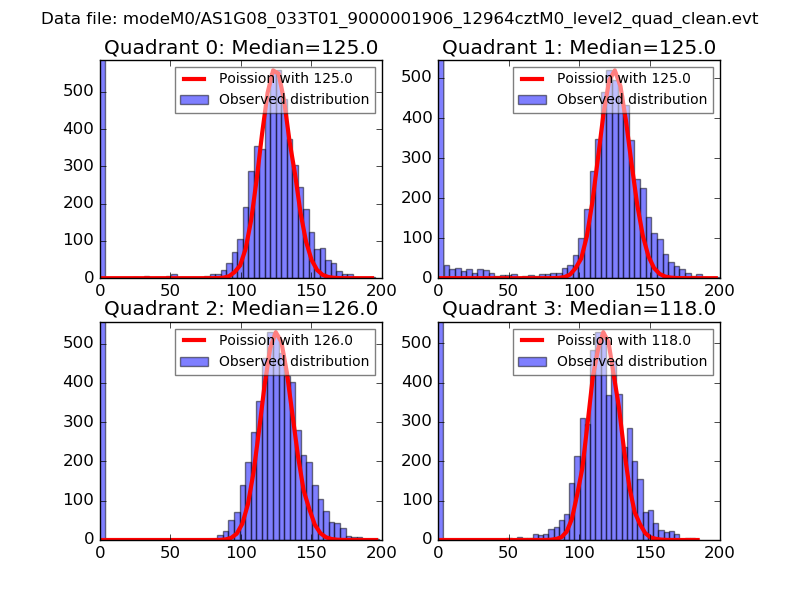 |
 |
| Quadrant-wise count rates Data is divided into 100 sec bins |
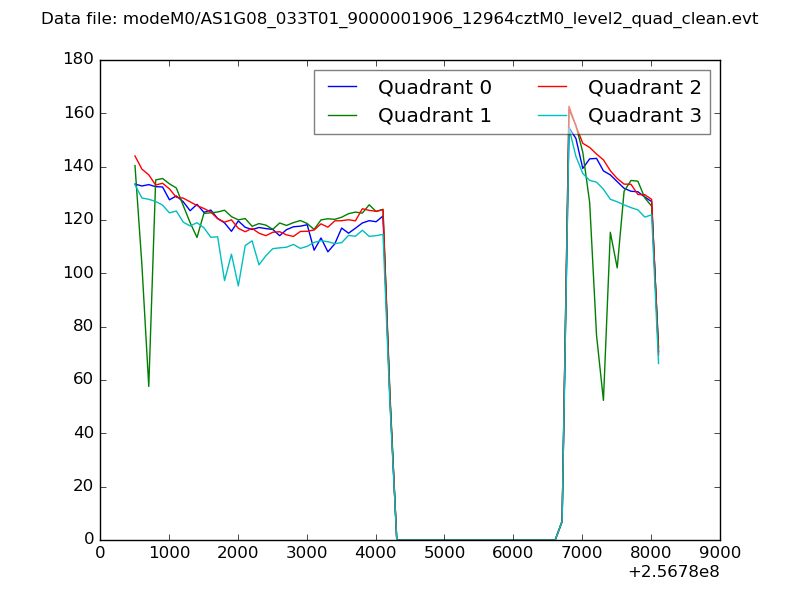 |
|
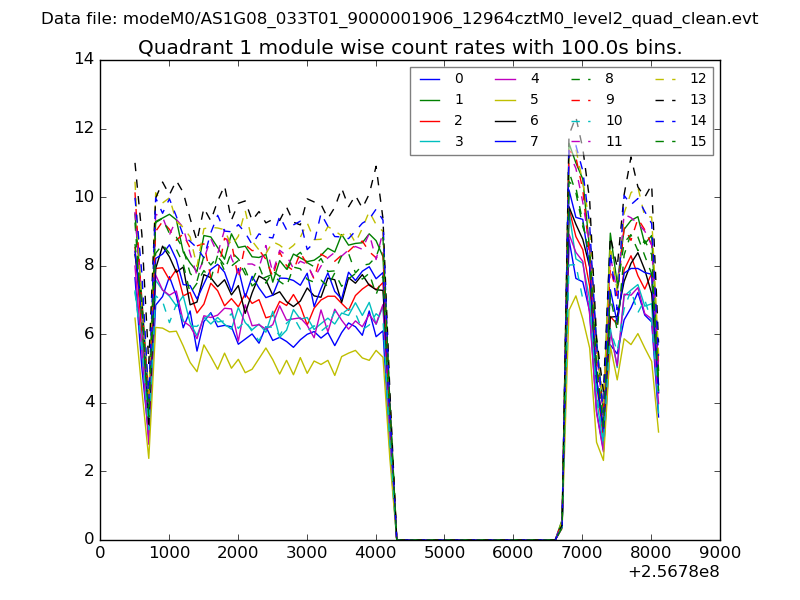
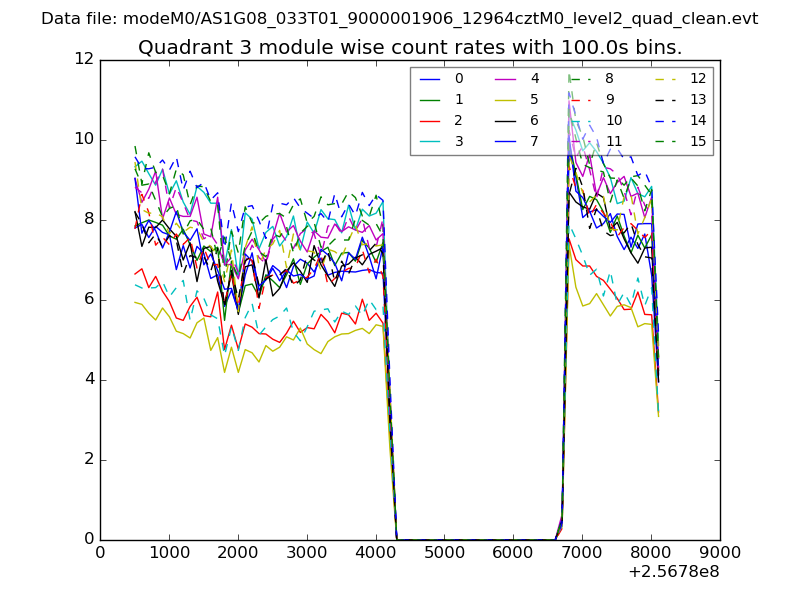
| Module-wise count rates for Quadrant A Data is divided into 100 sec bins |
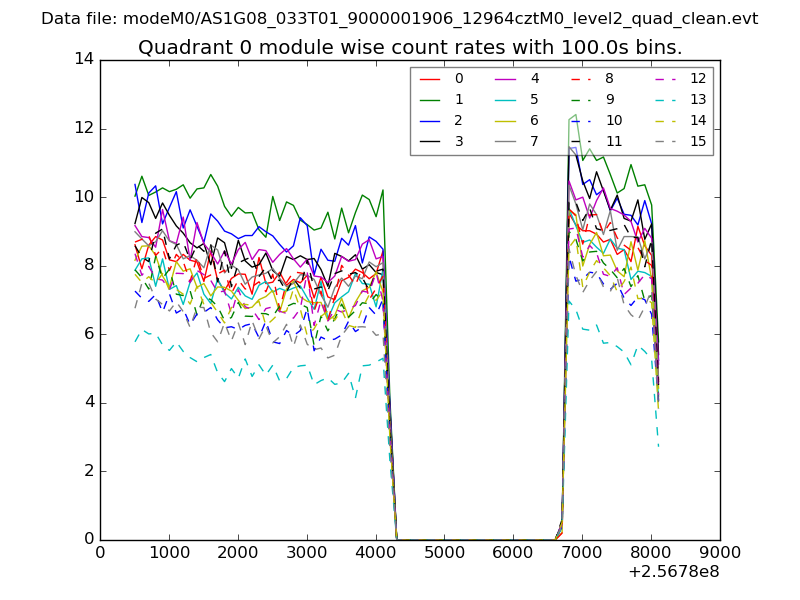 |
 |
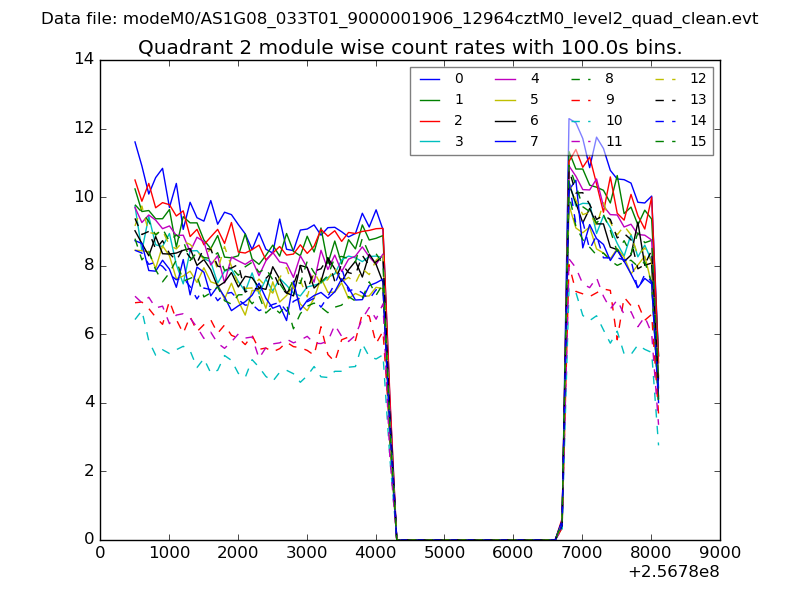
| Module-wise count rates for Quadrant B Data is divided into 100 sec bins |
 |
 |
| Module-wise count rates for Quadrant C Data is divided into 100 sec bins |
 |
 |
| Module-wise count rates for Quadrant D Data is divided into 100 sec bins |
 |
 |
| Parameter | Plot |
|---|---|
| CZT HV Monitor | 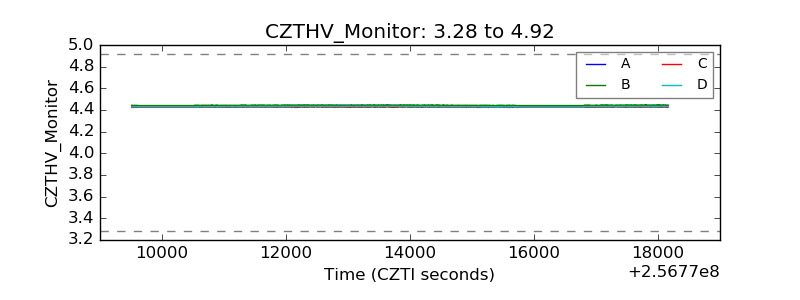 |
| D_VDD | 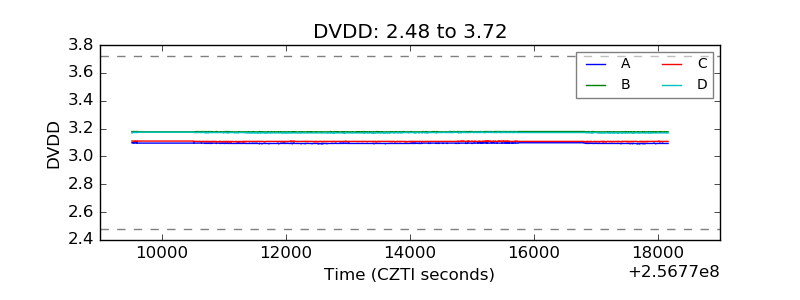 |
| Temperature 1 | 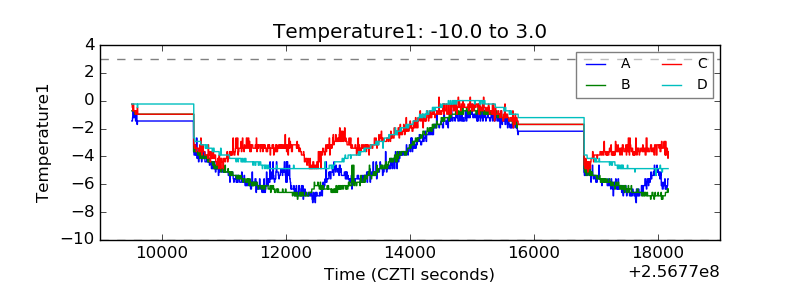 |
| Veto HV Monitor | 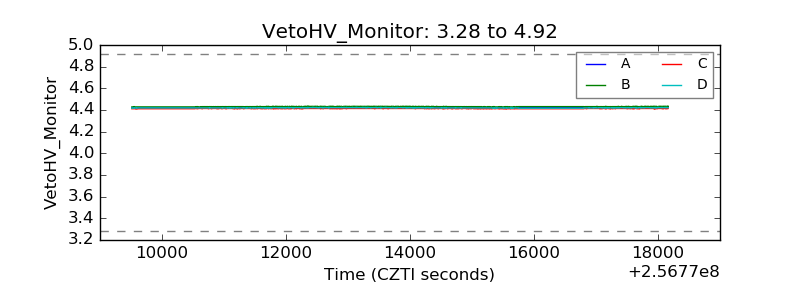 |
| Veto LLD | 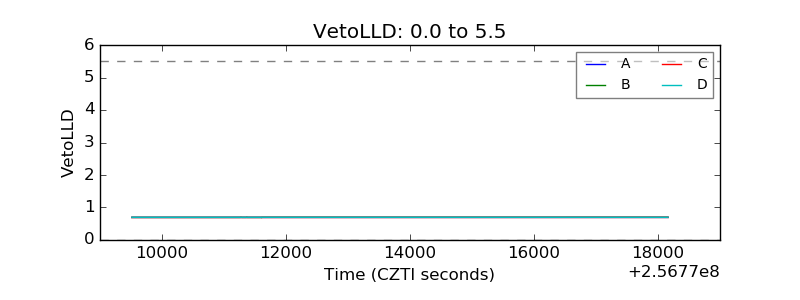 |
| Alpha Counter | 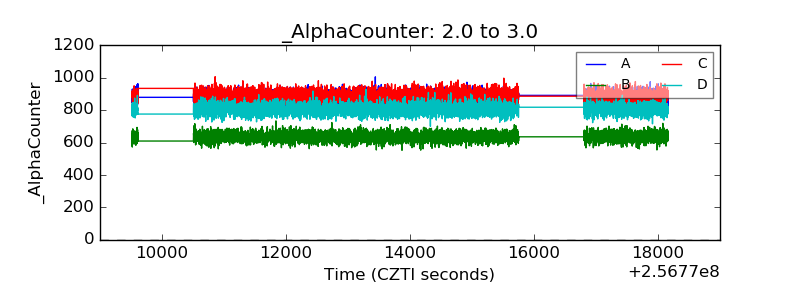 |
| _CPM_Rate | 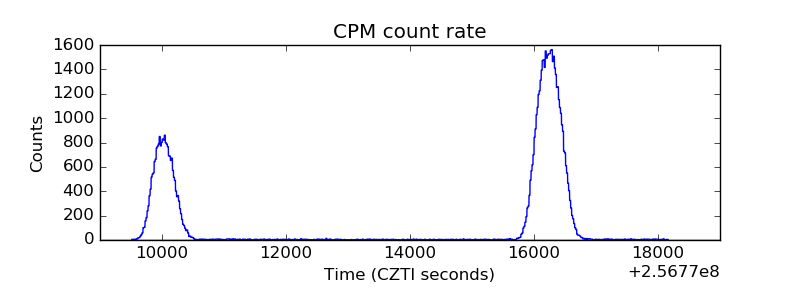 |
| CZT Counter | 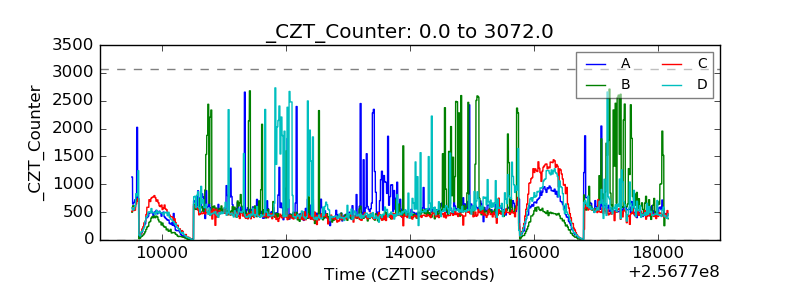 |
| +2.5 Volts monitor |  |
| +5 Volts monitor |  |
| _ROLL_ROT | 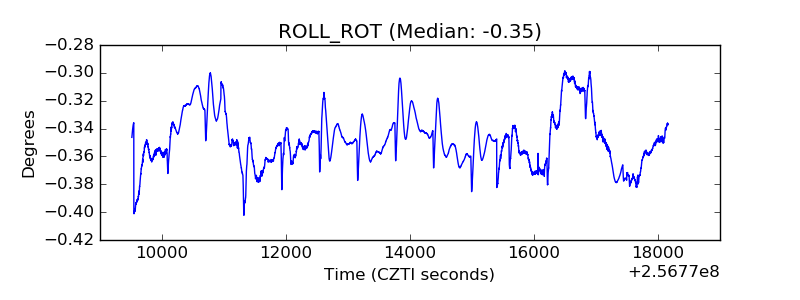 |
| _Roll_DEC | 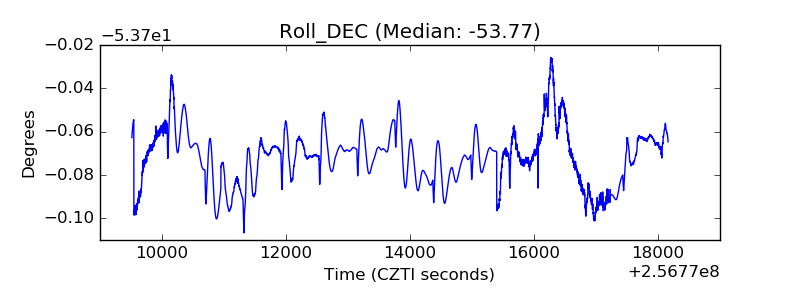 |
| _Roll_RA | 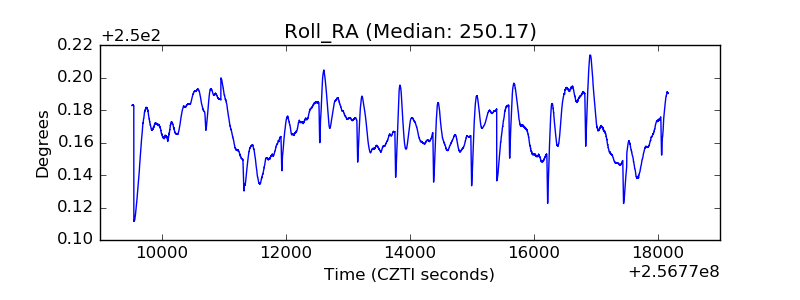 |
| Veto Counter | 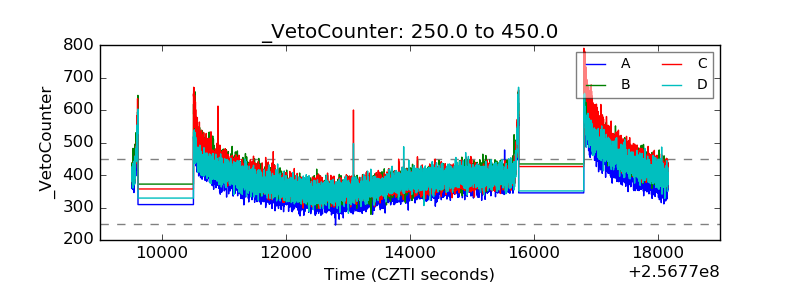 |