| Param | Original file | Final file |
|---|---|---|
| Filename | modeM0/AS1G08_033T01_9000001906_12966cztM0_level2.evt | modeM0/AS1G08_033T01_9000001906_12966cztM0_level2_quad_clean.evt |
| Size (bytes) | 251,305,920 | 61,752,960 |
| Size | 239.7 MB | 58.9 MB |
| Events in quadrant A | 1,648,081 | 419,121 |
| Events in quadrant B | 2,574,737 | 394,303 |
| Events in quadrant C | 1,477,623 | 425,595 |
| Events in quadrant D | 1,686,253 | 398,442 |
| Mode SS | |||
|---|---|---|---|
| Quadrant | BADHDUFLAG | Total packets | Discarded packets |
| A | 0 | 64 | 0 |
| B | 0 | 64 | 0 |
| C | 0 | 64 | 0 |
| D | 0 | 64 | 0 |
| Mode M0 | |||
|---|---|---|---|
| Quadrant | BADHDUFLAG | Total packets | Discarded packets |
| A | 0 | 7073 | 1 |
| B | 0 | 9869 | 1 |
| C | 0 | 6627 | 1 |
| D | 0 | 7310 | 1 |
| Mode M9 | |||
|---|---|---|---|
| Quadrant | BADHDUFLAG | Total packets | Discarded packets |
| A | 0 | 7 | 0 |
| B | 0 | 7 | 0 |
| C | 0 | 7 | 0 |
| D | 0 | 8 | 0 |
| Quadrant | Total seconds | Saturated seconds | Saturation percentage |
|---|---|---|---|
| A | 3276 | 19 | 0.579976% |
| B | 3276 | 350 | 10.683761% |
| C | 3276 | 2 | 0.061050% |
| D | 3276 | 15 | 0.457875% |
Noise dominated data is calculated using 1-second bins in cleaned event files. If a bin has >2000 counts, and if more than 50% of those come from <1% of pixels, then it is considered to be noise-dominated and hence unusable.
| Quadrant | # 1 sec bins | Bins with >0 counts | Bins with >2000 counts | High rate bins dominated by noise | Noise dominated (total time) | Noise dominated (detector-on time) | Marked lightcurve |
|---|---|---|---|---|---|---|---|
| A | 3278 | 3278 | 7 | 7 | 0.21% | 0.21% | 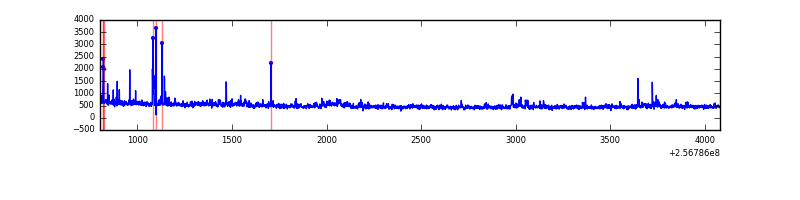 |
| B | 3278 | 3278 | 247 | 247 | 7.54% | 7.54% | 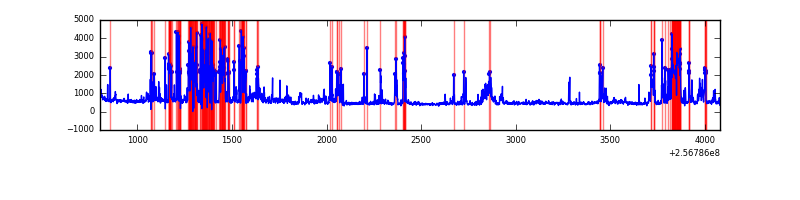 |
| C | 3278 | 3278 | 0 | 0 | 0.00% | 0.00% | 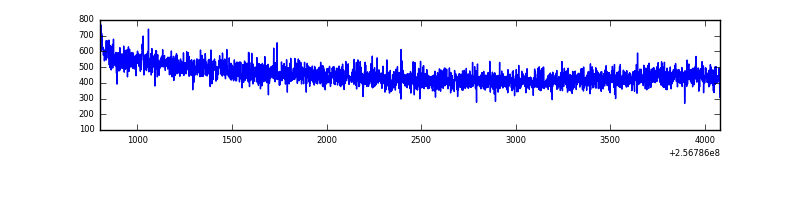 |
| D | 3278 | 3278 | 15 | 15 | 0.46% | 0.46% | 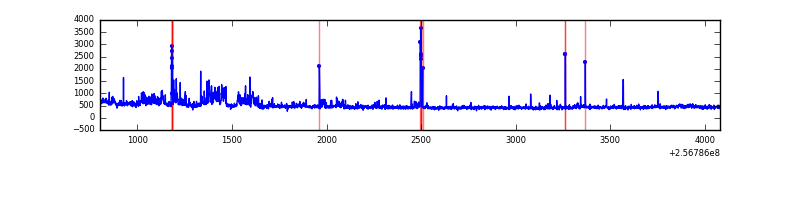 |
Top three noisy pixels from each quadrant. If the there are fewer than three noisy pixels in the level2.evt file, extra rows are filled as -1
| Pixel properties | Quadrant properties | ||||||
|---|---|---|---|---|---|---|---|
| Quadrant | DetID | PixID | Counts | Sigma | Mean | Median | Sigma |
| A | 12 | 189 | 85198 | 1102.91 | 374 | 366 | 76.9 |
| A | 1 | 162 | 33989 | 437.14 | 374 | 366 | 76.9 |
| A | 15 | 223 | 33664 | 432.91 | 374 | 366 | 76.9 |
| B | 4 | 239 | 615358 | 9092.12 | 353 | 345 | 67.6 |
| B | 3 | 64 | 392482 | 5797.21 | 353 | 345 | 67.6 |
| B | 0 | 85 | 141651 | 2089.01 | 353 | 345 | 67.6 |
| C | 13 | 61 | 2621 | 25.19 | 378 | 381 | 88.9 |
| C | 14 | 234 | 1229 | 9.54 | 378 | 381 | 88.9 |
| C | 8 | 222 | 1036 | 7.37 | 378 | 381 | 88.9 |
| D | 8 | 195 | 162414 | 1812.26 | 369 | 360 | 89.4 |
| D | 1 | 52 | 87792 | 977.76 | 369 | 360 | 89.4 |
| D | 13 | 122 | 15118 | 165.04 | 369 | 360 | 89.4 |
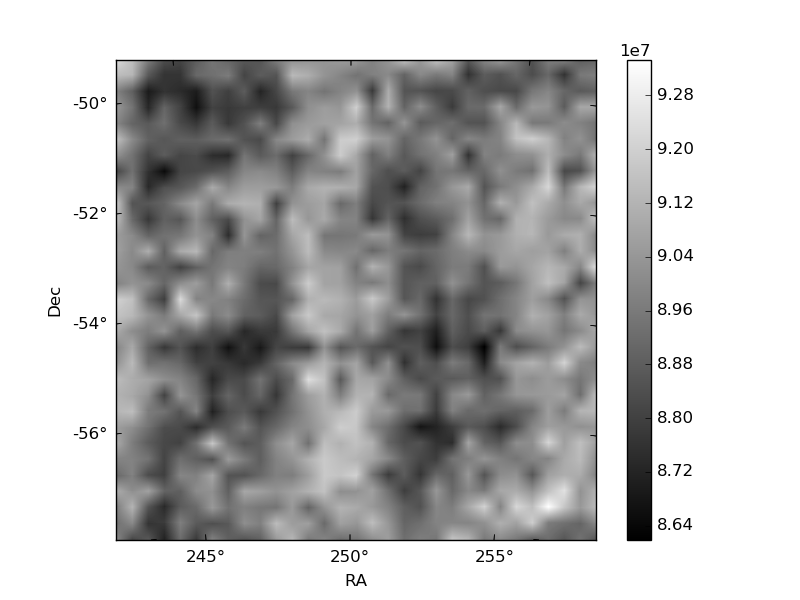
Histogram calculated using DETX and DETY for each event in the final _common_clean file
| Quadrant A | 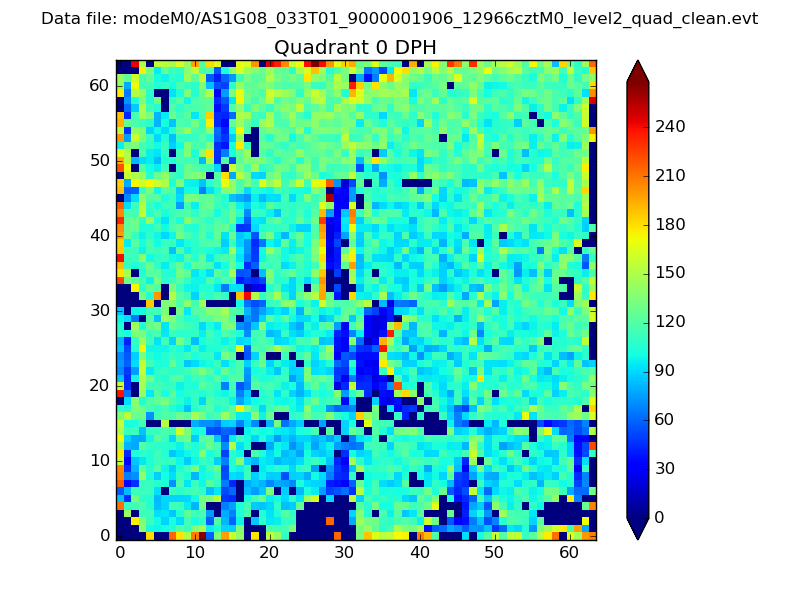 |
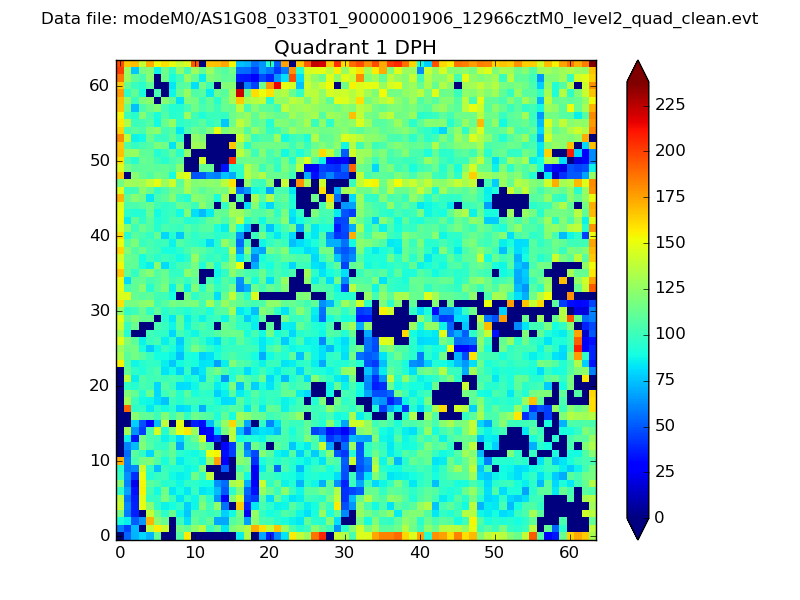 |
Quadrant B |
|---|---|---|---|
| Quadrant D | 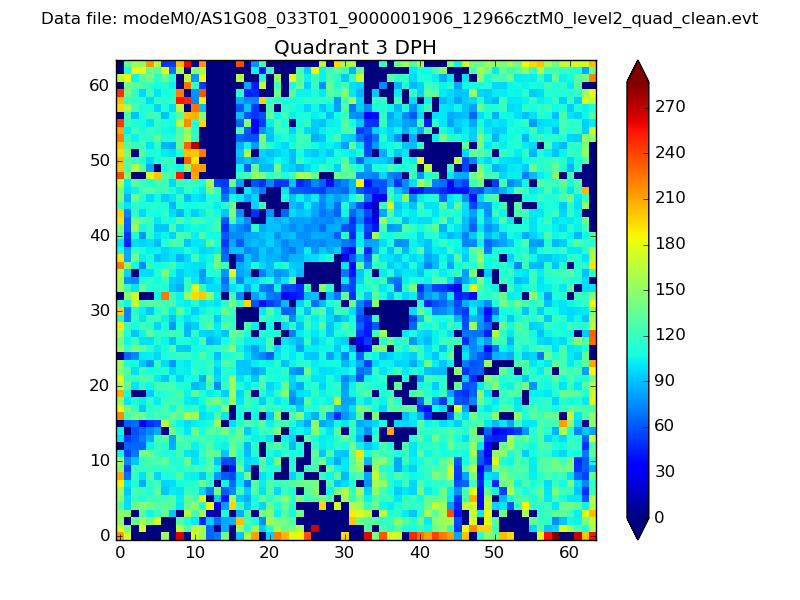 |
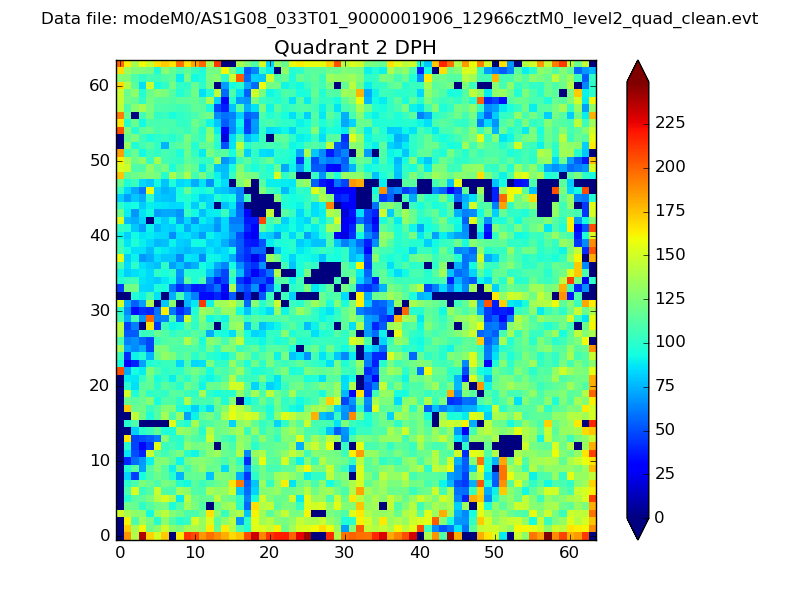 |
Quadrant C |
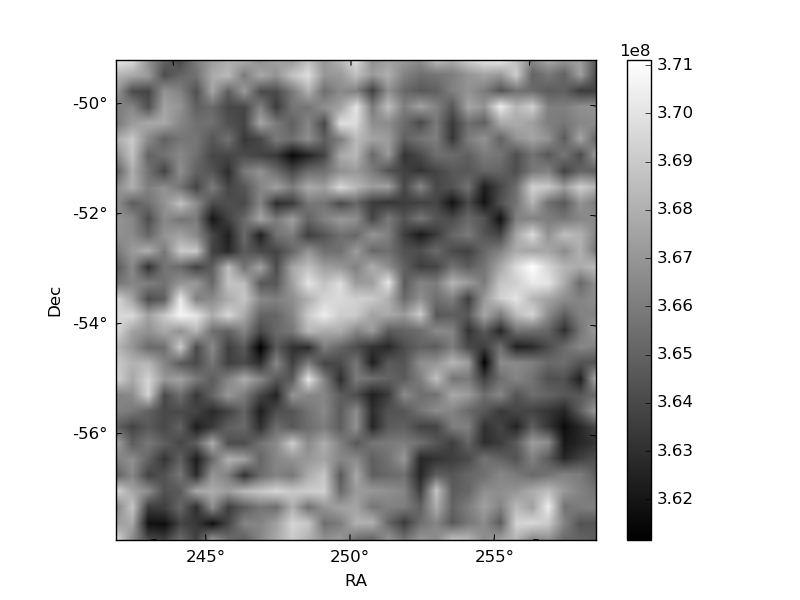
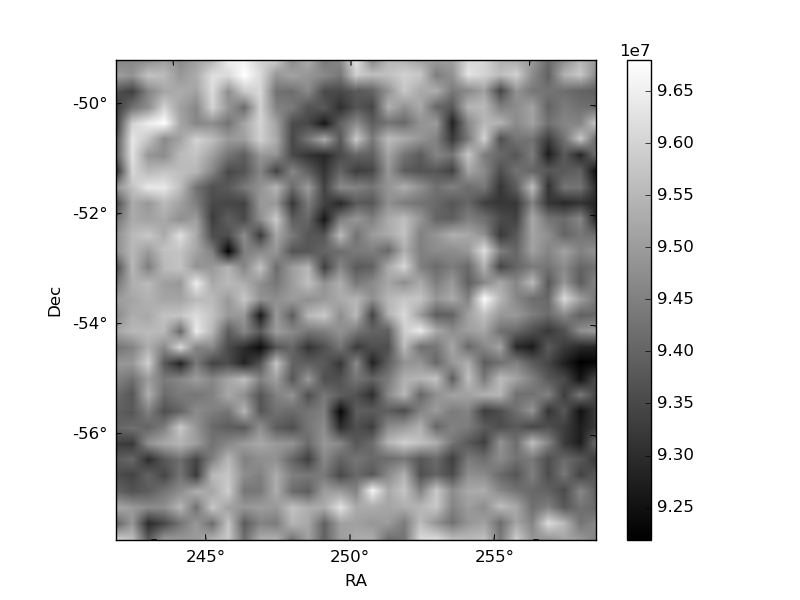
| Plot type | Count rate plots | Images |
|---|---|---|
| Comparison with Poisson distribution Blue bars denote a histogram of data divided into 1 sec bins. Red curve is a Poisson curve with rate = median count rate of data. |
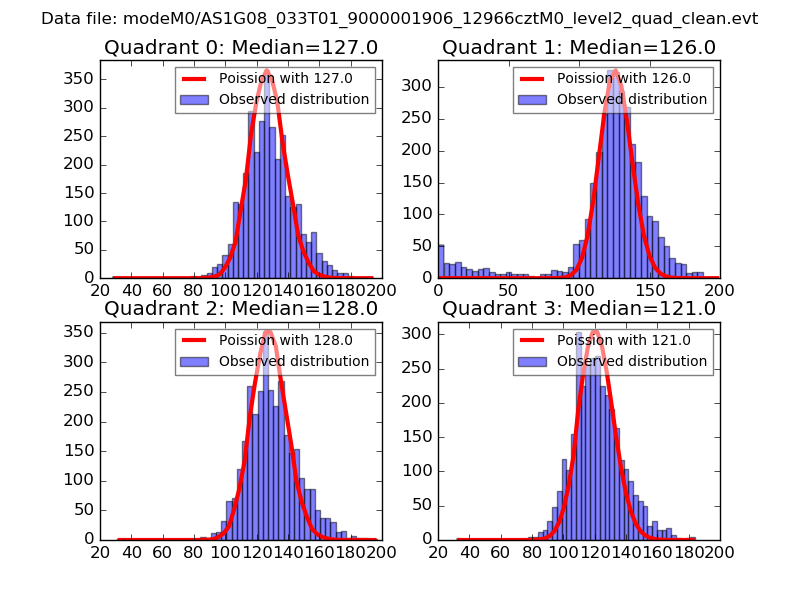 |
 |
| Quadrant-wise count rates Data is divided into 100 sec bins |
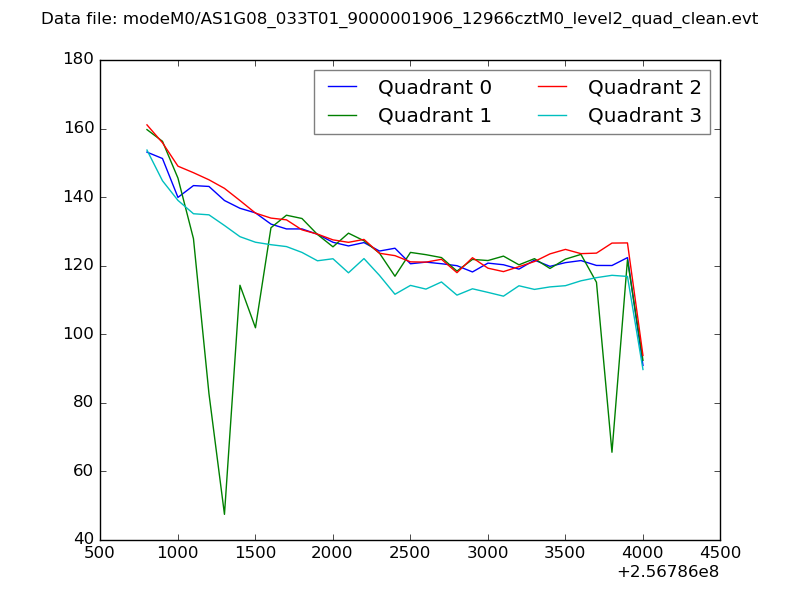 |
|
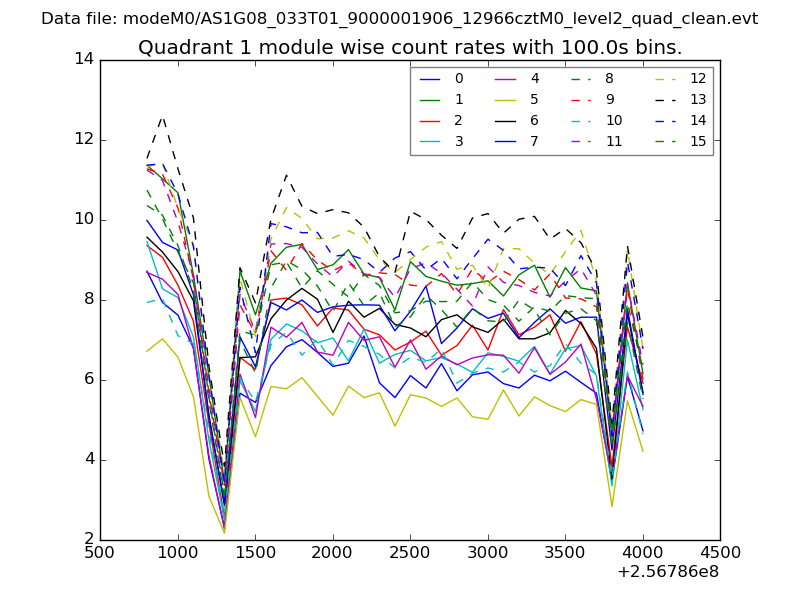
| Module-wise count rates for Quadrant A Data is divided into 100 sec bins |
 |
 |
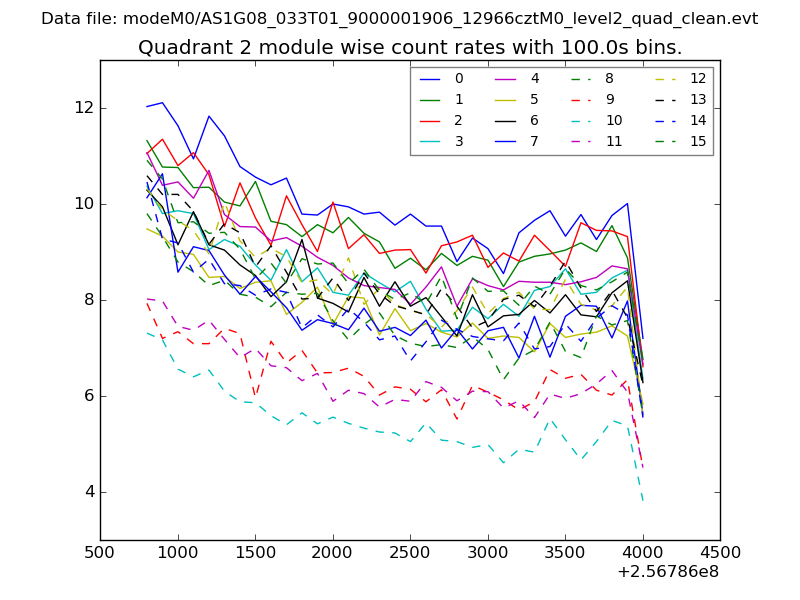
| Module-wise count rates for Quadrant B Data is divided into 100 sec bins |
 |
 |
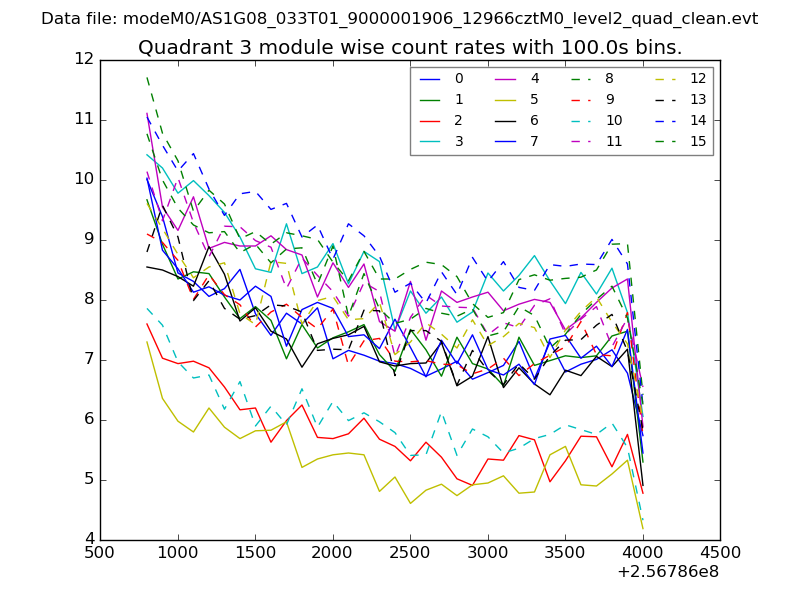
| Module-wise count rates for Quadrant C Data is divided into 100 sec bins |
 |
 |
| Module-wise count rates for Quadrant D Data is divided into 100 sec bins |
 |
 |
| Parameter | Plot |
|---|---|
| CZT HV Monitor | 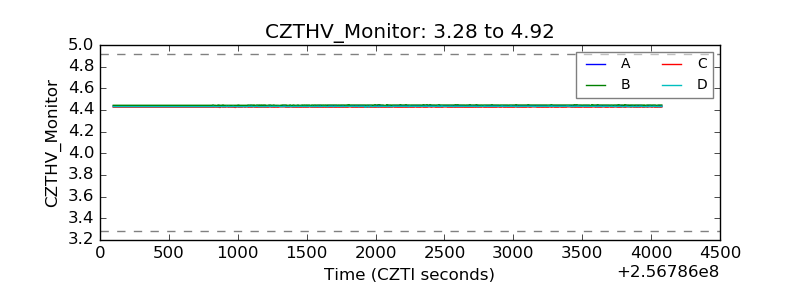 |
| D_VDD | 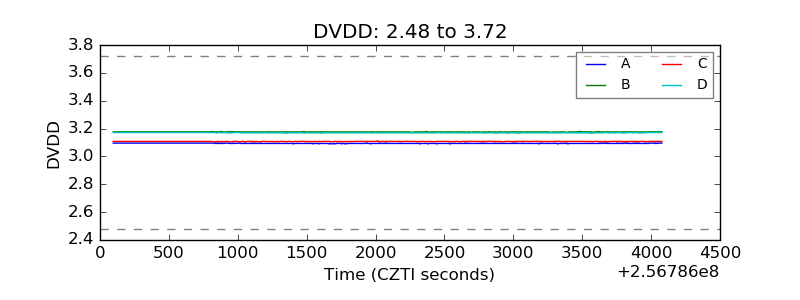 |
| Temperature 1 | 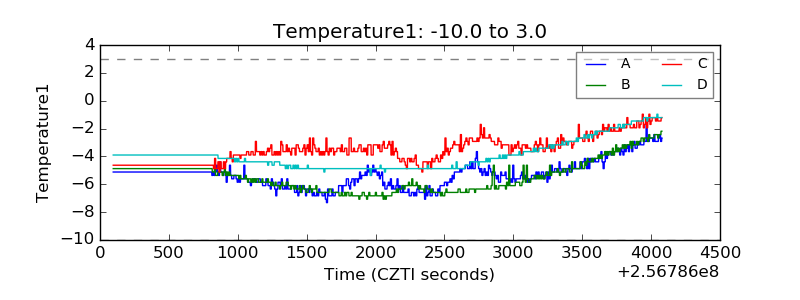 |
| Veto HV Monitor | 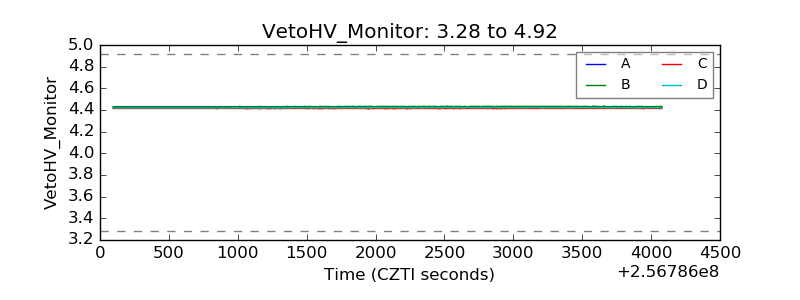 |
| Veto LLD |  |
| Alpha Counter | 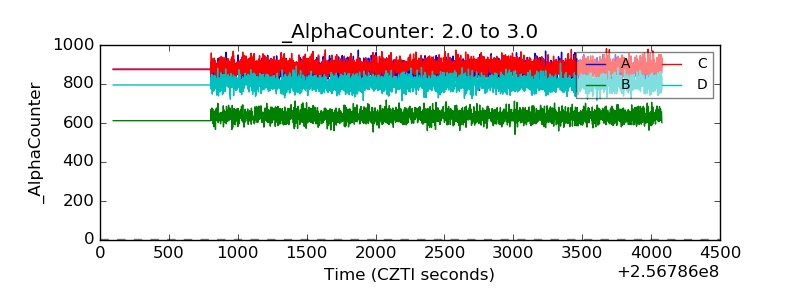 |
| _CPM_Rate | 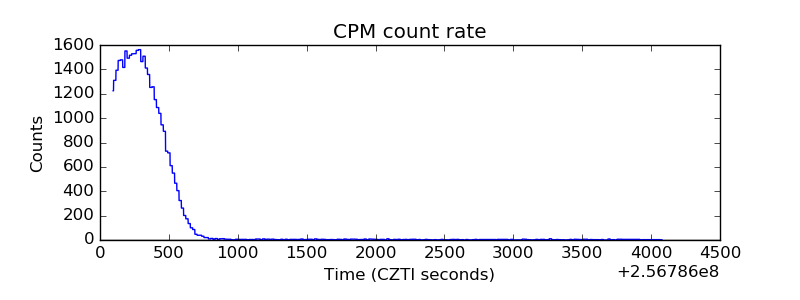 |
| CZT Counter | 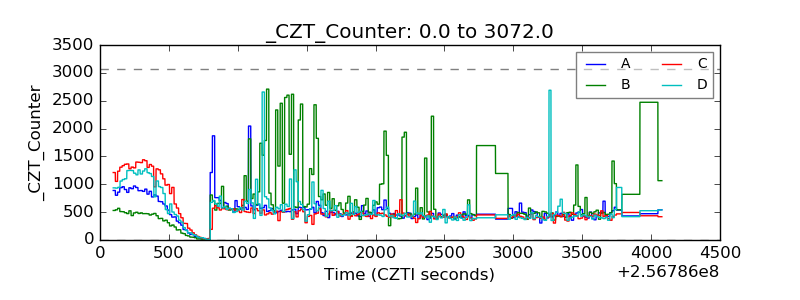 |
| +2.5 Volts monitor |  |
| +5 Volts monitor |  |
| _ROLL_ROT | 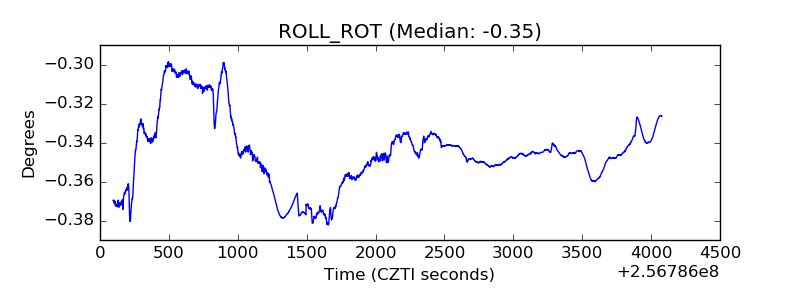 |
| _Roll_DEC | 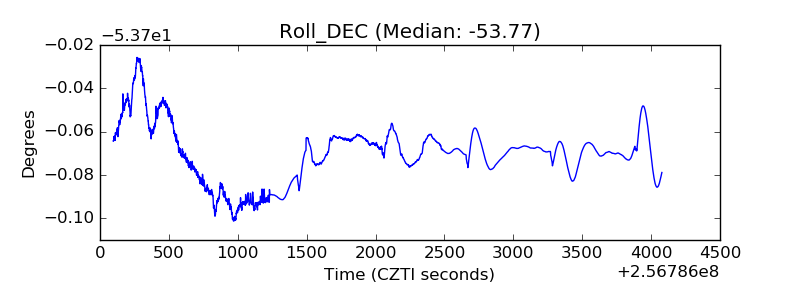 |
| _Roll_RA | 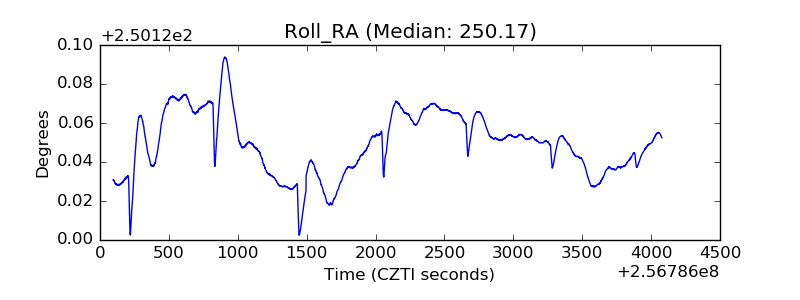 |
| Veto Counter | 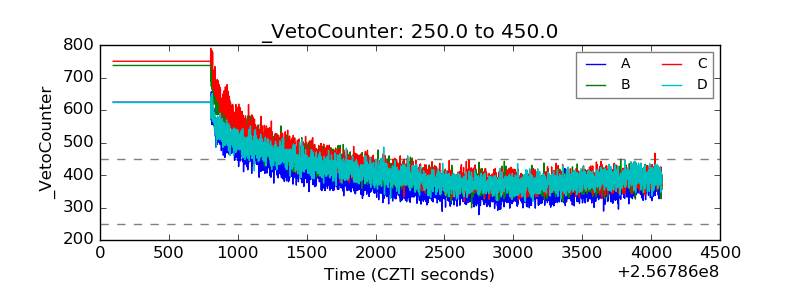 |