| Param | Original file | Final file |
|---|---|---|
| Filename | modeM0/AS1G08_035T01_9000001904cztM0_level2.fits | modeM0/AS1G08_035T01_9000001904cztM0_level2_quad_clean.evt |
| Size (bytes) | 185,595,840 | 185,040,000 |
| Size | 177.0 MB | 176.5 MB |
| Events in quadrant A | 1,121,864 | 1,116,735 |
| Events in quadrant B | 1,015,594 | 1,043,372 |
| Events in quadrant C | 1,123,846 | 1,068,353 |
| Events in quadrant D | 969,626 | 986,920 |
| Mode M0 | |||
|---|---|---|---|
| Quadrant | BADHDUFLAG | Total packets | Discarded packets |
| A | 0 | 47384 | 0 |
| B | 0 | 55268 | 0 |
| C | 0 | 42592 | 0 |
| D | 0 | 50122 | 0 |
| Mode M9 | |||
|---|---|---|---|
| Quadrant | BADHDUFLAG | Total packets | Discarded packets |
| A | 0 | 11 | 0 |
| B | 0 | 11 | 0 |
| C | 0 | 11 | 0 |
| D | 0 | 11 | 0 |
| Mode SS | |||
|---|---|---|---|
| Quadrant | BADHDUFLAG | Total packets | Discarded packets |
| A | 0 | 410 | 0 |
| B | 0 | 410 | 0 |
| C | 0 | 410 | 0 |
| D | 0 | 410 | 0 |
| Quadrant | Total seconds | Saturated seconds | Saturation percentage |
|---|---|---|---|
| A | 20152 | 899 | 4.461096% |
| B | 20152 | 2524 | 12.524811% |
| C | 20152 | 429 | 2.128821% |
| D | 20152 | 613 | 3.041882% |
Noise dominated data is calculated using 1-second bins in cleaned event files. If a bin has >2000 counts, and if more than 50% of those come from <1% of pixels, then it is considered to be noise-dominated and hence unusable.
| Quadrant | # 1 sec bins | Bins with >0 counts | Bins with >2000 counts | High rate bins dominated by noise | Noise dominated (total time) | Noise dominated (detector-on time) | Marked lightcurve |
|---|---|---|---|---|---|---|---|
| A | 21322 | 20150 | 0 | 0 | 0.00% | 0.00% | 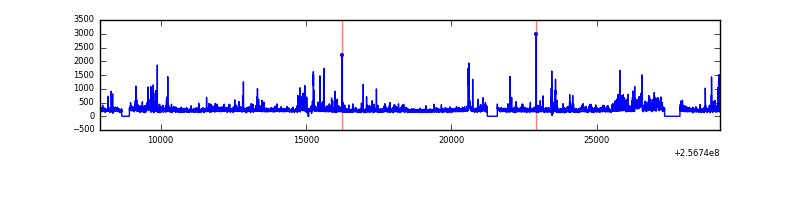 |
| B | 21322 | 19849 | 0 | 0 | 0.00% | 0.00% |  |
| C | 21322 | 20152 | 0 | 0 | 0.00% | 0.00% |  |
| D | 21322 | 20146 | 0 | 0 | 0.00% | 0.00% | 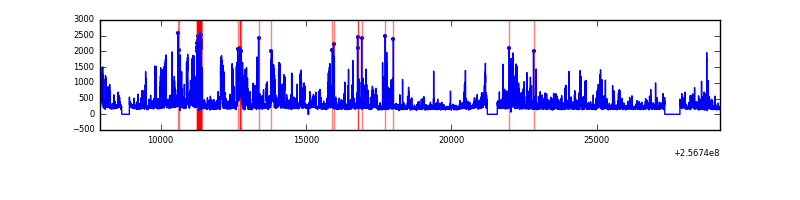 |
Top three noisy pixels from each quadrant. If the there are fewer than three noisy pixels in the level2.evt file, extra rows are filled as -1
| Pixel properties | Quadrant properties | ||||||
|---|---|---|---|---|---|---|---|
| Quadrant | DetID | PixID | Counts | Sigma | Mean | Median | Sigma |
| A | 0 | 29 | 1134 | 11.7 | 290 | 270 | 73.9 |
| A | 14 | 188 | 1105 | 11.3 | 290 | 270 | 73.9 |
| A | 14 | 204 | 933 | 8.97 | 290 | 270 | 73.9 |
| B | 2 | 9 | 884 | 11.01 | 268 | 253 | 57.3 |
| B | 3 | 17 | 716 | 8.08 | 268 | 253 | 57.3 |
| B | 14 | 254 | 687 | 7.57 | 268 | 253 | 57.3 |
| C | 2 | 191 | 794 | 6.62 | 297 | 274 | 78.5 |
| C | 12 | 241 | 791 | 6.59 | 297 | 274 | 78.5 |
| C | 7 | 111 | 758 | 6.16 | 297 | 274 | 78.5 |
| D | 7 | 5 | 709 | 6.05 | 276 | 250 | 75.9 |
| D | 1 | 19 | 686 | 5.75 | 276 | 250 | 75.9 |
| D | 7 | 3 | 669 | 5.52 | 276 | 250 | 75.9 |
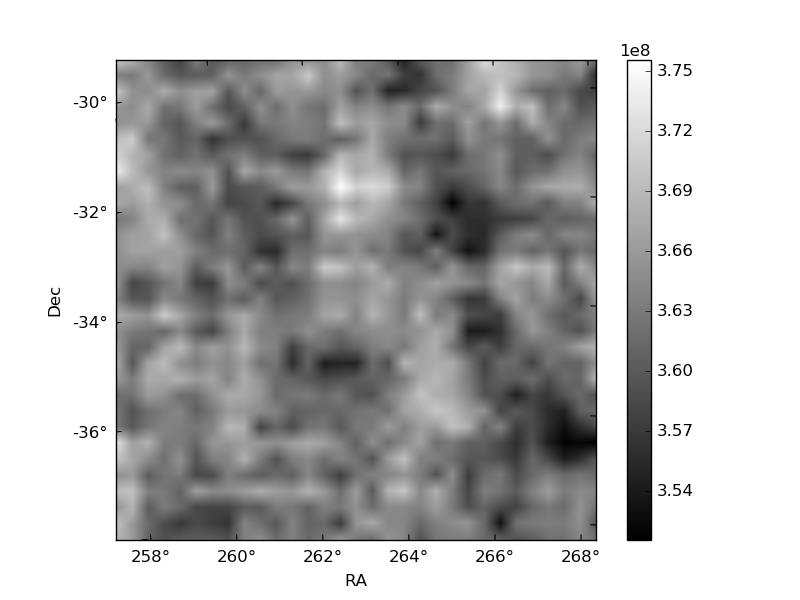
Histogram calculated using DETX and DETY for each event in the final _common_clean file
| Quadrant A |  |
 |
Quadrant B |
|---|---|---|---|
| Quadrant D | 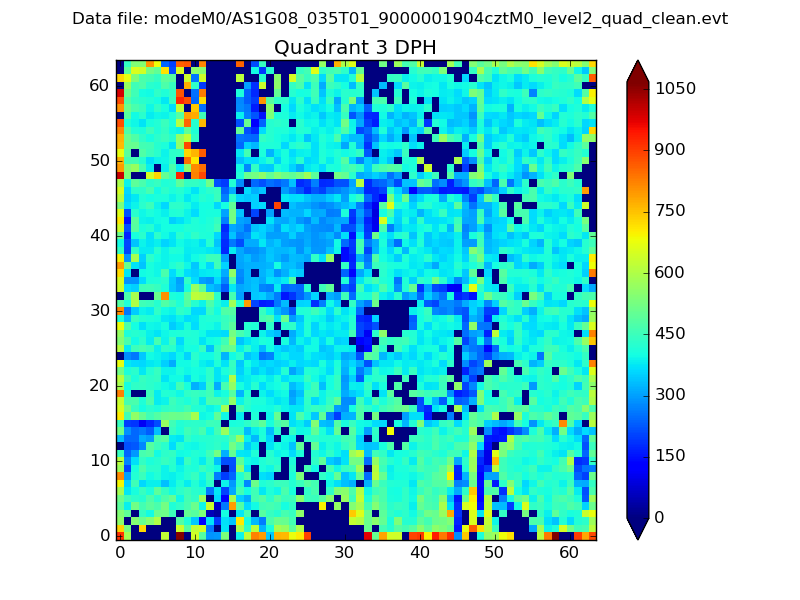 |
 |
Quadrant C |
| Plot type | Count rate plots | Images |
|---|---|---|
| Comparison with Poisson distribution Blue bars denote a histogram of data divided into 1 sec bins. Red curve is a Poisson curve with rate = median count rate of data. |
 |
 |
| Quadrant-wise count rates Data is divided into 100 sec bins |
 |
|
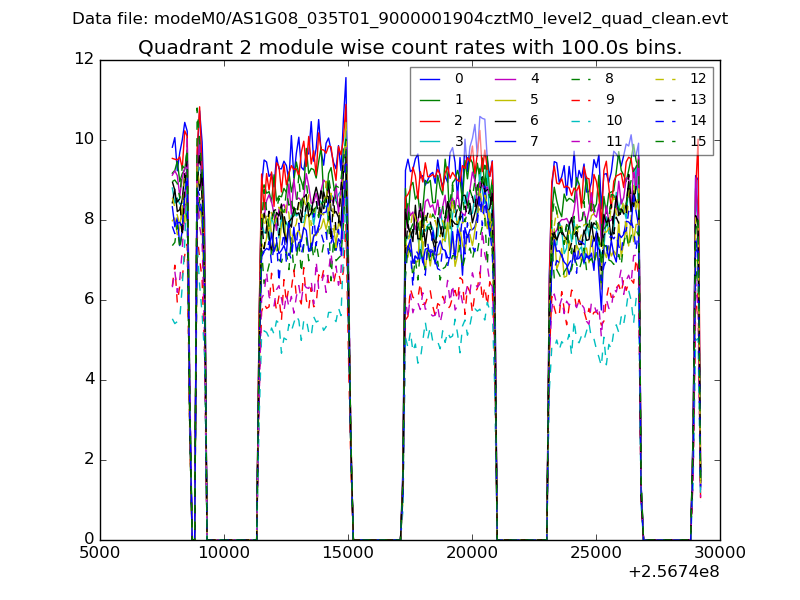
| Module-wise count rates for Quadrant A Data is divided into 100 sec bins |
 |
 |
| Module-wise count rates for Quadrant B Data is divided into 100 sec bins |
 |
 |
| Module-wise count rates for Quadrant C Data is divided into 100 sec bins |
 |
 |
| Module-wise count rates for Quadrant D Data is divided into 100 sec bins |
 |
 |
| Parameter | Plot |
|---|---|
| CZT HV Monitor |  |
| D_VDD |  |
| Temperature 1 |  |
| Veto HV Monitor |  |
| Veto LLD |  |
| Alpha Counter | 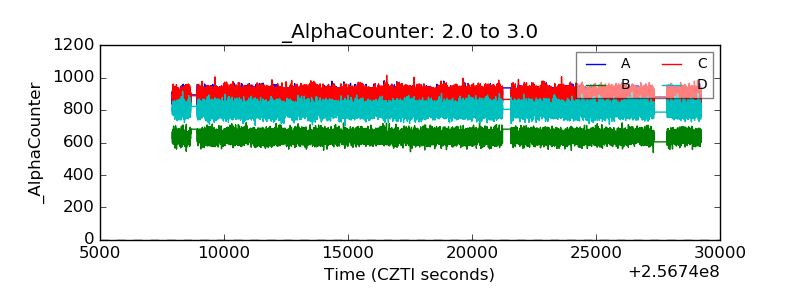 |
| _CPM_Rate | 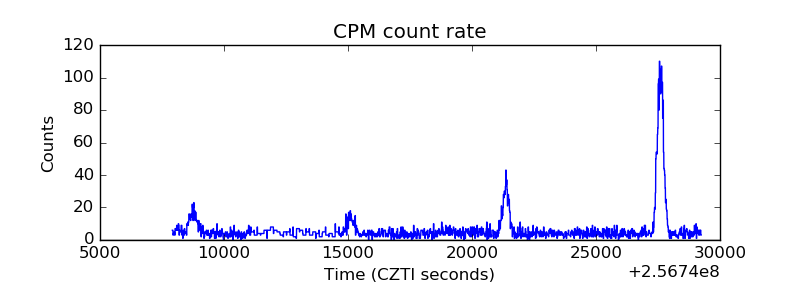 |
| CZT Counter | 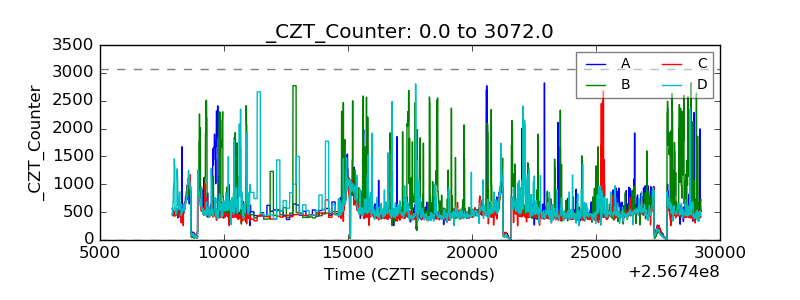 |
| +2.5 Volts monitor | 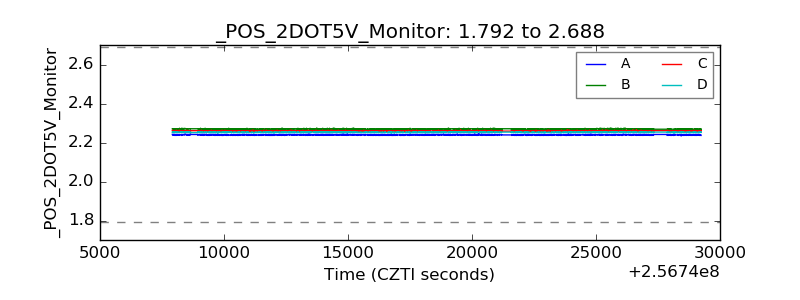 |
| +5 Volts monitor | 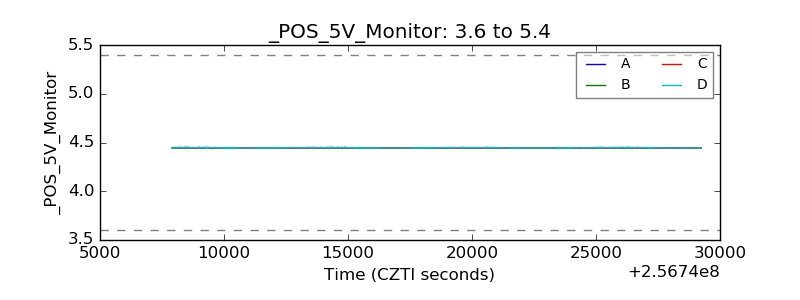 |
| _ROLL_ROT | 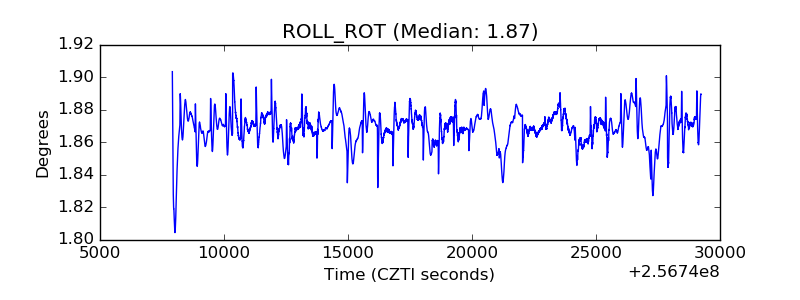 |
| _Roll_DEC |  |
| _Roll_RA |  |
| Veto Counter |  |