| Param | Original file | Final file |
|---|---|---|
| Filename | modeM0/AS1G08_035T01_9000001904_12958cztM0_level2.evt | modeM0/AS1G08_035T01_9000001904_12958cztM0_level2_quad_clean.evt |
| Size (bytes) | 225,984,960 | 24,949,440 |
| Size | 215.5 MB | 23.8 MB |
| Events in quadrant A | 1,769,250 | 145,635 |
| Events in quadrant B | 1,847,197 | 135,676 |
| Events in quadrant C | 1,304,521 | 151,954 |
| Events in quadrant D | 1,752,307 | 143,041 |
| Mode M0 | |||
|---|---|---|---|
| Quadrant | BADHDUFLAG | Total packets | Discarded packets |
| A | 0 | 6856 | 2 |
| B | 0 | 7075 | 1 |
| C | 0 | 5514 | 1 |
| D | 0 | 6847 | 1 |
| Mode M9 | |||
|---|---|---|---|
| Quadrant | BADHDUFLAG | Total packets | Discarded packets |
| A | 0 | 3 | 0 |
| B | 0 | 3 | 0 |
| C | 0 | 3 | 0 |
| D | 0 | 3 | 0 |
| Mode SS | |||
|---|---|---|---|
| Quadrant | BADHDUFLAG | Total packets | Discarded packets |
| A | 0 | 50 | 0 |
| B | 0 | 50 | 0 |
| C | 0 | 50 | 0 |
| D | 0 | 50 | 0 |
| Quadrant | Total seconds | Saturated seconds | Saturation percentage |
|---|---|---|---|
| A | 2488 | 339 | 13.625402% |
| B | 2488 | 450 | 18.086817% |
| C | 2488 | 128 | 5.144695% |
| D | 2488 | 163 | 6.551447% |
Noise dominated data is calculated using 1-second bins in cleaned event files. If a bin has >2000 counts, and if more than 50% of those come from <1% of pixels, then it is considered to be noise-dominated and hence unusable.
| Quadrant | # 1 sec bins | Bins with >0 counts | Bins with >2000 counts | High rate bins dominated by noise | Noise dominated (total time) | Noise dominated (detector-on time) | Marked lightcurve |
|---|---|---|---|---|---|---|---|
| A | 2754 | 2490 | 31 | 31 | 1.13% | 1.24% | 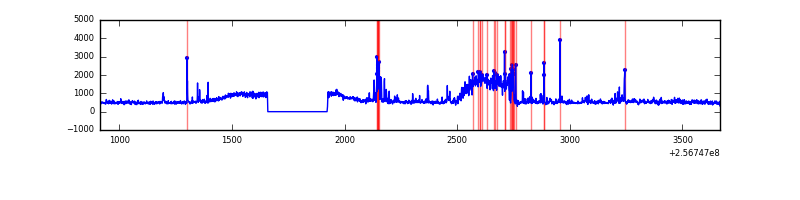 |
| B | 2754 | 2490 | 133 | 133 | 4.83% | 5.34% | 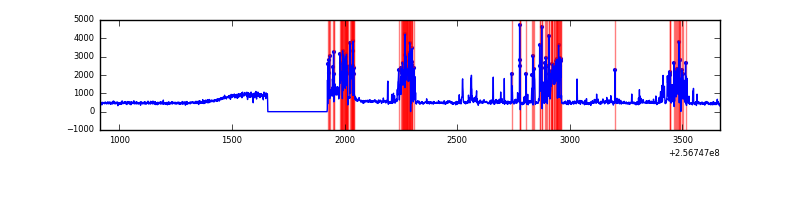 |
| C | 2754 | 2490 | 0 | 0 | 0.00% | 0.00% | 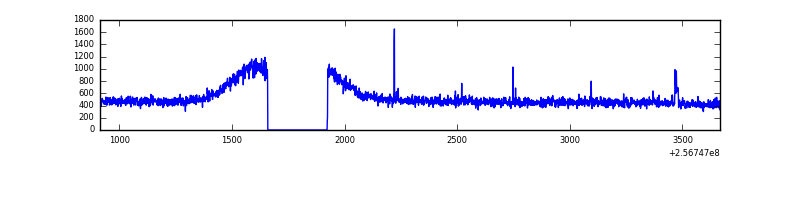 |
| D | 2754 | 2490 | 22 | 22 | 0.80% | 0.88% | 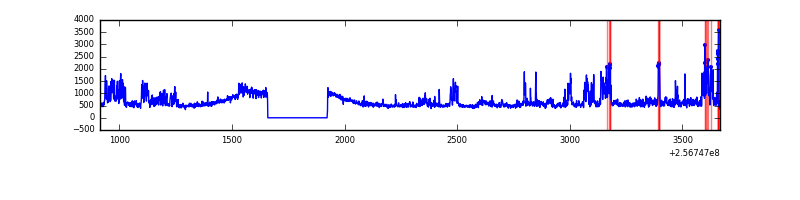 |
Top three noisy pixels from each quadrant. If the there are fewer than three noisy pixels in the level2.evt file, extra rows are filled as -1
| Pixel properties | Quadrant properties | ||||||
|---|---|---|---|---|---|---|---|
| Quadrant | DetID | PixID | Counts | Sigma | Mean | Median | Sigma |
| A | 15 | 223 | 163229 | 2285.36 | 336 | 327 | 71.3 |
| A | 15 | 239 | 107192 | 1499.21 | 336 | 327 | 71.3 |
| A | 15 | 255 | 60322 | 841.67 | 336 | 327 | 71.3 |
| B | 4 | 239 | 547176 | 8572.28 | 310 | 302 | 63.8 |
| B | 3 | 64 | 53740 | 837.64 | 310 | 302 | 63.8 |
| B | 0 | 85 | 10406 | 158.38 | 310 | 302 | 63.8 |
| C | 0 | 207 | 8147 | 98.33 | 332 | 333 | 79.5 |
| C | 14 | 234 | 2681 | 29.55 | 332 | 333 | 79.5 |
| C | 13 | 61 | 2425 | 26.33 | 332 | 333 | 79.5 |
| D | 8 | 195 | 423539 | 5080.96 | 333 | 324 | 83.3 |
| D | 1 | 52 | 56806 | 678.1 | 333 | 324 | 83.3 |
| D | 2 | 234 | 9727 | 112.89 | 333 | 324 | 83.3 |
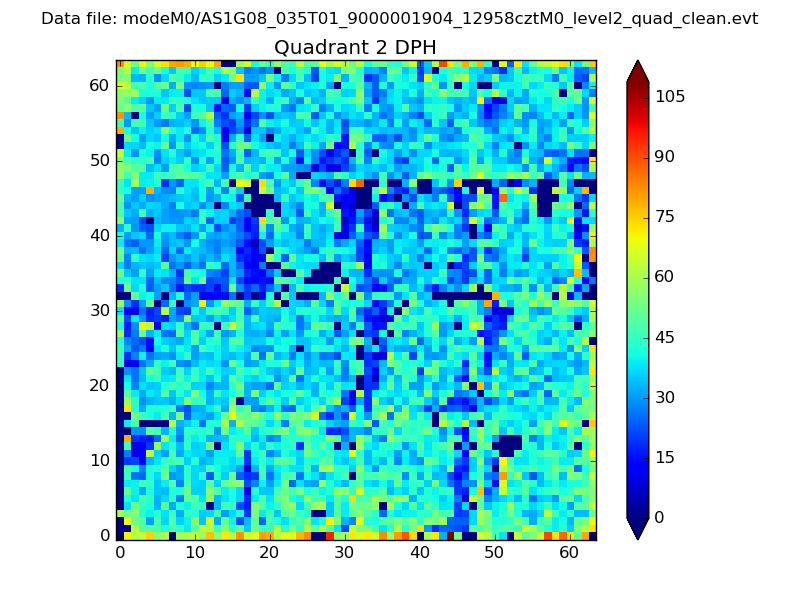
Histogram calculated using DETX and DETY for each event in the final _common_clean file
| Quadrant A | 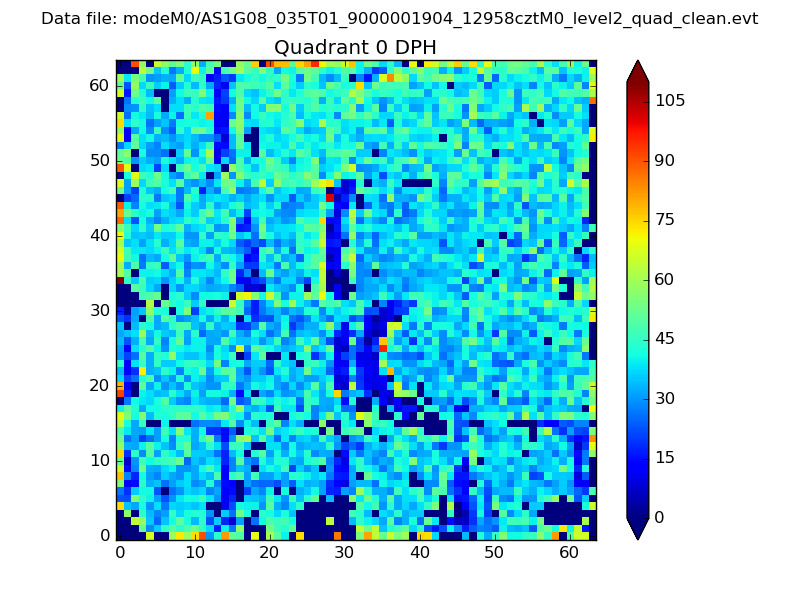 |
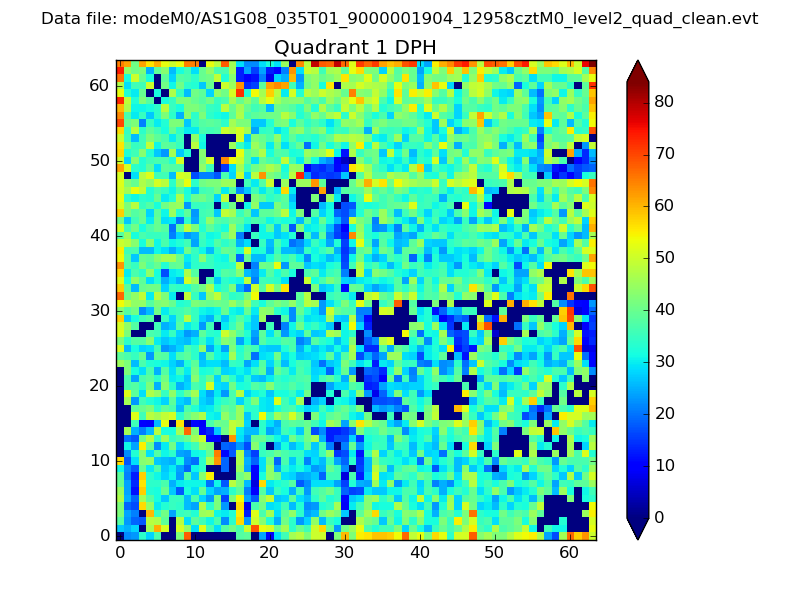 |
Quadrant B |
|---|---|---|---|
| Quadrant D | 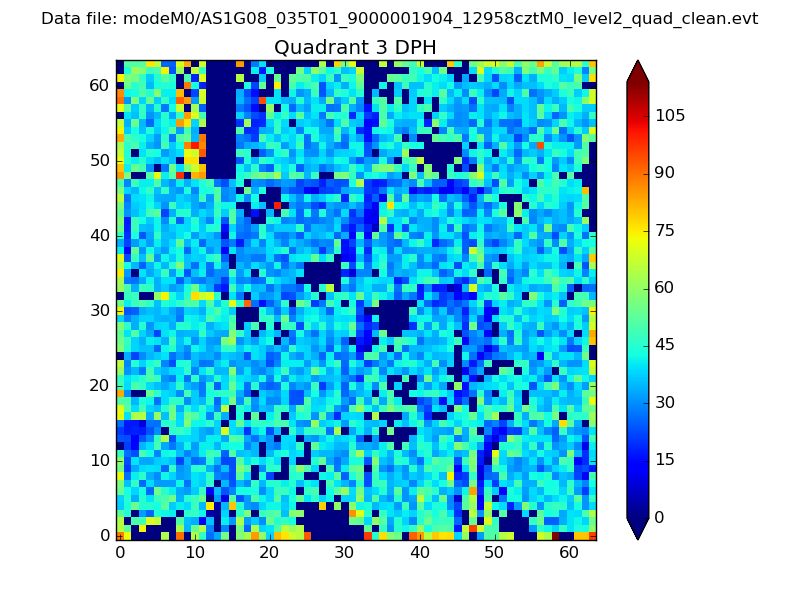 |
 |
Quadrant C |
| Plot type | Count rate plots | Images |
|---|---|---|
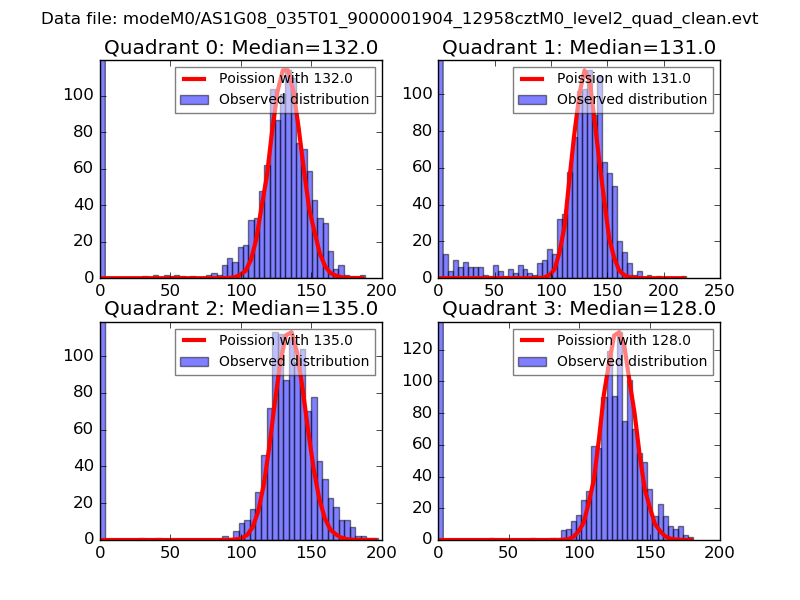
| Comparison with Poisson distribution Blue bars denote a histogram of data divided into 1 sec bins. Red curve is a Poisson curve with rate = median count rate of data. |
 |
 |
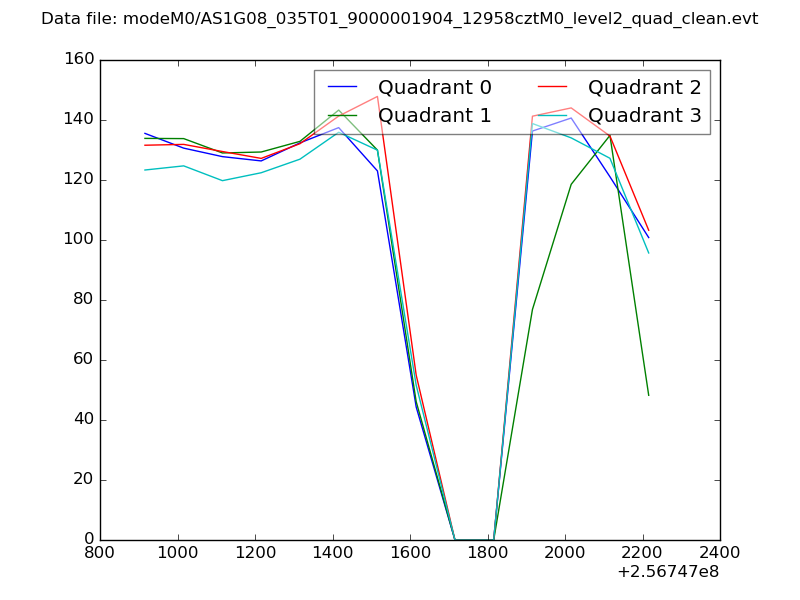
| Quadrant-wise count rates Data is divided into 100 sec bins |
 |
|
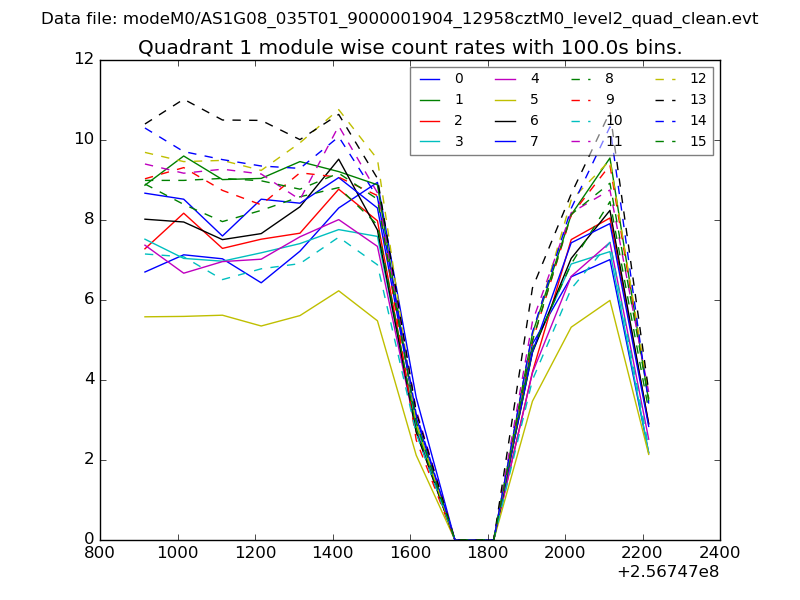
| Module-wise count rates for Quadrant A Data is divided into 100 sec bins |
 |
 |
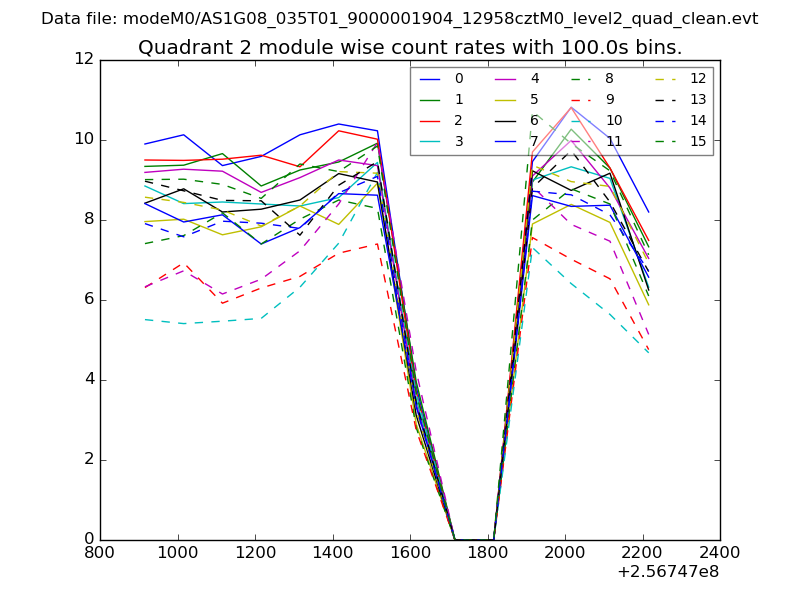
| Module-wise count rates for Quadrant B Data is divided into 100 sec bins |
 |
 |
| Module-wise count rates for Quadrant C Data is divided into 100 sec bins |
 |
 |
| Module-wise count rates for Quadrant D Data is divided into 100 sec bins |
 |
 |
| Parameter | Plot |
|---|---|
| CZT HV Monitor | 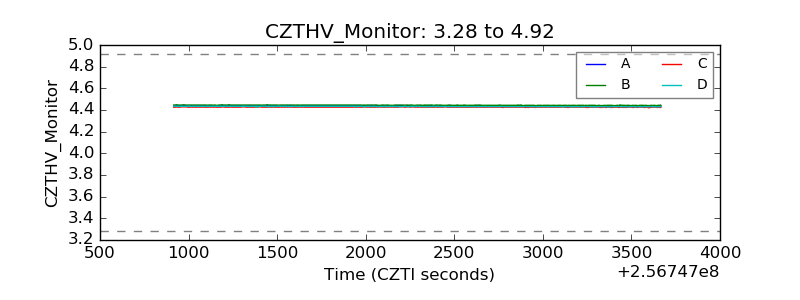 |
| D_VDD | 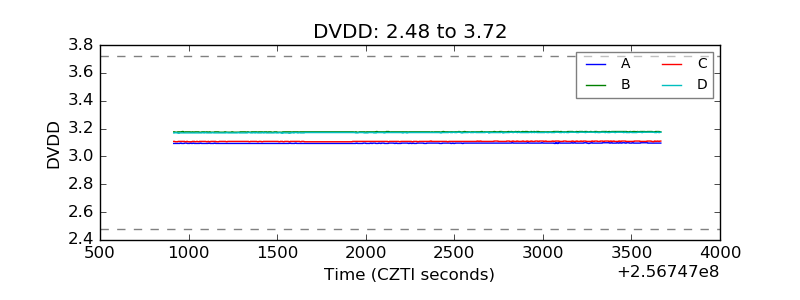 |
| Temperature 1 |  |
| Veto HV Monitor | 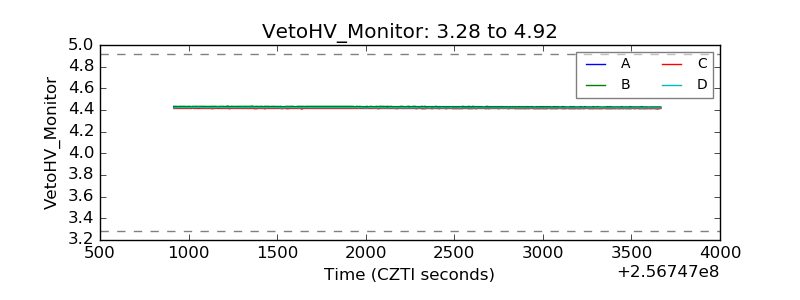 |
| Veto LLD | 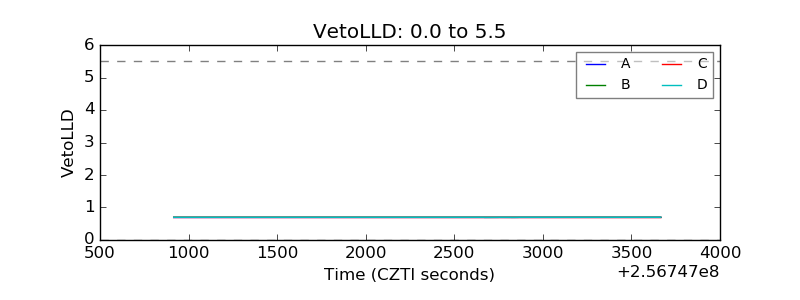 |
| Alpha Counter | 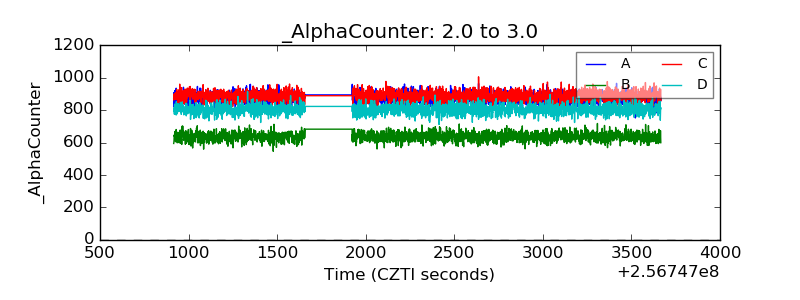 |
| _CPM_Rate | 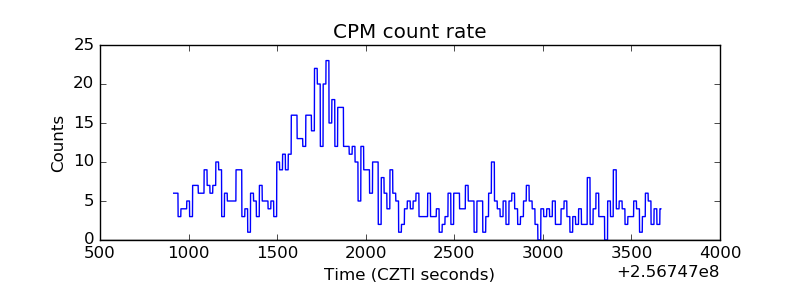 |
| CZT Counter | 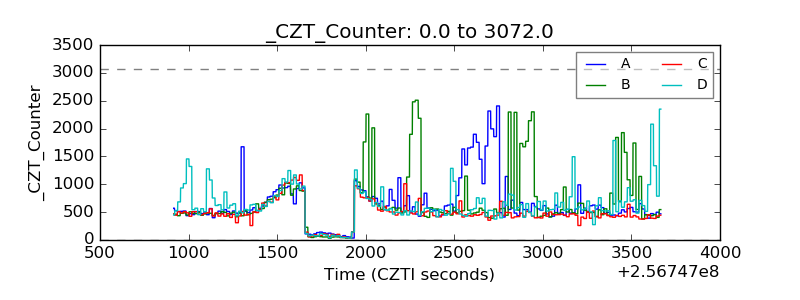 |
| +2.5 Volts monitor |  |
| +5 Volts monitor |  |
| _ROLL_ROT | 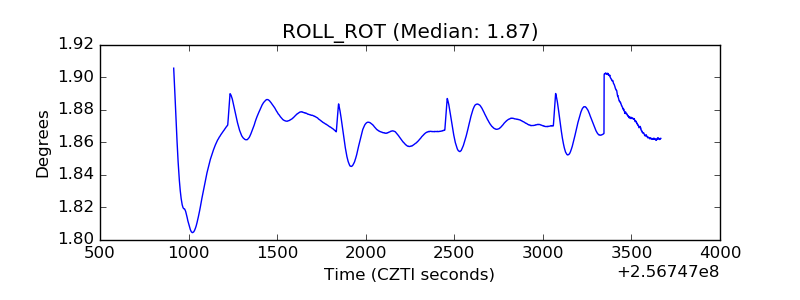 |
| _Roll_DEC |  |
| _Roll_RA | 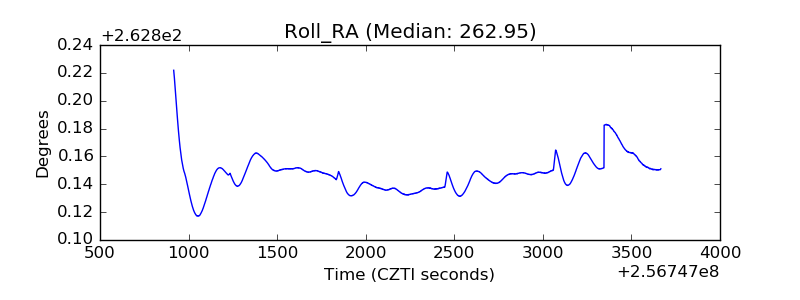 |
| Veto Counter |  |