| Param | Original file | Final file |
|---|---|---|
| Filename | modeM0/AS1G08_035T01_9000001904_12959cztM0_level2.evt | modeM0/AS1G08_035T01_9000001904_12959cztM0_level2_quad_clean.evt |
| Size (bytes) | 633,769,920 | 76,383,360 |
| Size | 604.4 MB | 72.8 MB |
| Events in quadrant A | 4,478,739 | 457,144 |
| Events in quadrant B | 5,292,008 | 424,270 |
| Events in quadrant C | 3,569,042 | 466,235 |
| Events in quadrant D | 5,343,196 | 440,538 |
| Mode M0 | |||
|---|---|---|---|
| Quadrant | BADHDUFLAG | Total packets | Discarded packets |
| A | 0 | 17972 | 2 |
| B | 0 | 20636 | 1 |
| C | 0 | 15797 | 1 |
| D | 0 | 20920 | 1 |
| Mode SS | |||
|---|---|---|---|
| Quadrant | BADHDUFLAG | Total packets | Discarded packets |
| A | 0 | 152 | 0 |
| B | 0 | 152 | 0 |
| C | 0 | 152 | 0 |
| D | 0 | 152 | 0 |
| Quadrant | Total seconds | Saturated seconds | Saturation percentage |
|---|---|---|---|
| A | 7529 | 445 | 5.910479% |
| B | 7529 | 1049 | 13.932793% |
| C | 7529 | 171 | 2.271218% |
| D | 7529 | 333 | 4.422898% |
Noise dominated data is calculated using 1-second bins in cleaned event files. If a bin has >2000 counts, and if more than 50% of those come from <1% of pixels, then it is considered to be noise-dominated and hence unusable.
| Quadrant | # 1 sec bins | Bins with >0 counts | Bins with >2000 counts | High rate bins dominated by noise | Noise dominated (total time) | Noise dominated (detector-on time) | Marked lightcurve |
|---|---|---|---|---|---|---|---|
| A | 7565 | 7531 | 42 | 42 | 0.56% | 0.56% | 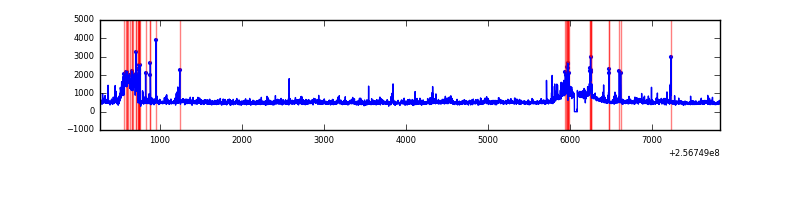 |
| B | 7565 | 7529 | 411 | 411 | 5.43% | 5.46% | 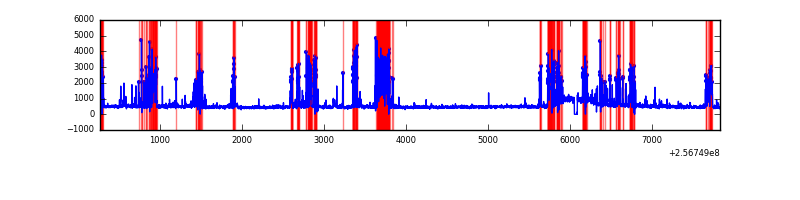 |
| C | 7565 | 7530 | 0 | 0 | 0.00% | 0.00% | 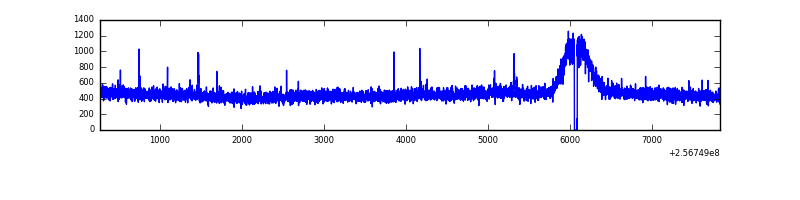 |
| D | 7565 | 7530 | 150 | 150 | 1.98% | 1.99% | 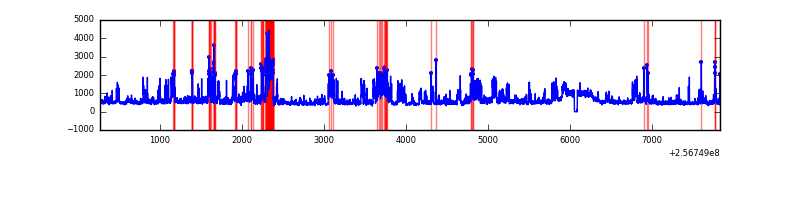 |
Top three noisy pixels from each quadrant. If the there are fewer than three noisy pixels in the level2.evt file, extra rows are filled as -1
| Pixel properties | Quadrant properties | ||||||
|---|---|---|---|---|---|---|---|
| Quadrant | DetID | PixID | Counts | Sigma | Mean | Median | Sigma |
| A | 15 | 223 | 254686 | 1350.23 | 923 | 901 | 188.0 |
| A | 1 | 162 | 144067 | 761.7 | 923 | 901 | 188.0 |
| A | 15 | 239 | 141930 | 750.33 | 923 | 901 | 188.0 |
| B | 4 | 239 | 1550875 | 9249.04 | 866 | 844 | 167.6 |
| B | 3 | 64 | 260004 | 1546.41 | 866 | 844 | 167.6 |
| B | 3 | 209 | 18778 | 107.01 | 866 | 844 | 167.6 |
| C | 0 | 207 | 11315 | 48.96 | 910 | 914 | 212.4 |
| C | 13 | 61 | 6650 | 27.0 | 910 | 914 | 212.4 |
| C | 7 | 238 | 5656 | 22.32 | 910 | 914 | 212.4 |
| D | 8 | 195 | 1518411 | 6851.07 | 907 | 880 | 221.5 |
| D | 1 | 52 | 343331 | 1546.03 | 907 | 880 | 221.5 |
| D | 2 | 234 | 34934 | 153.74 | 907 | 880 | 221.5 |
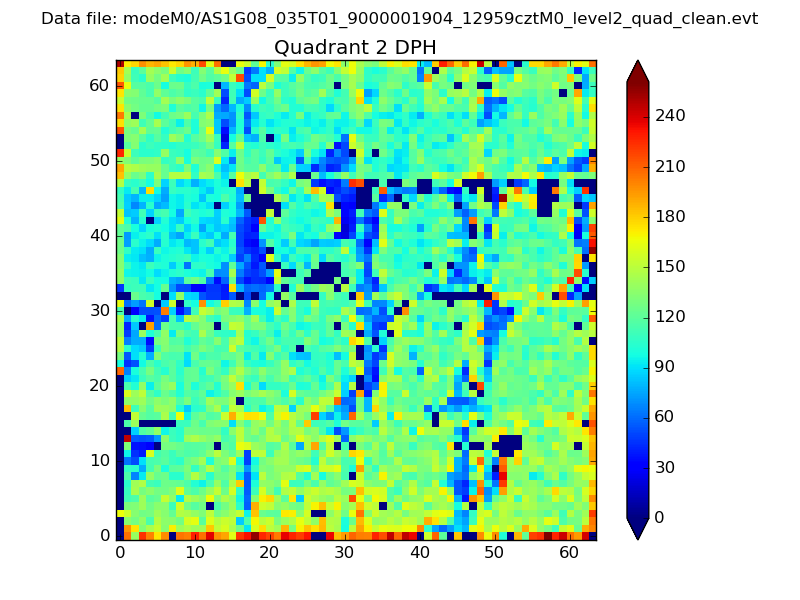
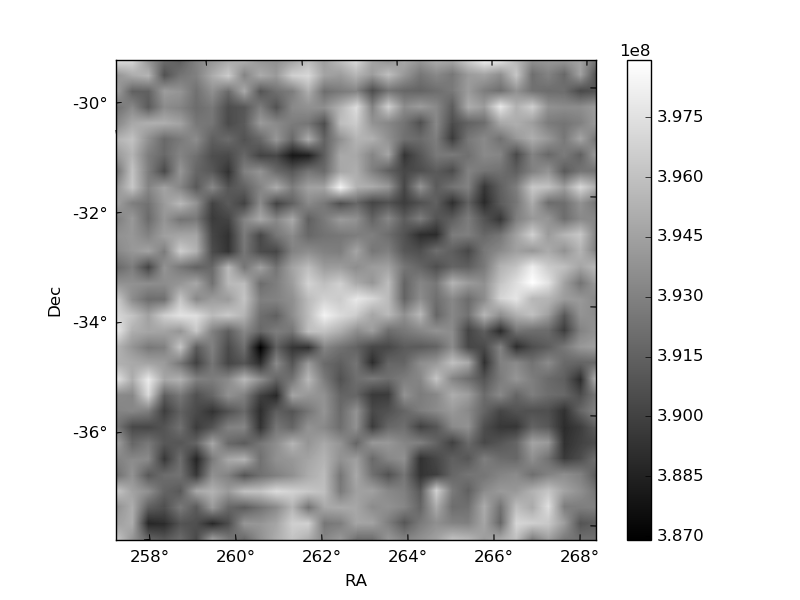
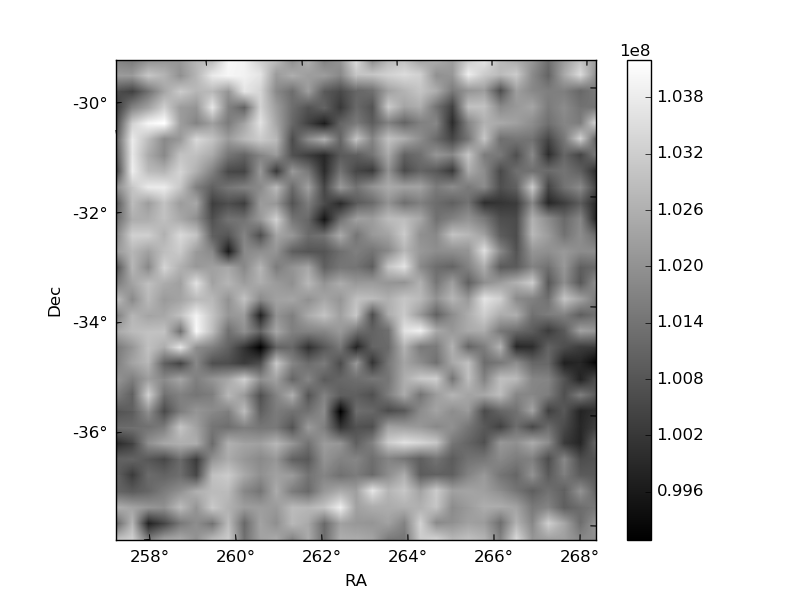
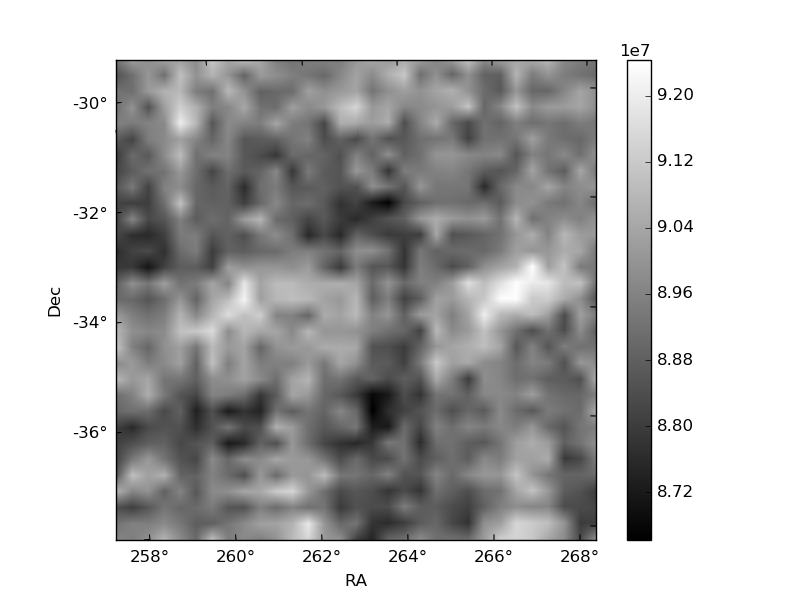
Histogram calculated using DETX and DETY for each event in the final _common_clean file
| Quadrant A | 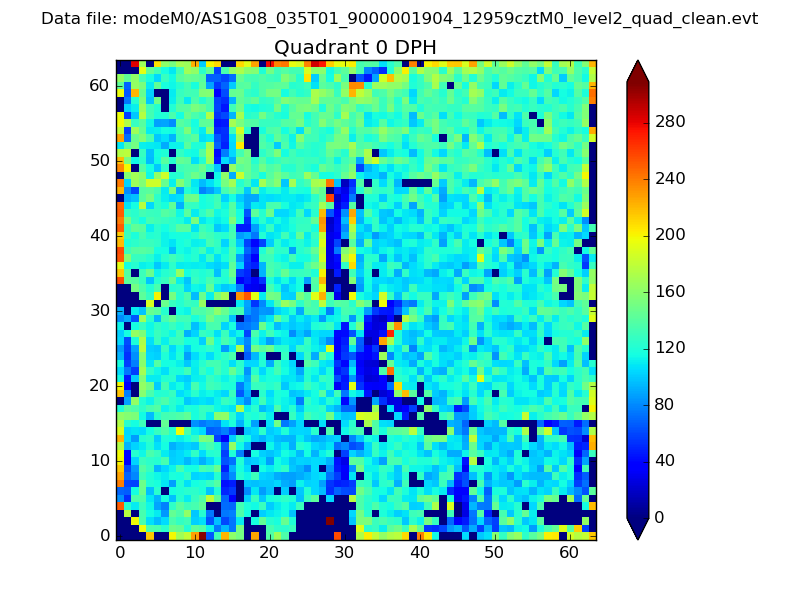 |
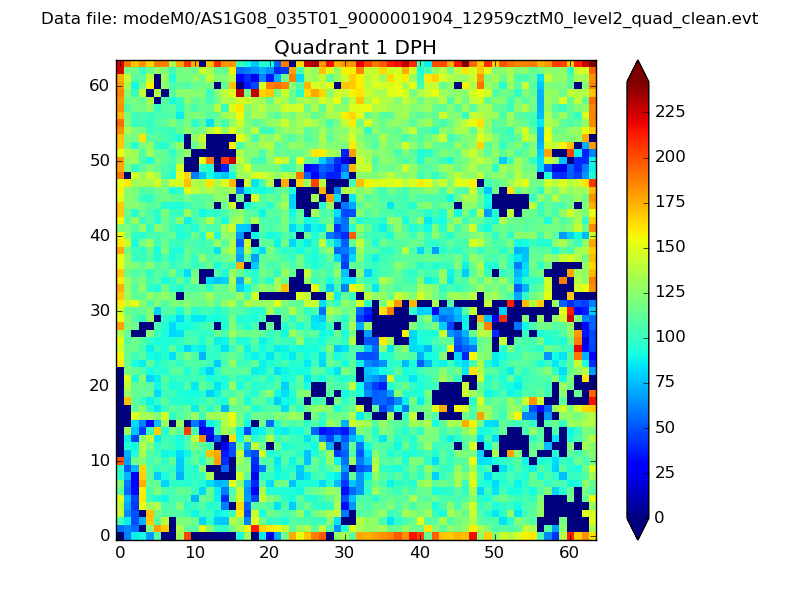 |
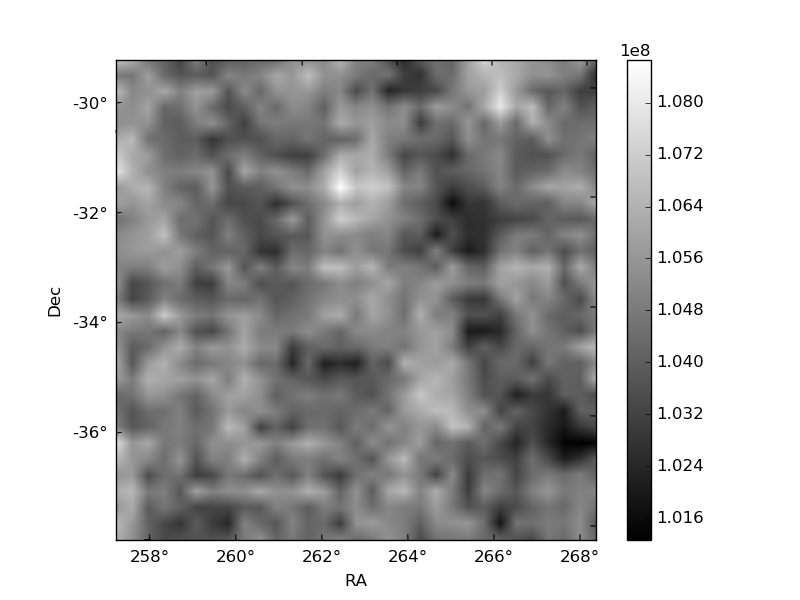
Quadrant B |
|---|---|---|---|
| Quadrant D | 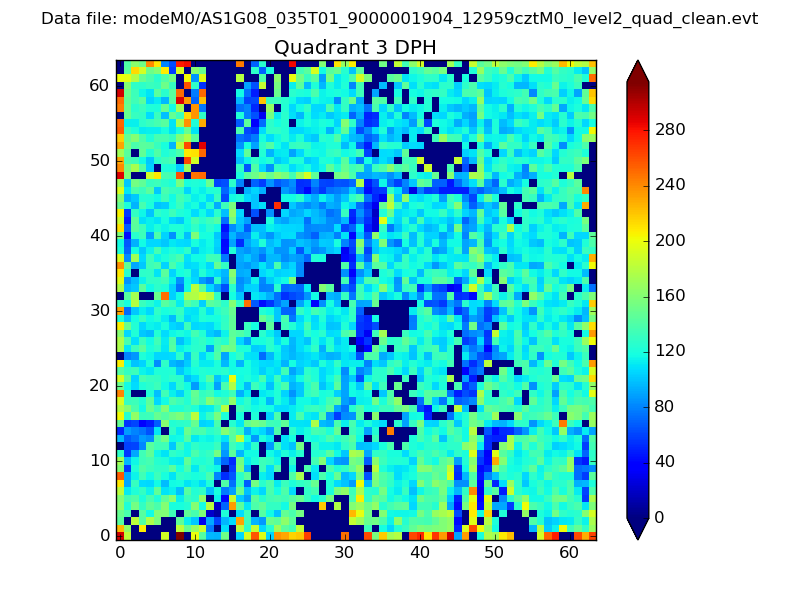 |
 |
Quadrant C |
| Plot type | Count rate plots | Images |
|---|---|---|
| Comparison with Poisson distribution Blue bars denote a histogram of data divided into 1 sec bins. Red curve is a Poisson curve with rate = median count rate of data. |
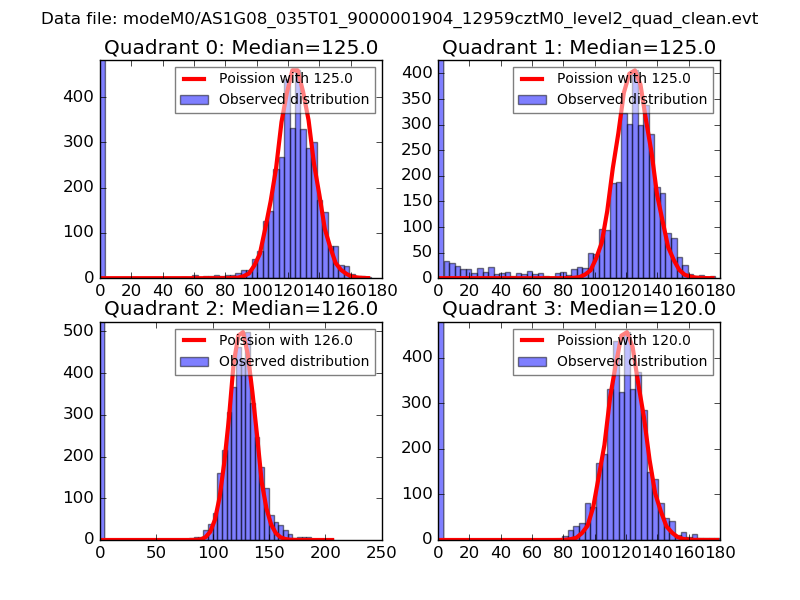 |
 |
| Quadrant-wise count rates Data is divided into 100 sec bins |
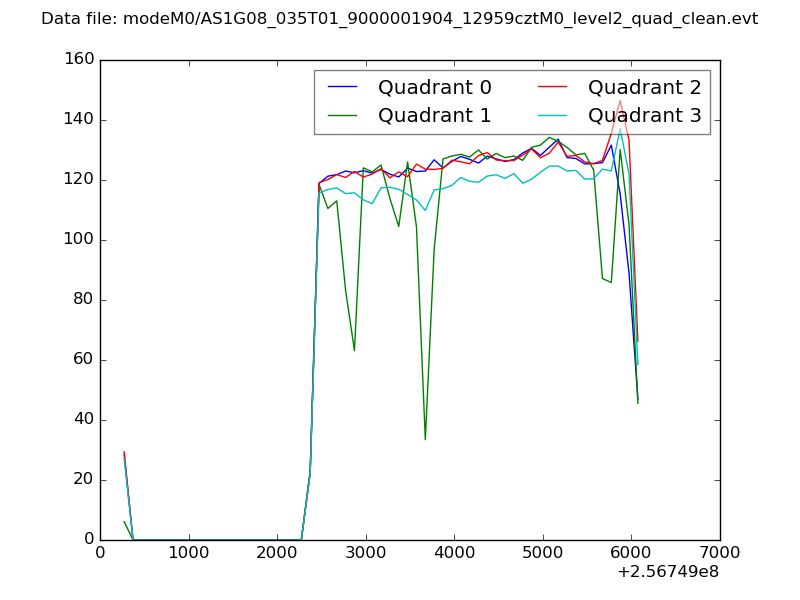 |
|
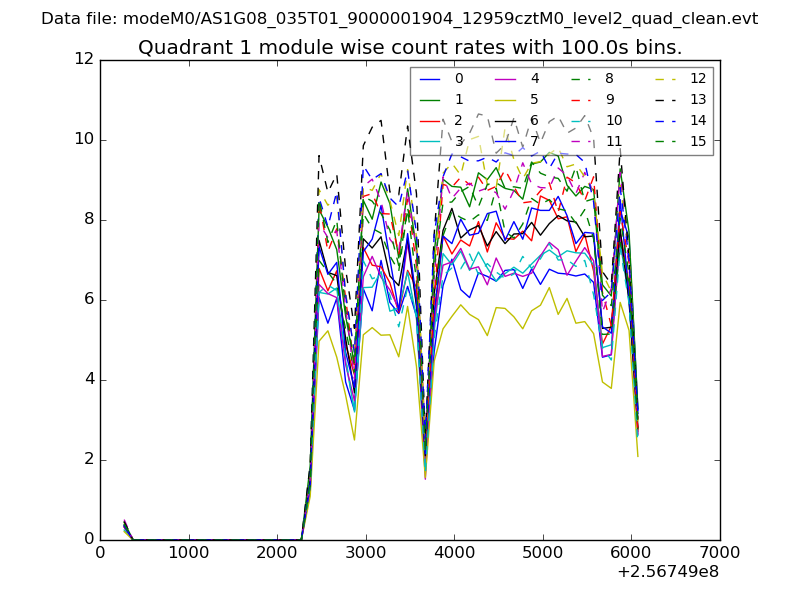
| Module-wise count rates for Quadrant A Data is divided into 100 sec bins |
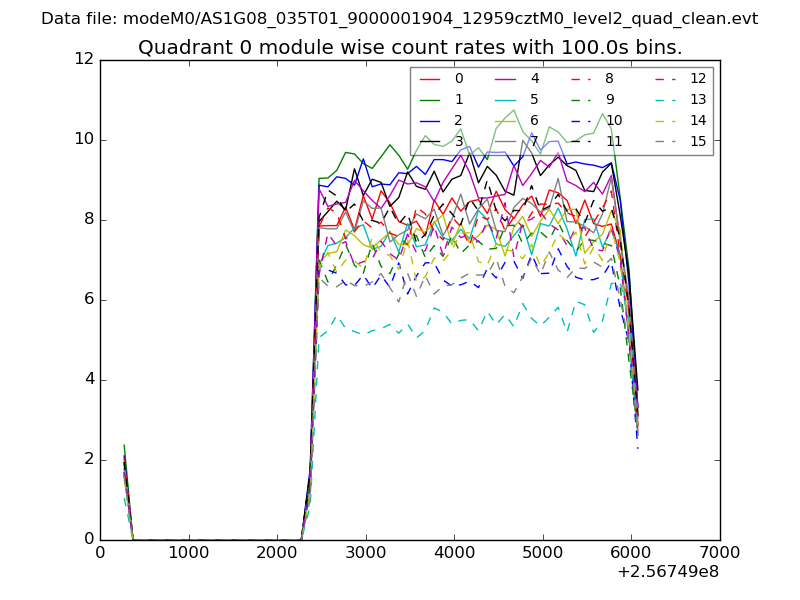 |
 |
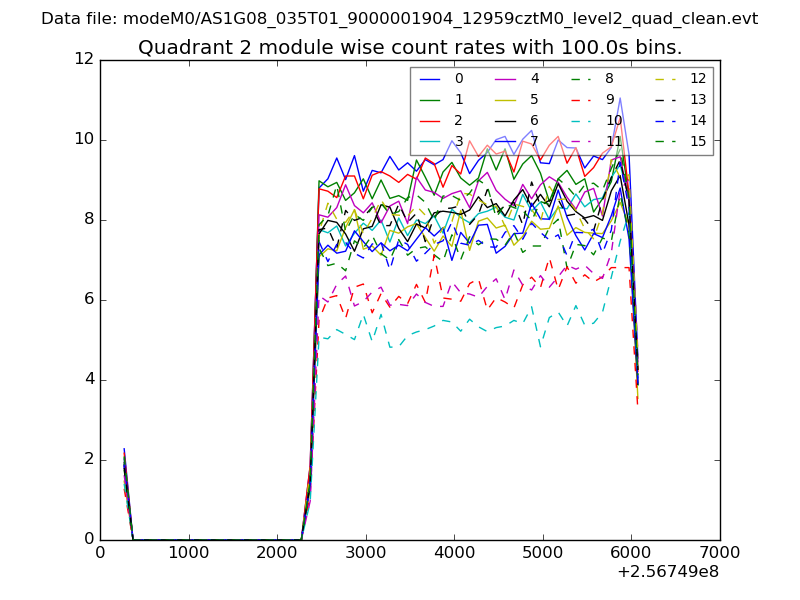
| Module-wise count rates for Quadrant B Data is divided into 100 sec bins |
 |
 |
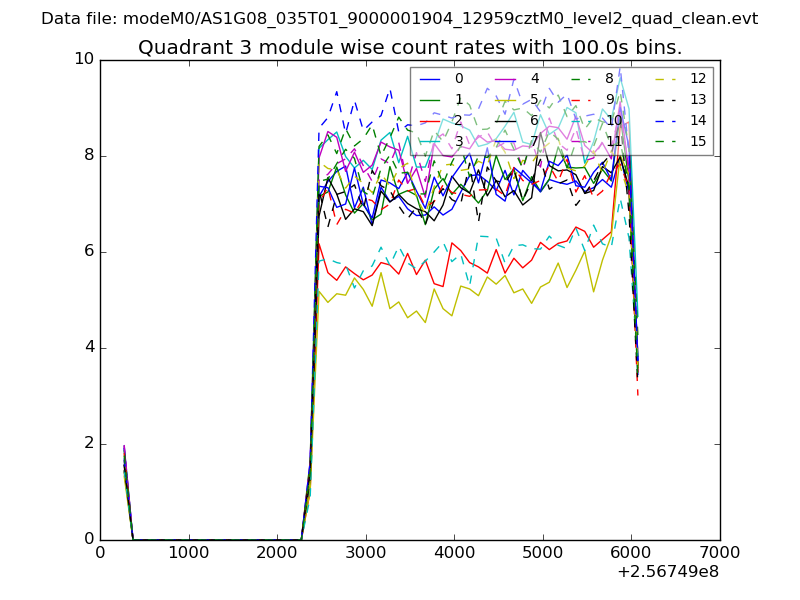
| Module-wise count rates for Quadrant C Data is divided into 100 sec bins |
 |
 |
| Module-wise count rates for Quadrant D Data is divided into 100 sec bins |
 |
 |
| Parameter | Plot |
|---|---|
| CZT HV Monitor | 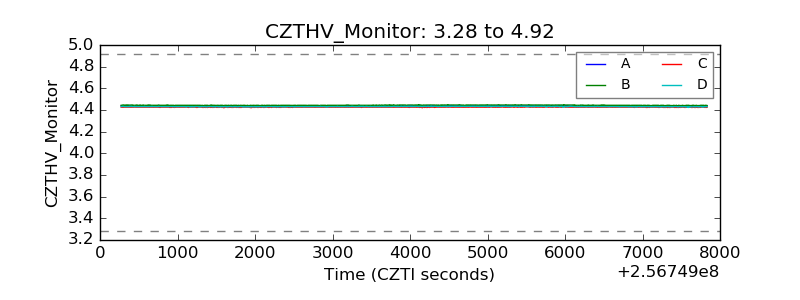 |
| D_VDD | 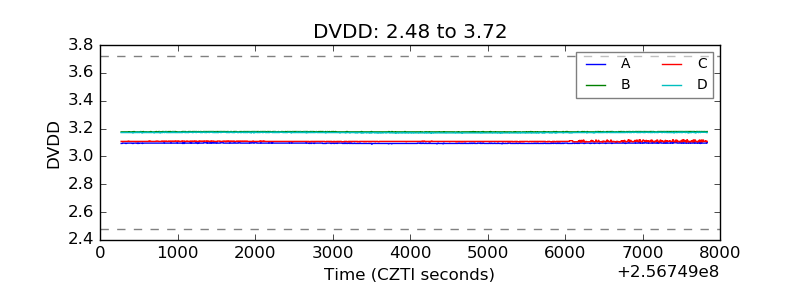 |
| Temperature 1 | 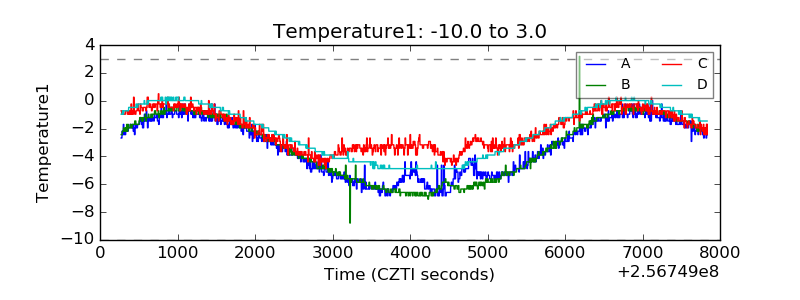 |
| Veto HV Monitor | 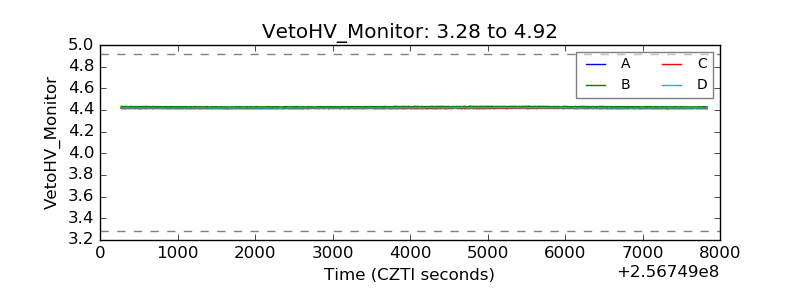 |
| Veto LLD | 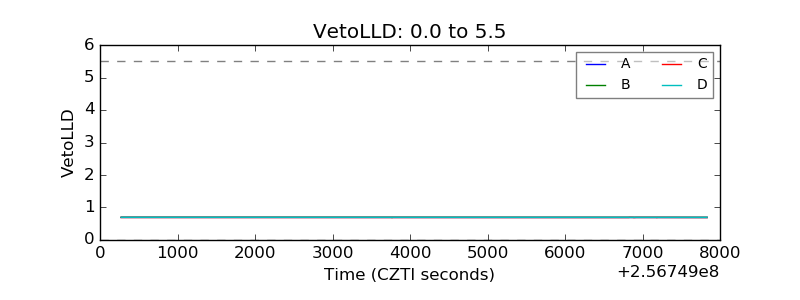 |
| Alpha Counter | 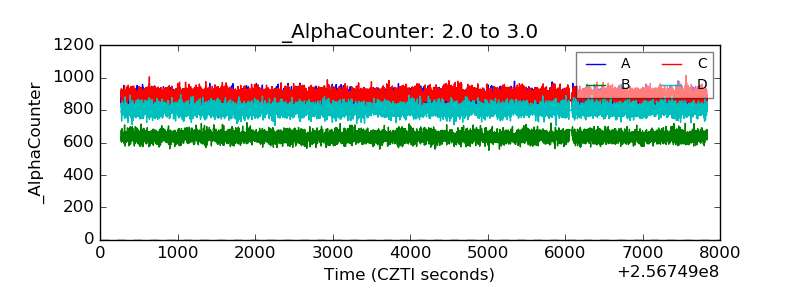 |
| _CPM_Rate | 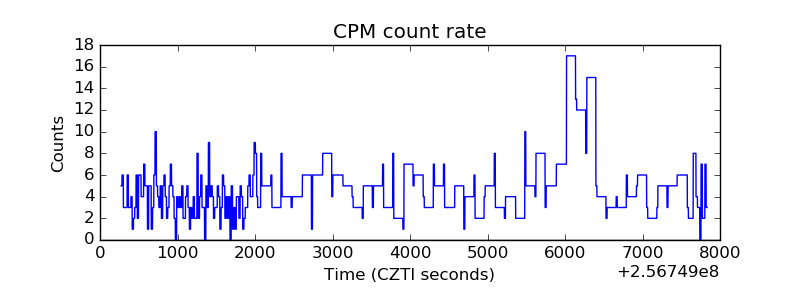 |
| CZT Counter | 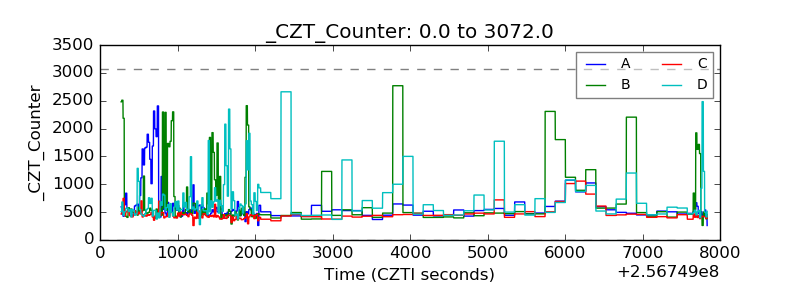 |
| +2.5 Volts monitor |  |
| +5 Volts monitor |  |
| _ROLL_ROT | 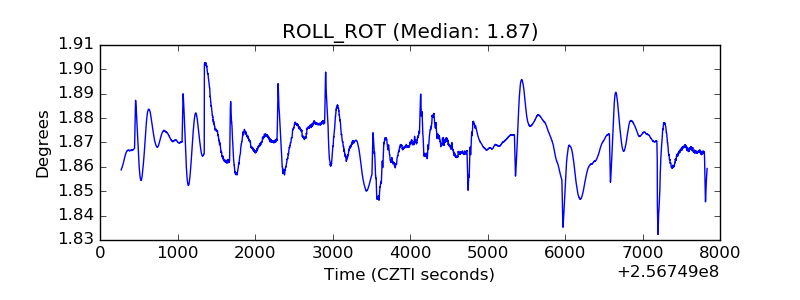 |
| _Roll_DEC | 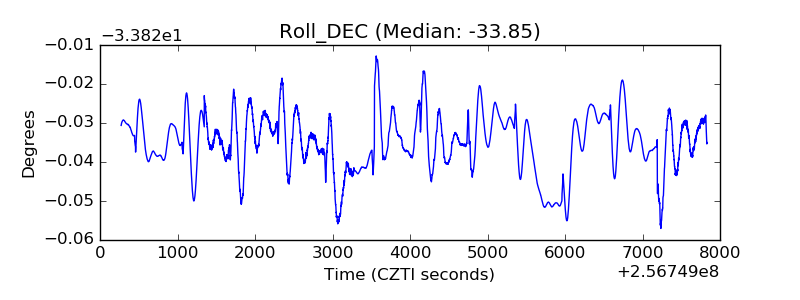 |
| _Roll_RA | 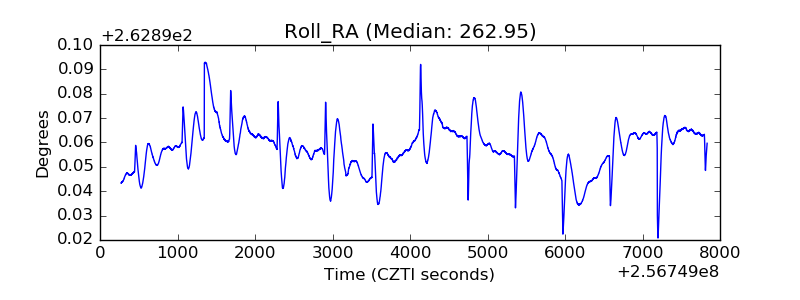 |
| Veto Counter | 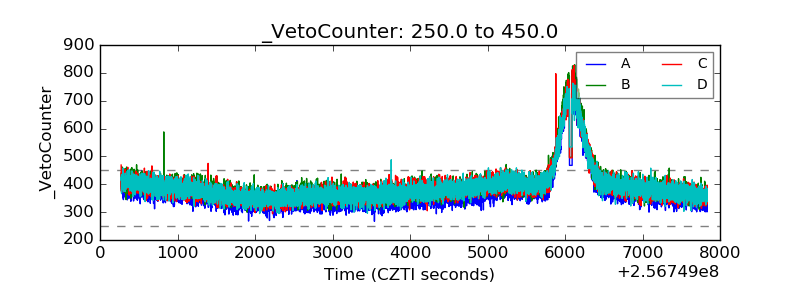 |