| Param | Original file | Final file |
|---|---|---|
| Filename | modeM0/AS1A04_112T01_9000001908cztM0_level2.fits | modeM0/AS1A04_112T01_9000001908cztM0_level2_quad_clean.evt |
| Size (bytes) | 458,974,080 | 438,402,240 |
| Size | 437.7 MB | 418.1 MB |
| Events in quadrant A | 2,831,264 | 2,659,968 |
| Events in quadrant B | 2,587,912 | 2,459,203 |
| Events in quadrant C | 2,797,610 | 2,538,386 |
| Events in quadrant D | 2,448,480 | 2,386,374 |
| Mode SS | |||
|---|---|---|---|
| Quadrant | BADHDUFLAG | Total packets | Discarded packets |
| A | 0 | 960 | 0 |
| B | 0 | 960 | 0 |
| C | 0 | 960 | 0 |
| D | 0 | 960 | 0 |
| Mode M0 | |||
|---|---|---|---|
| Quadrant | BADHDUFLAG | Total packets | Discarded packets |
| A | 0 | 105832 | 0 |
| B | 0 | 119531 | 0 |
| C | 0 | 102355 | 0 |
| D | 0 | 109939 | 0 |
| Mode M9 | |||
|---|---|---|---|
| Quadrant | BADHDUFLAG | Total packets | Discarded packets |
| A | 0 | 82 | 0 |
| B | 0 | 82 | 0 |
| C | 0 | 82 | 0 |
| D | 0 | 82 | 0 |
| Quadrant | Total seconds | Saturated seconds | Saturation percentage |
|---|---|---|---|
| A | 47111 | 804 | 1.706608% |
| B | 47111 | 4177 | 8.866294% |
| C | 47111 | 1058 | 2.245760% |
| D | 47111 | 1031 | 2.188449% |
Noise dominated data is calculated using 1-second bins in cleaned event files. If a bin has >2000 counts, and if more than 50% of those come from <1% of pixels, then it is considered to be noise-dominated and hence unusable.
| Quadrant | # 1 sec bins | Bins with >0 counts | Bins with >2000 counts | High rate bins dominated by noise | Noise dominated (total time) | Noise dominated (detector-on time) | Marked lightcurve |
|---|---|---|---|---|---|---|---|
| A | 55226 | 47106 | 0 | 0 | 0.00% | 0.00% |  |
| B | 55226 | 46001 | 0 | 0 | 0.00% | 0.00% |  |
| C | 55226 | 47049 | 0 | 0 | 0.00% | 0.00% |  |
| D | 55226 | 47108 | 0 | 0 | 0.00% | 0.00% |  |
Top three noisy pixels from each quadrant. If the there are fewer than three noisy pixels in the level2.evt file, extra rows are filled as -1
| Pixel properties | Quadrant properties | ||||||
|---|---|---|---|---|---|---|---|
| Quadrant | DetID | PixID | Counts | Sigma | Mean | Median | Sigma |
| A | 0 | 29 | 2649 | 10.71 | 739 | 697 | 182.3 |
| A | 7 | 110 | 2329 | 8.95 | 739 | 697 | 182.3 |
| A | 0 | 30 | 2116 | 7.78 | 739 | 697 | 182.3 |
| B | 2 | 9 | 2226 | 11.6 | 686 | 659 | 135.1 |
| B | 14 | 254 | 1727 | 7.91 | 686 | 659 | 135.1 |
| B | 5 | 255 | 1714 | 7.81 | 686 | 659 | 135.1 |
| C | 12 | 241 | 1887 | 6.25 | 740 | 693 | 191.1 |
| C | 2 | 191 | 1871 | 6.16 | 740 | 693 | 191.1 |
| C | 9 | 242 | 1847 | 6.04 | 740 | 693 | 191.1 |
| D | 10 | 189 | 1791 | 6.22 | 698 | 639 | 185.3 |
| D | 3 | 14 | 1765 | 6.08 | 698 | 639 | 185.3 |
| D | 6 | 231 | 1764 | 6.07 | 698 | 639 | 185.3 |
Histogram calculated using DETX and DETY for each event in the final _common_clean file
| Quadrant A | 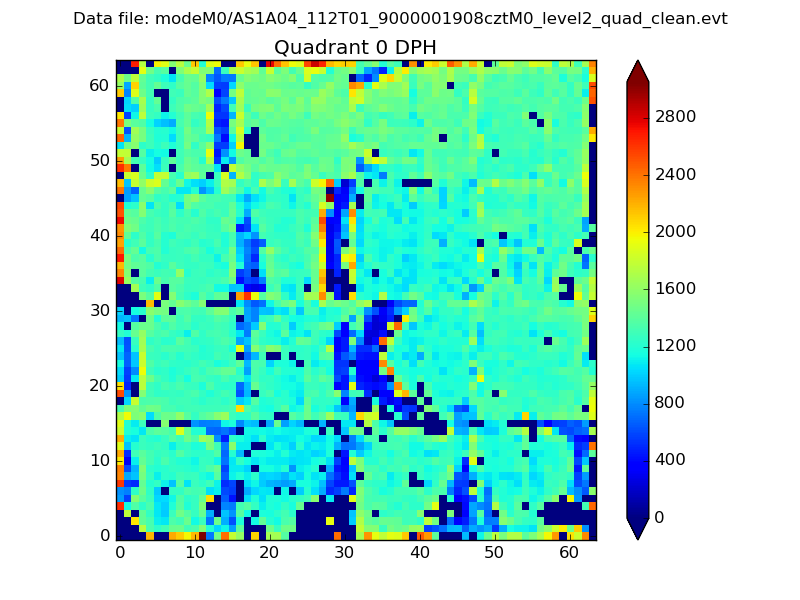 |
 |
Quadrant B |
|---|---|---|---|
| Quadrant D | 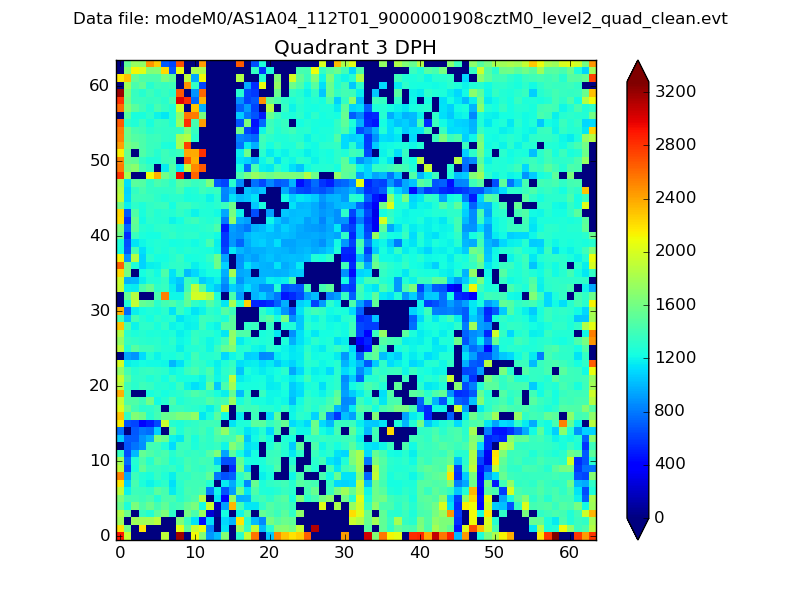 |
 |
Quadrant C |
| Plot type | Count rate plots | Images |
|---|---|---|
| Comparison with Poisson distribution Blue bars denote a histogram of data divided into 1 sec bins. Red curve is a Poisson curve with rate = median count rate of data. |
 |
 |
| Quadrant-wise count rates Data is divided into 100 sec bins |
 |
|
| Module-wise count rates for Quadrant A Data is divided into 100 sec bins |
 |
 |
| Module-wise count rates for Quadrant B Data is divided into 100 sec bins |
 |
 |
| Module-wise count rates for Quadrant C Data is divided into 100 sec bins |
 |
 |
| Module-wise count rates for Quadrant D Data is divided into 100 sec bins |
 |
 |
| Parameter | Plot |
|---|---|
| CZT HV Monitor |  |
| D_VDD |  |
| Temperature 1 |  |
| Veto HV Monitor |  |
| Veto LLD |  |
| Alpha Counter |  |
| _CPM_Rate |  |
| CZT Counter |  |
| +2.5 Volts monitor |  |
| +5 Volts monitor |  |
| _ROLL_ROT |  |
| _Roll_DEC |  |
| _Roll_RA |  |
| Veto Counter |  |