| Param | Original file | Final file |
|---|---|---|
| Filename | modeM0/AS1A04_112T01_9000001908_12967cztM0_level2.evt | modeM0/AS1A04_112T01_9000001908_12967cztM0_level2_quad_clean.evt |
| Size (bytes) | 470,949,120 | 88,496,640 |
| Size | 449.1 MB | 84.4 MB |
| Events in quadrant A | 3,292,461 | 574,057 |
| Events in quadrant B | 3,898,414 | 535,915 |
| Events in quadrant C | 3,047,976 | 586,833 |
| Events in quadrant D | 3,606,687 | 554,172 |
| Mode SS | |||
|---|---|---|---|
| Quadrant | BADHDUFLAG | Total packets | Discarded packets |
| A | 0 | 124 | 0 |
| B | 0 | 124 | 0 |
| C | 0 | 124 | 0 |
| D | 0 | 124 | 0 |
| Mode M0 | |||
|---|---|---|---|
| Quadrant | BADHDUFLAG | Total packets | Discarded packets |
| A | 0 | 13565 | 3 |
| B | 0 | 15521 | 2 |
| C | 0 | 13014 | 2 |
| D | 0 | 14491 | 2 |
| Mode M9 | |||
|---|---|---|---|
| Quadrant | BADHDUFLAG | Total packets | Discarded packets |
| A | 0 | 22 | 0 |
| B | 0 | 22 | 0 |
| C | 0 | 22 | 0 |
| D | 0 | 23 | 0 |
| Quadrant | Total seconds | Saturated seconds | Saturation percentage |
|---|---|---|---|
| A | 6144 | 54 | 0.878906% |
| B | 6144 | 540 | 8.789062% |
| C | 6144 | 39 | 0.634766% |
| D | 6144 | 95 | 1.546224% |
Noise dominated data is calculated using 1-second bins in cleaned event files. If a bin has >2000 counts, and if more than 50% of those come from <1% of pixels, then it is considered to be noise-dominated and hence unusable.
| Quadrant | # 1 sec bins | Bins with >0 counts | Bins with >2000 counts | High rate bins dominated by noise | Noise dominated (total time) | Noise dominated (detector-on time) | Marked lightcurve |
|---|---|---|---|---|---|---|---|
| A | 7405 | 6146 | 1 | 1 | 0.01% | 0.02% | 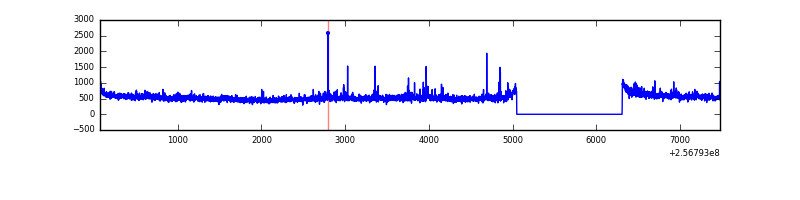 |
| B | 7405 | 6146 | 171 | 171 | 2.31% | 2.78% | 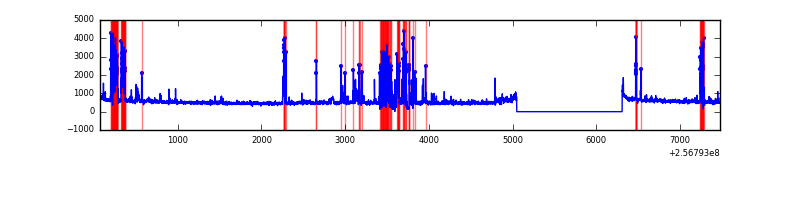 |
| C | 7405 | 6146 | 0 | 0 | 0.00% | 0.00% | 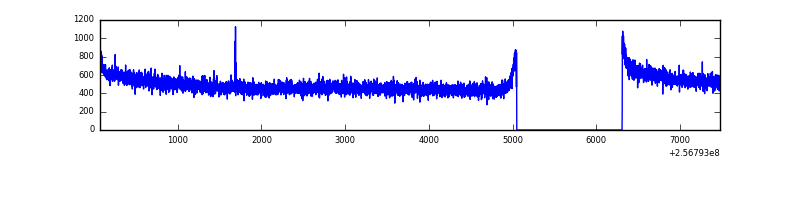 |
| D | 7405 | 6146 | 54 | 54 | 0.73% | 0.88% | 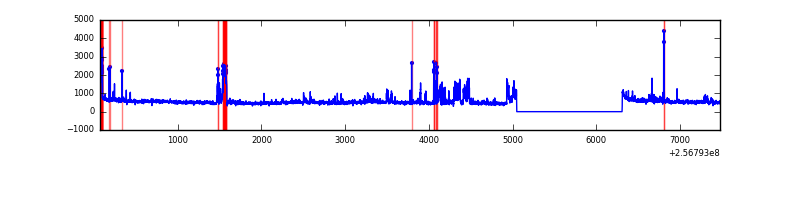 |
Top three noisy pixels from each quadrant. If the there are fewer than three noisy pixels in the level2.evt file, extra rows are filled as -1
| Pixel properties | Quadrant properties | ||||||
|---|---|---|---|---|---|---|---|
| Quadrant | DetID | PixID | Counts | Sigma | Mean | Median | Sigma |
| A | 12 | 189 | 85439 | 539.13 | 786 | 772 | 157.0 |
| A | 1 | 162 | 62108 | 390.57 | 786 | 772 | 157.0 |
| A | 1 | 178 | 25935 | 160.23 | 786 | 772 | 157.0 |
| B | 4 | 239 | 742769 | 5388.65 | 747 | 731 | 137.7 |
| B | 3 | 64 | 133592 | 964.83 | 747 | 731 | 137.7 |
| B | 0 | 85 | 67511 | 484.95 | 747 | 731 | 137.7 |
| C | 13 | 61 | 5823 | 28.37 | 780 | 783 | 177.7 |
| C | 14 | 234 | 5172 | 24.71 | 780 | 783 | 177.7 |
| C | 3 | 202 | 1956 | 6.6 | 780 | 783 | 177.7 |
| D | 8 | 195 | 242518 | 1338.93 | 767 | 747 | 180.6 |
| D | 1 | 52 | 159227 | 877.66 | 767 | 747 | 180.6 |
| D | 13 | 104 | 130968 | 721.17 | 767 | 747 | 180.6 |
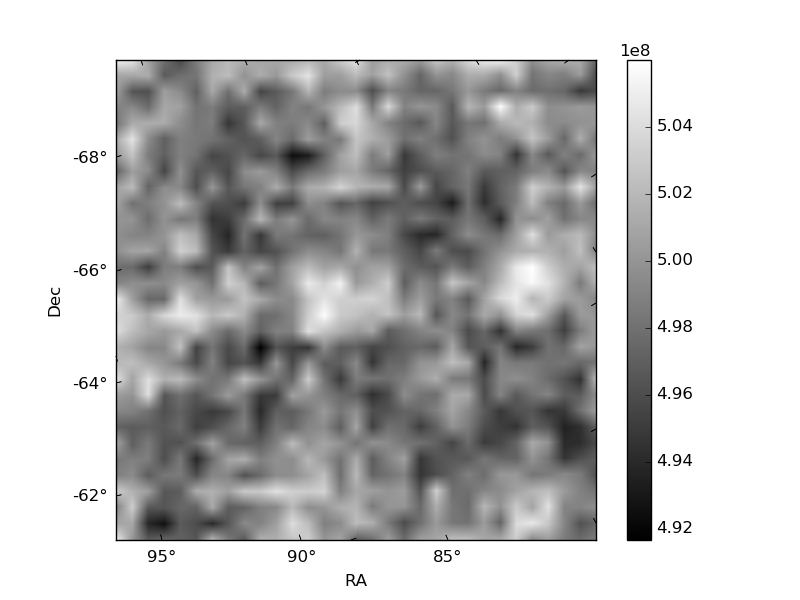
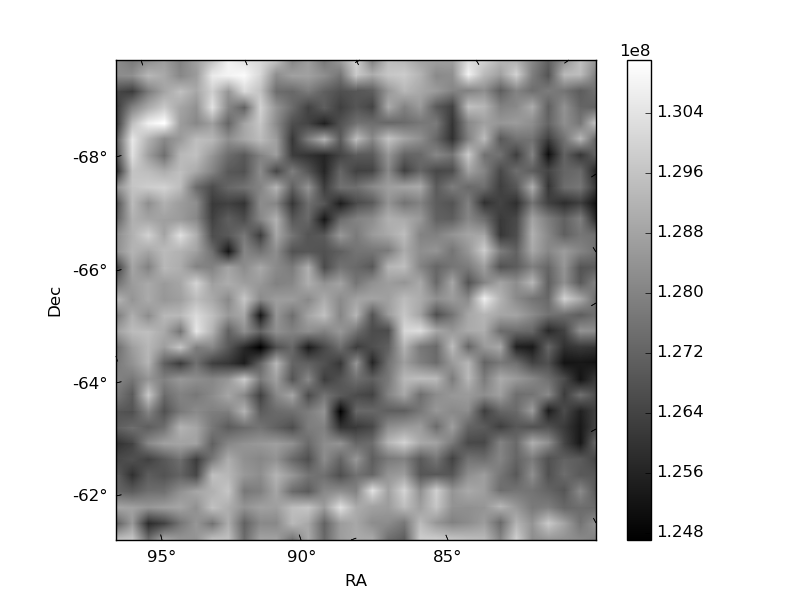
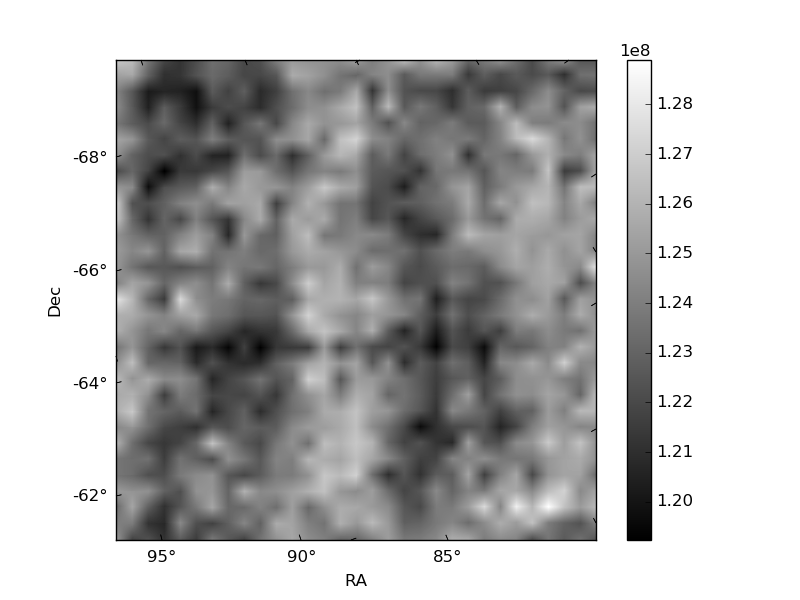
Histogram calculated using DETX and DETY for each event in the final _common_clean file
| Quadrant A | 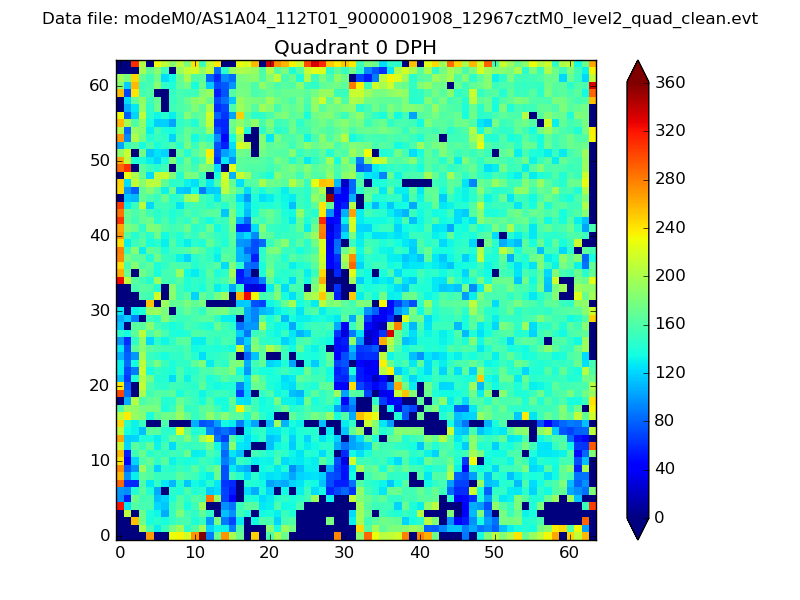 |
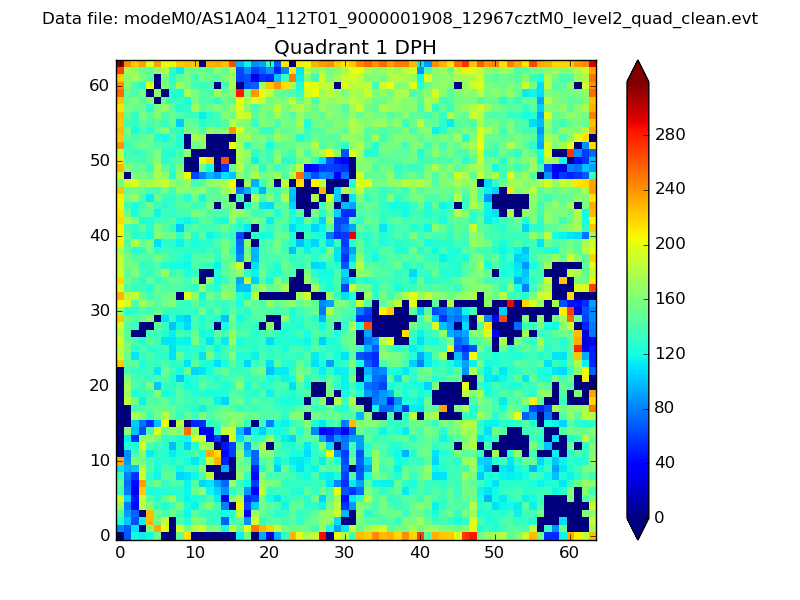 |
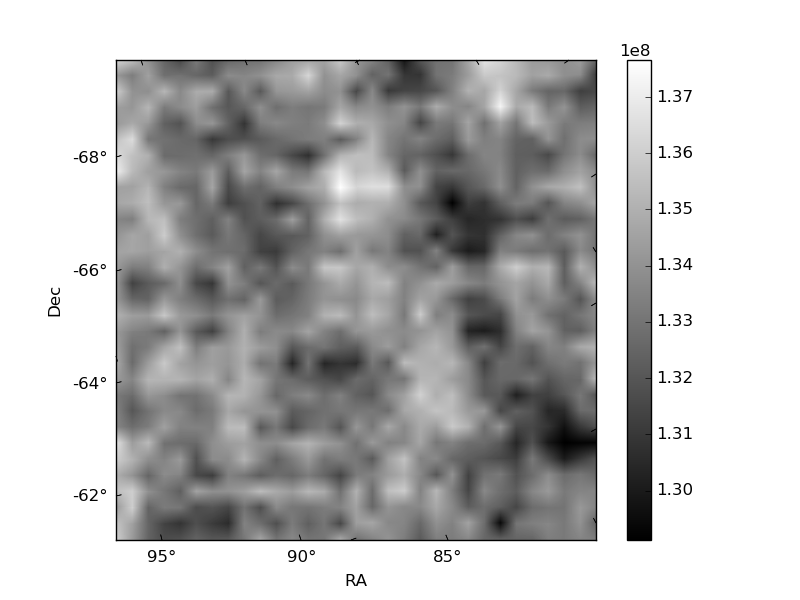
Quadrant B |
|---|---|---|---|
| Quadrant D | 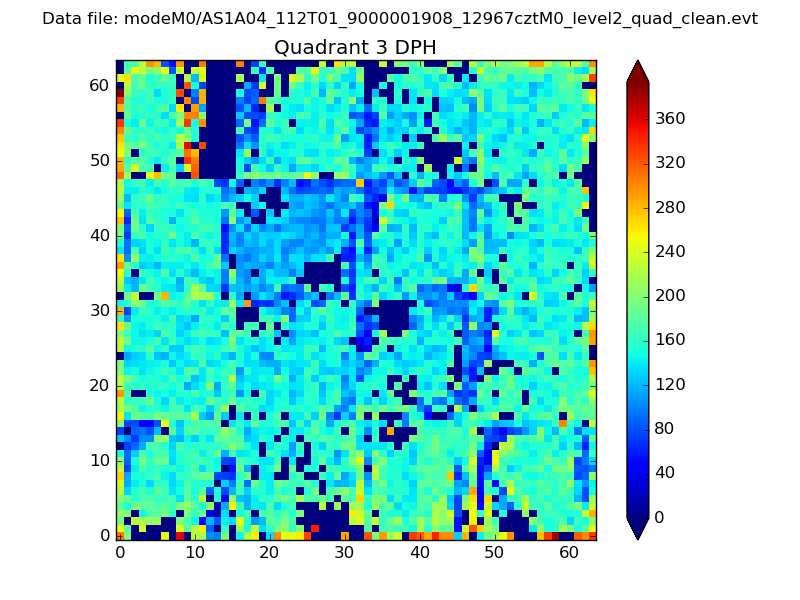 |
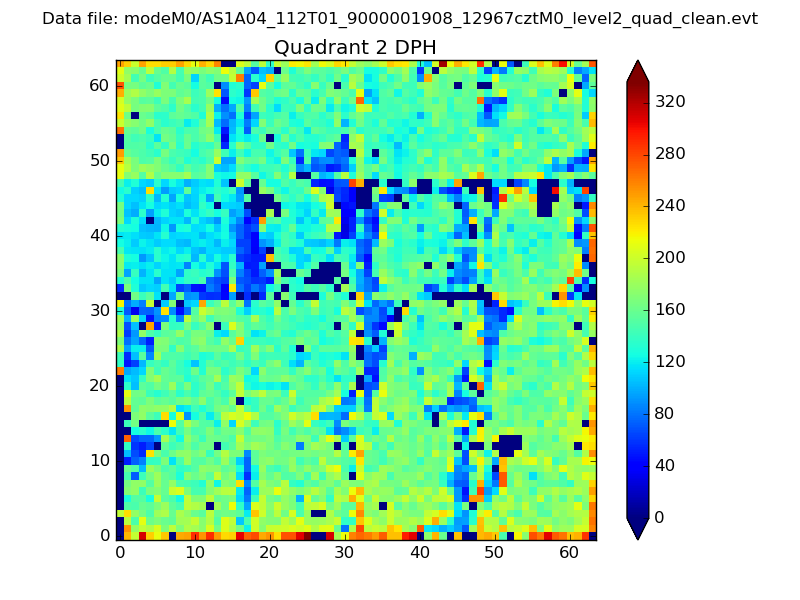 |
Quadrant C |
| Plot type | Count rate plots | Images |
|---|---|---|
| Comparison with Poisson distribution Blue bars denote a histogram of data divided into 1 sec bins. Red curve is a Poisson curve with rate = median count rate of data. |
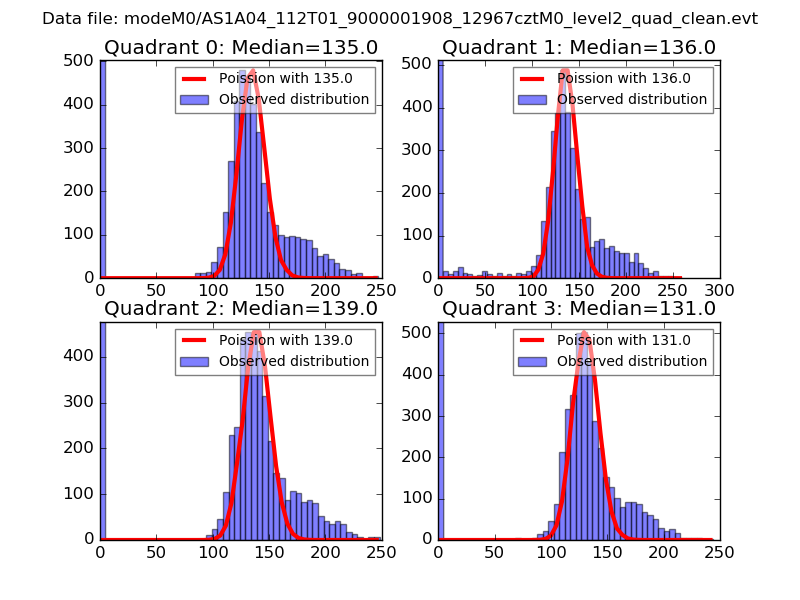 |
 |
| Quadrant-wise count rates Data is divided into 100 sec bins |
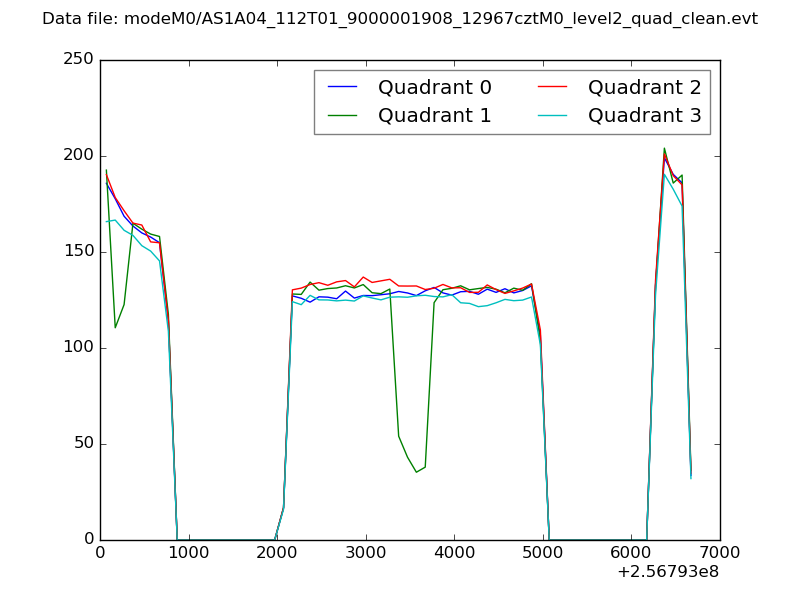 |
|
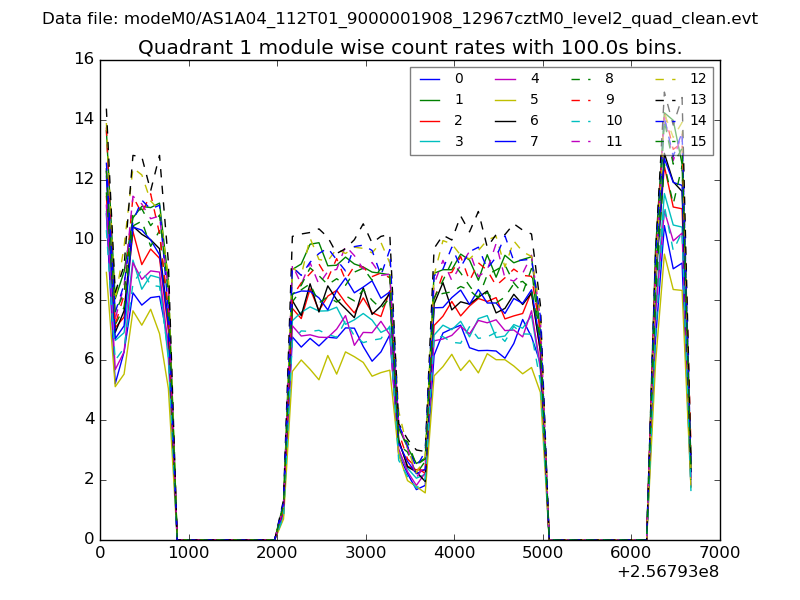
| Module-wise count rates for Quadrant A Data is divided into 100 sec bins |
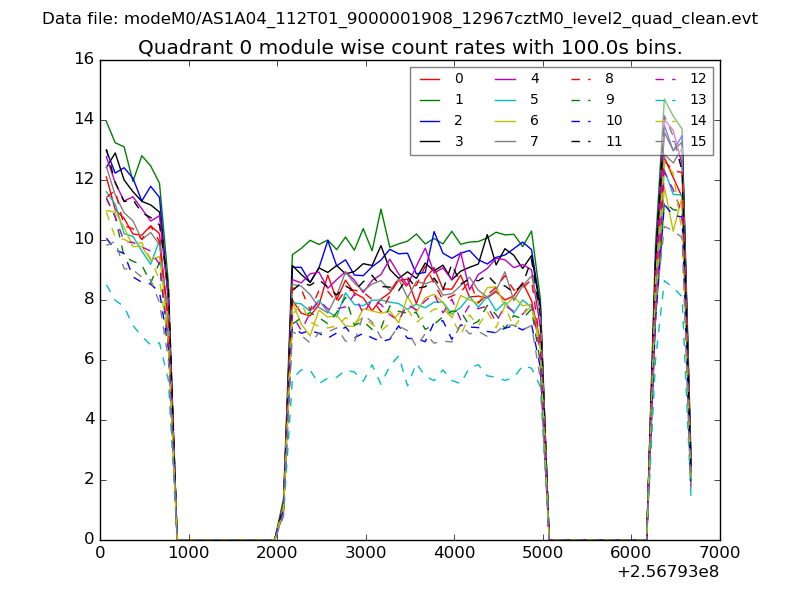 |
 |
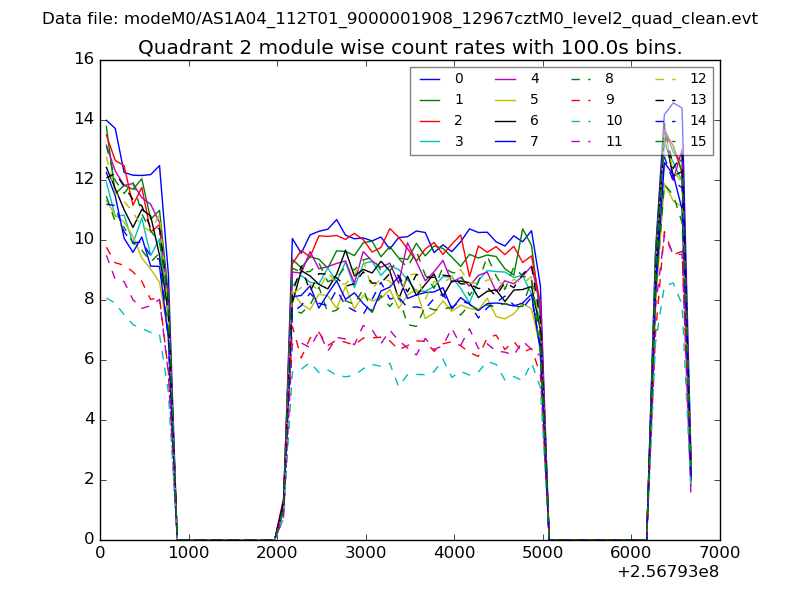
| Module-wise count rates for Quadrant B Data is divided into 100 sec bins |
 |
 |
| Module-wise count rates for Quadrant C Data is divided into 100 sec bins |
 |
 |
| Module-wise count rates for Quadrant D Data is divided into 100 sec bins |
 |
 |
| Parameter | Plot |
|---|---|
| CZT HV Monitor | 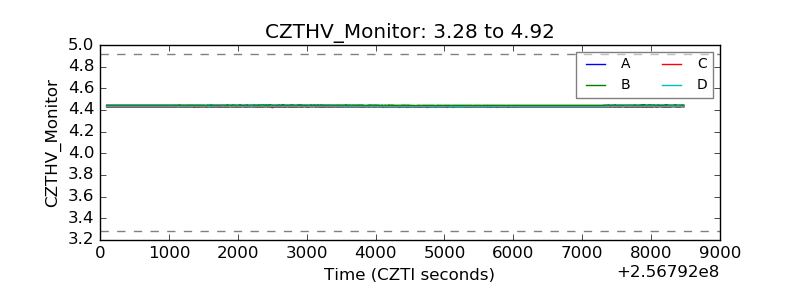 |
| D_VDD | 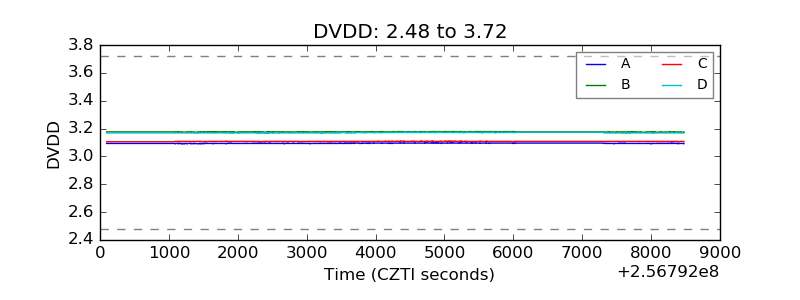 |
| Temperature 1 | 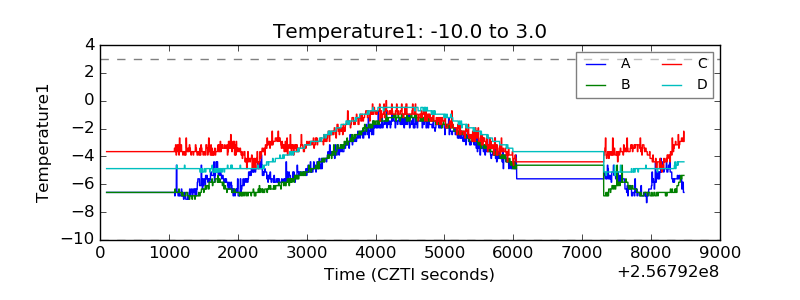 |
| Veto HV Monitor | 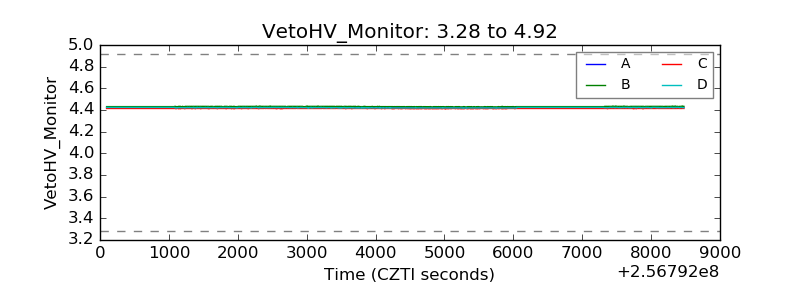 |
| Veto LLD |  |
| Alpha Counter | 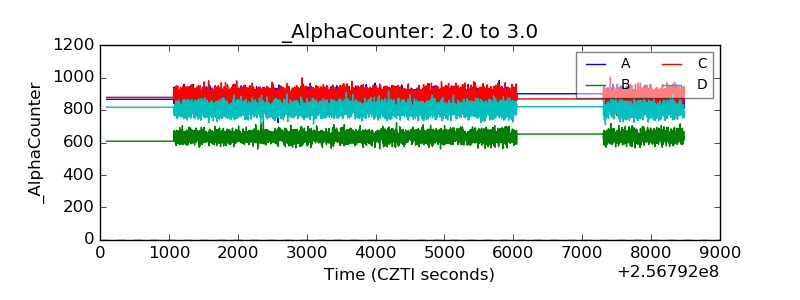 |
| _CPM_Rate | 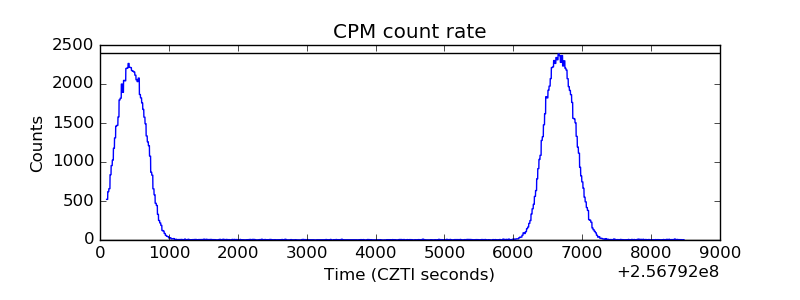 |
| CZT Counter | 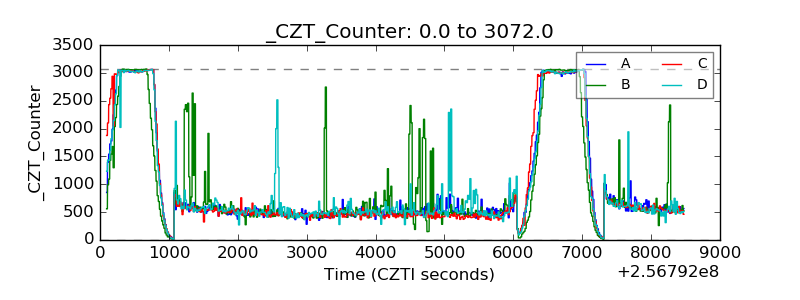 |
| +2.5 Volts monitor |  |
| +5 Volts monitor |  |
| _ROLL_ROT | 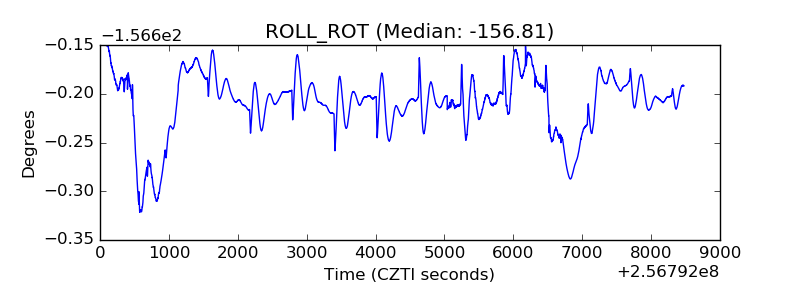 |
| _Roll_DEC | 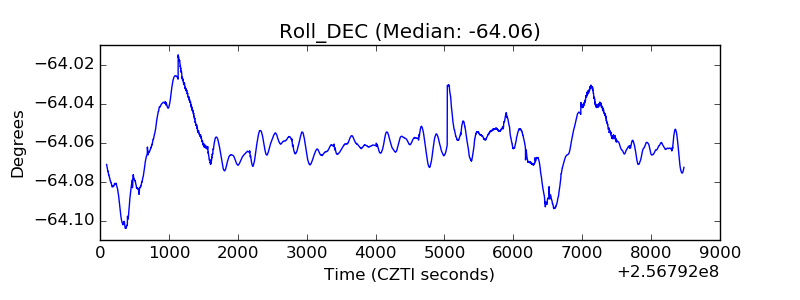 |
| _Roll_RA | 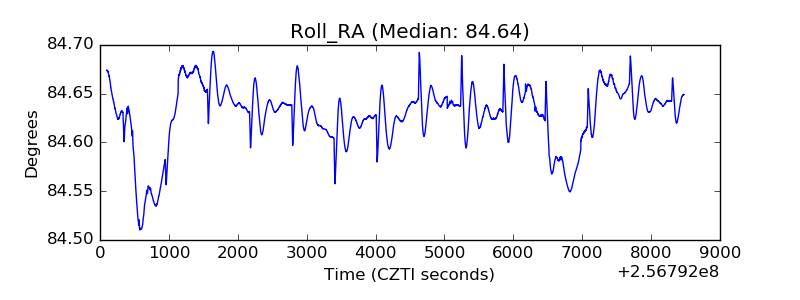 |
| Veto Counter | 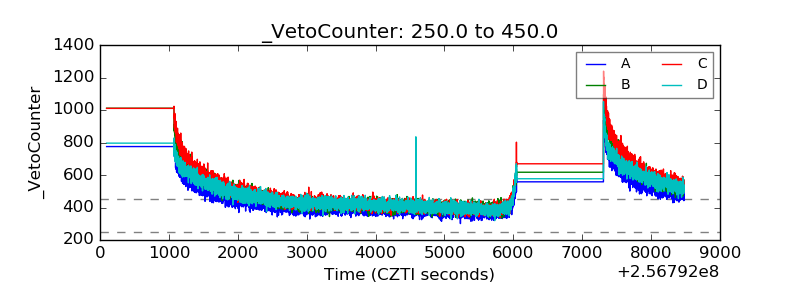 |