| Param | Original file | Final file |
|---|---|---|
| Filename | modeM0/AS1A04_112T01_9000001908_12968cztM0_level2.evt | modeM0/AS1A04_112T01_9000001908_12968cztM0_level2_quad_clean.evt |
| Size (bytes) | 544,832,640 | 94,803,840 |
| Size | 519.6 MB | 90.4 MB |
| Events in quadrant A | 3,886,132 | 602,718 |
| Events in quadrant B | 4,319,773 | 584,577 |
| Events in quadrant C | 3,526,216 | 617,080 |
| Events in quadrant D | 4,299,027 | 584,722 |
| Mode SS | |||
|---|---|---|---|
| Quadrant | BADHDUFLAG | Total packets | Discarded packets |
| A | 0 | 140 | 0 |
| B | 0 | 140 | 0 |
| C | 0 | 140 | 0 |
| D | 0 | 140 | 0 |
| Mode M0 | |||
|---|---|---|---|
| Quadrant | BADHDUFLAG | Total packets | Discarded packets |
| A | 0 | 15790 | 3 |
| B | 0 | 17166 | 2 |
| C | 0 | 14904 | 2 |
| D | 0 | 17140 | 2 |
| Mode M9 | |||
|---|---|---|---|
| Quadrant | BADHDUFLAG | Total packets | Discarded packets |
| A | 0 | 26 | 0 |
| B | 0 | 26 | 0 |
| C | 0 | 26 | 0 |
| D | 0 | 26 | 0 |
| Quadrant | Total seconds | Saturated seconds | Saturation percentage |
|---|---|---|---|
| A | 6923 | 140 | 2.022245% |
| B | 6923 | 482 | 6.962300% |
| C | 6923 | 123 | 1.776686% |
| D | 6923 | 178 | 2.571140% |
Noise dominated data is calculated using 1-second bins in cleaned event files. If a bin has >2000 counts, and if more than 50% of those come from <1% of pixels, then it is considered to be noise-dominated and hence unusable.
| Quadrant | # 1 sec bins | Bins with >0 counts | Bins with >2000 counts | High rate bins dominated by noise | Noise dominated (total time) | Noise dominated (detector-on time) | Marked lightcurve |
|---|---|---|---|---|---|---|---|
| A | 9475 | 6927 | 0 | 0 | 0.00% | 0.00% | 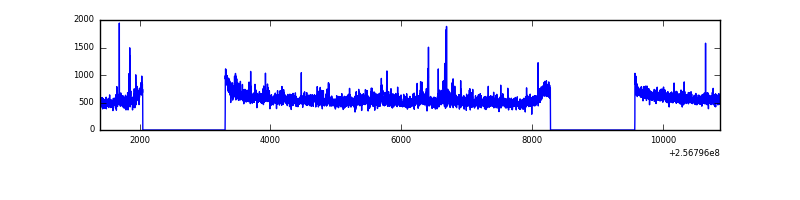 |
| B | 9475 | 6927 | 155 | 155 | 1.64% | 2.24% | 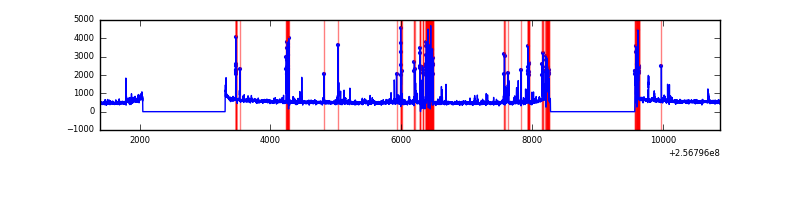 |
| C | 9475 | 6927 | 0 | 0 | 0.00% | 0.00% | 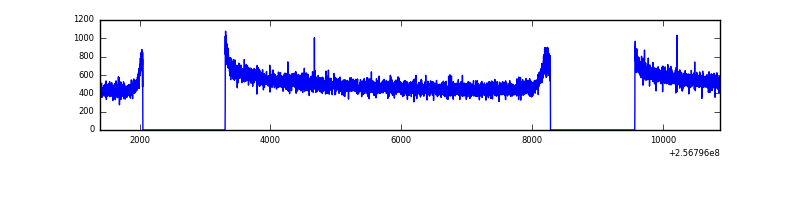 |
| D | 9475 | 6927 | 47 | 47 | 0.50% | 0.68% | 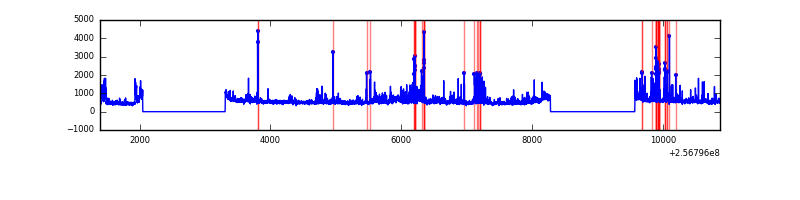 |
Top three noisy pixels from each quadrant. If the there are fewer than three noisy pixels in the level2.evt file, extra rows are filled as -1
| Pixel properties | Quadrant properties | ||||||
|---|---|---|---|---|---|---|---|
| Quadrant | DetID | PixID | Counts | Sigma | Mean | Median | Sigma |
| A | 12 | 189 | 109520 | 604.06 | 917 | 902 | 179.8 |
| A | 1 | 162 | 93491 | 514.92 | 917 | 902 | 179.8 |
| A | 1 | 178 | 40697 | 221.31 | 917 | 902 | 179.8 |
| B | 4 | 239 | 651964 | 4042.85 | 886 | 866 | 161.0 |
| B | 3 | 64 | 89883 | 552.73 | 886 | 866 | 161.0 |
| B | 0 | 85 | 38603 | 234.32 | 886 | 866 | 161.0 |
| C | 13 | 61 | 6780 | 28.92 | 903 | 910 | 203.0 |
| C | 8 | 222 | 2451 | 7.59 | 903 | 910 | 203.0 |
| C | 3 | 248 | 2188 | 6.3 | 903 | 910 | 203.0 |
| D | 1 | 52 | 685045 | 3300.09 | 893 | 871 | 207.3 |
| D | 8 | 195 | 191087 | 917.5 | 893 | 871 | 207.3 |
| D | 2 | 234 | 28036 | 131.03 | 893 | 871 | 207.3 |
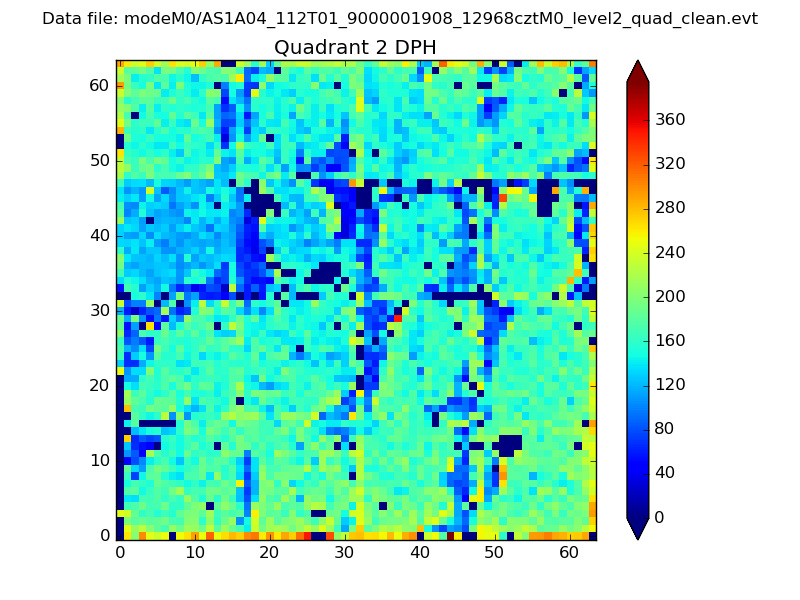
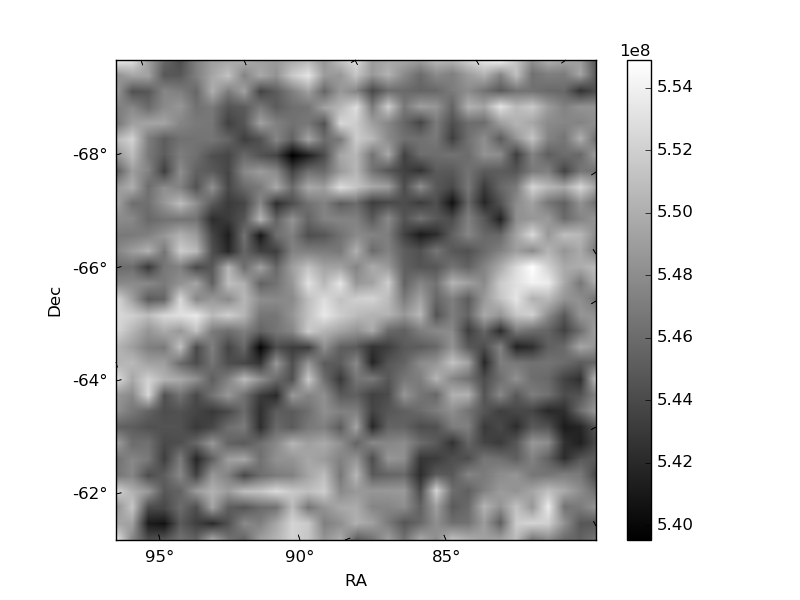
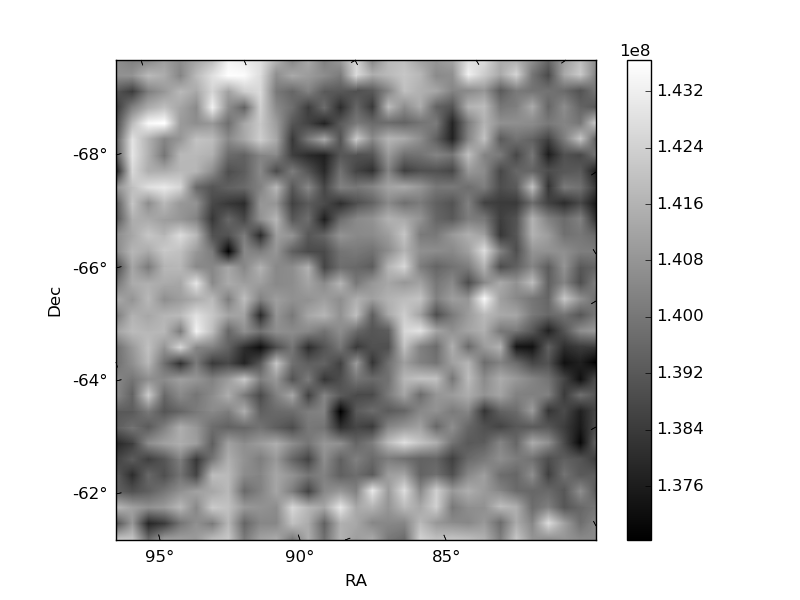
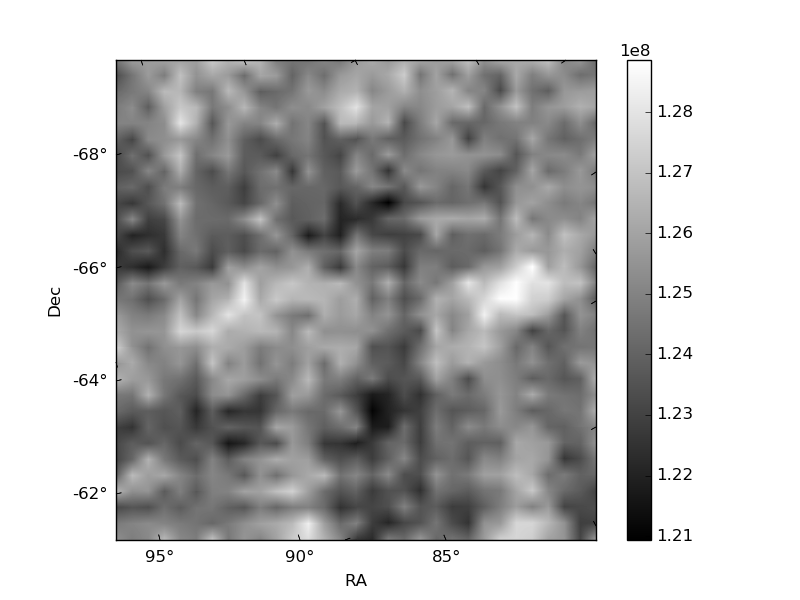
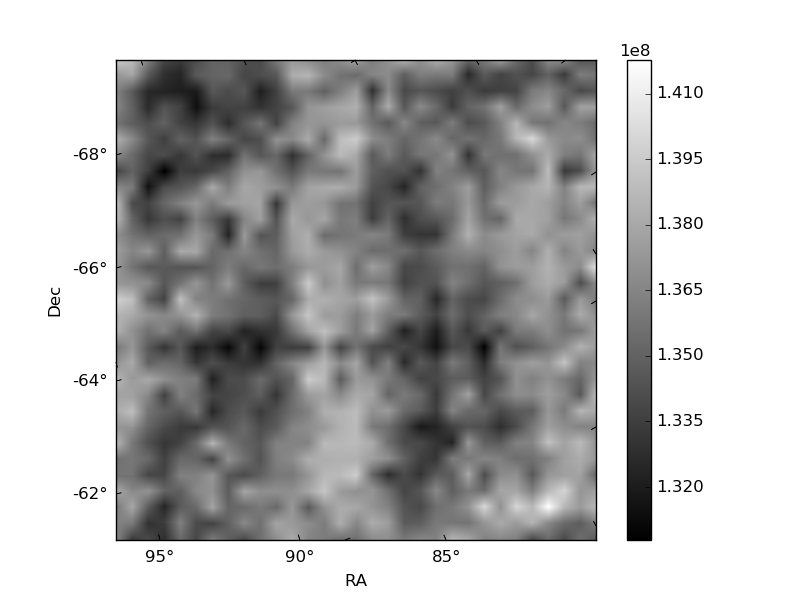
Histogram calculated using DETX and DETY for each event in the final _common_clean file
| Quadrant A | 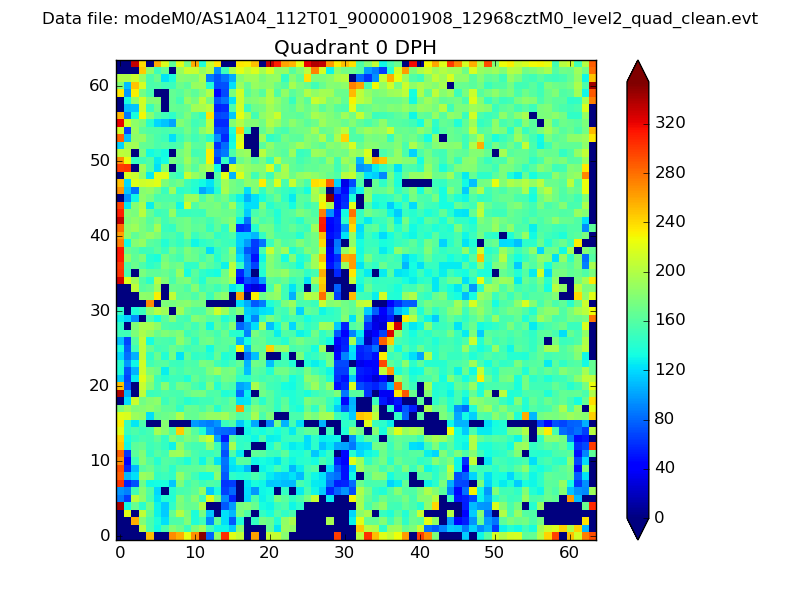 |
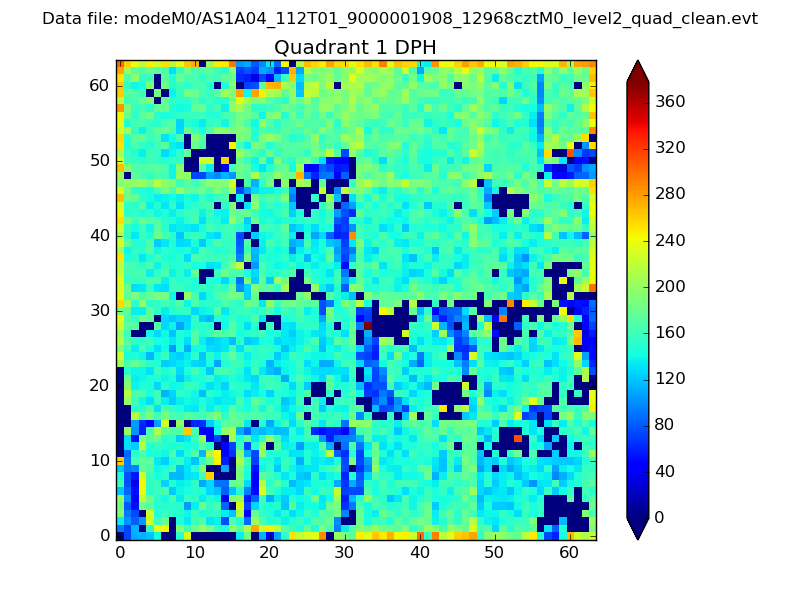 |
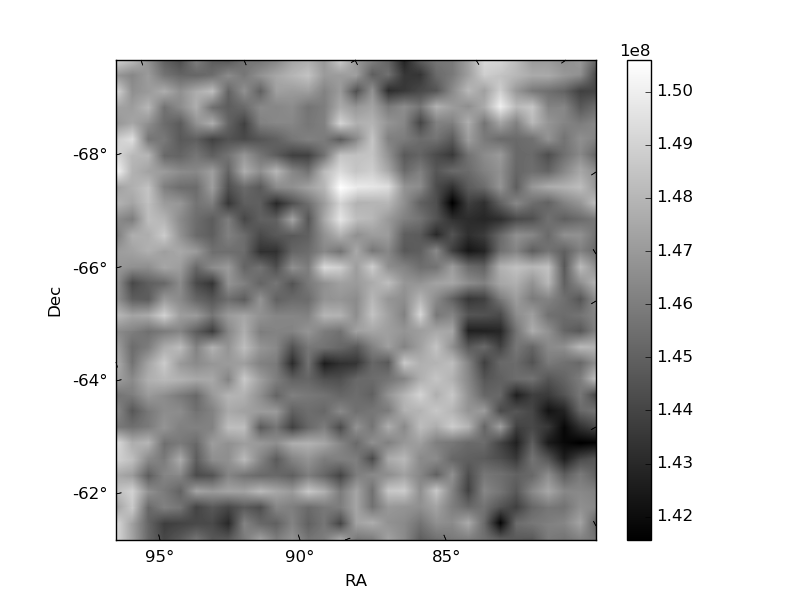
Quadrant B |
|---|---|---|---|
| Quadrant D | 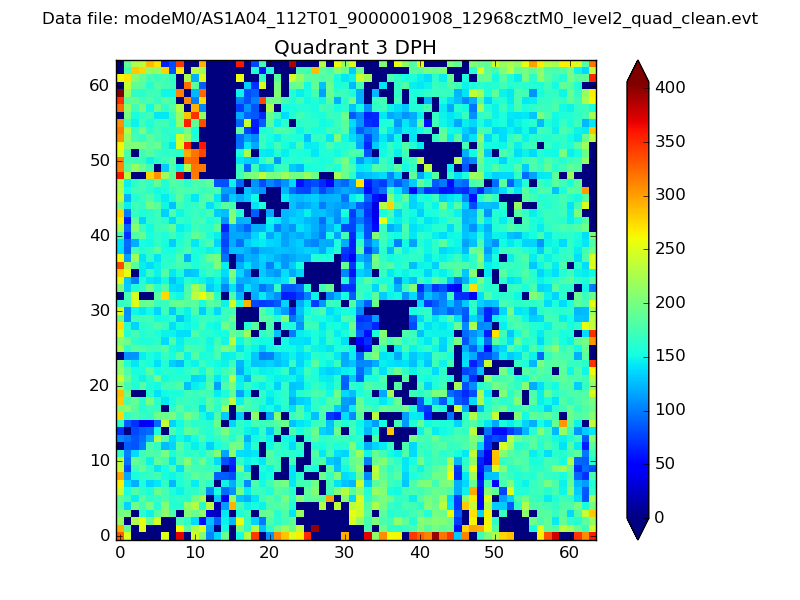 |
 |
Quadrant C |
| Plot type | Count rate plots | Images |
|---|---|---|
| Comparison with Poisson distribution Blue bars denote a histogram of data divided into 1 sec bins. Red curve is a Poisson curve with rate = median count rate of data. |
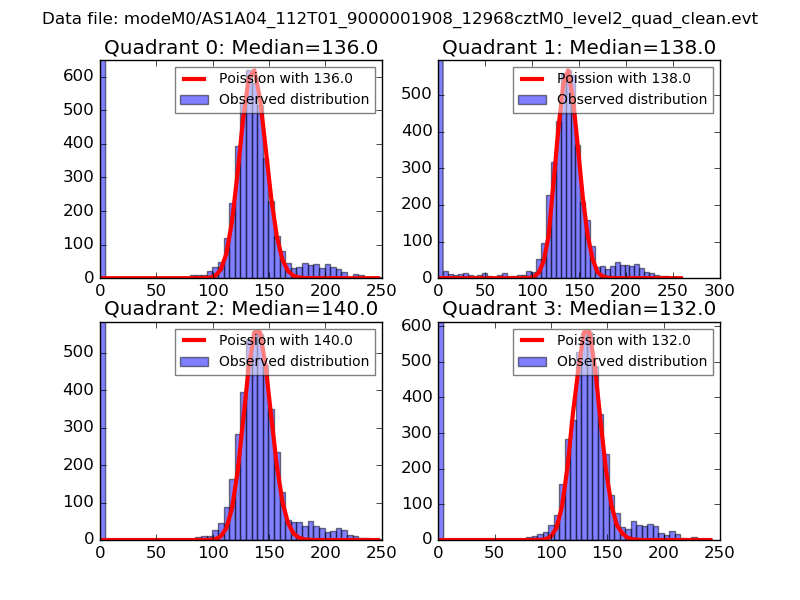 |
 |
| Quadrant-wise count rates Data is divided into 100 sec bins |
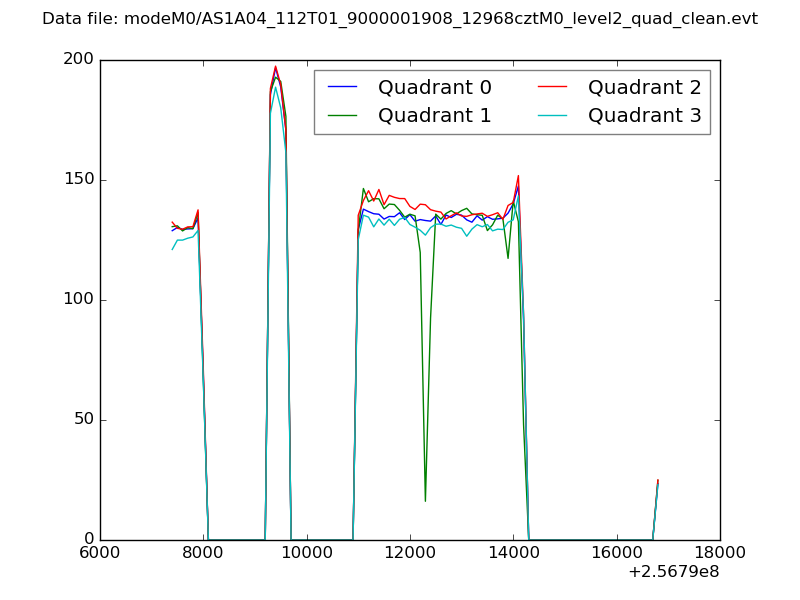 |
|
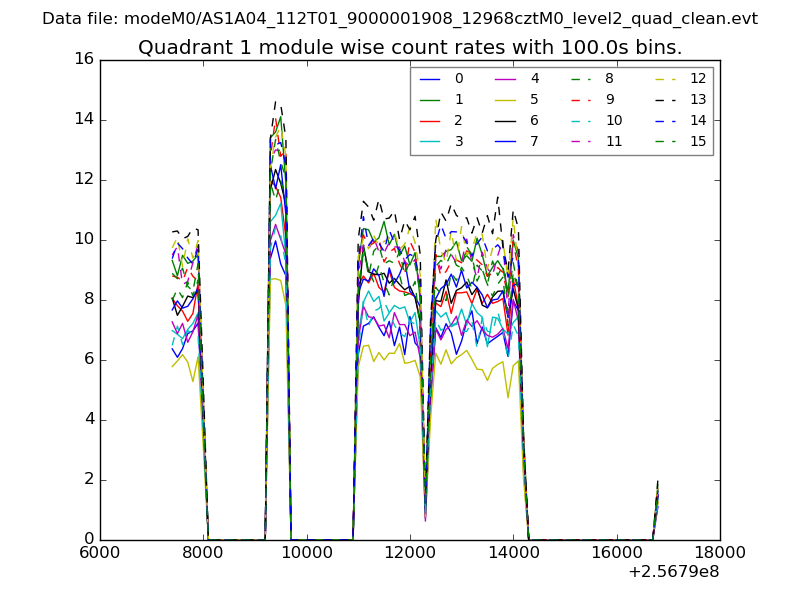
| Module-wise count rates for Quadrant A Data is divided into 100 sec bins |
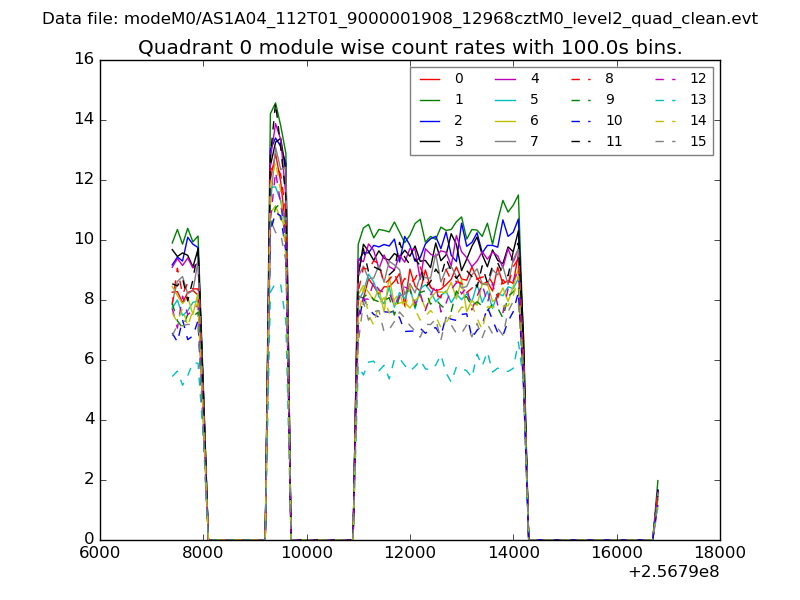 |
 |
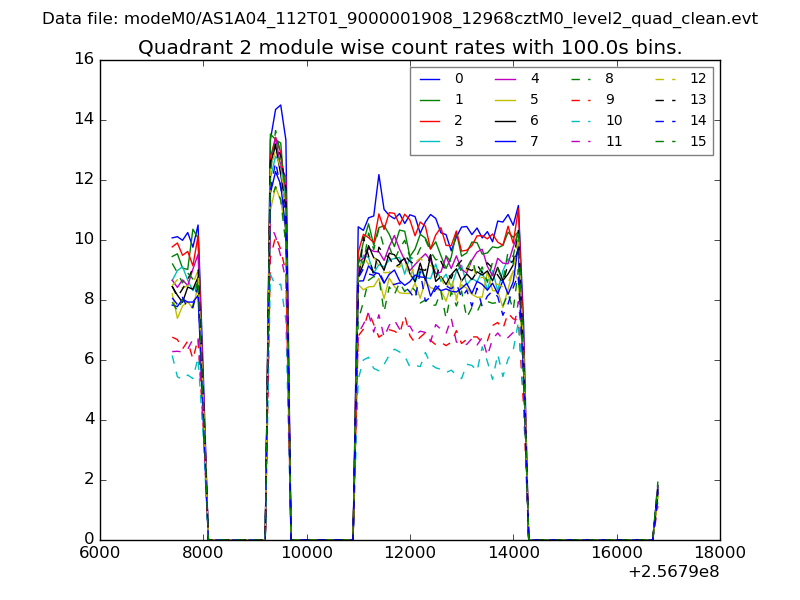
| Module-wise count rates for Quadrant B Data is divided into 100 sec bins |
 |
 |
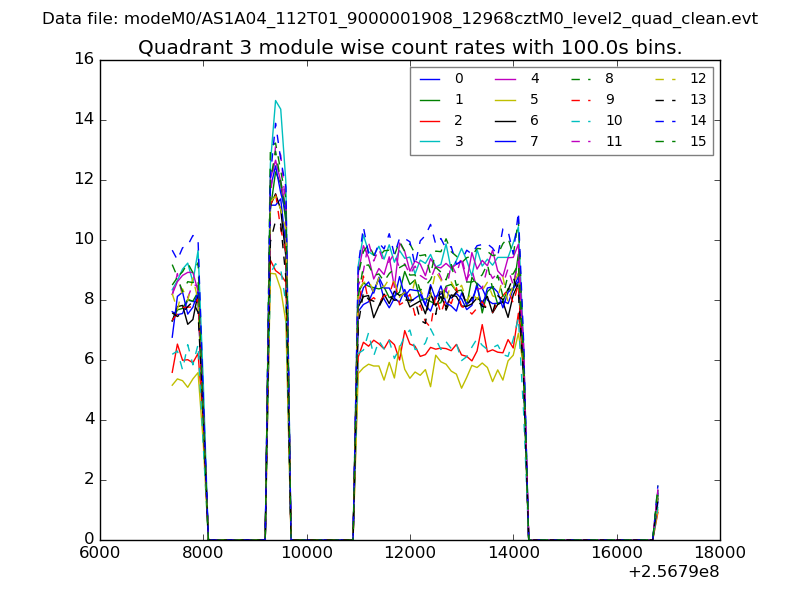
| Module-wise count rates for Quadrant C Data is divided into 100 sec bins |
 |
 |
| Module-wise count rates for Quadrant D Data is divided into 100 sec bins |
 |
 |
| Parameter | Plot |
|---|---|
| CZT HV Monitor | 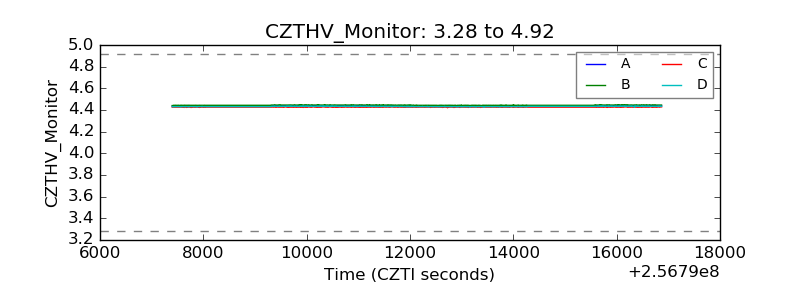 |
| D_VDD | 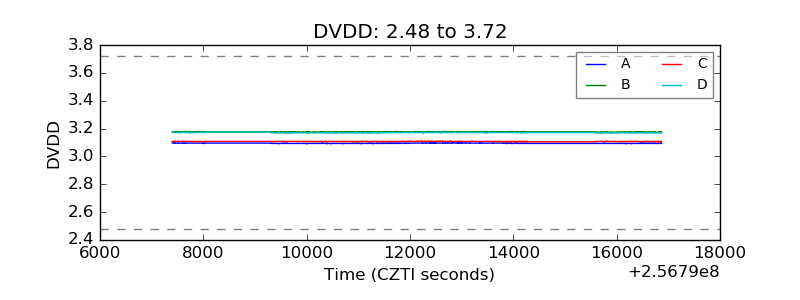 |
| Temperature 1 | 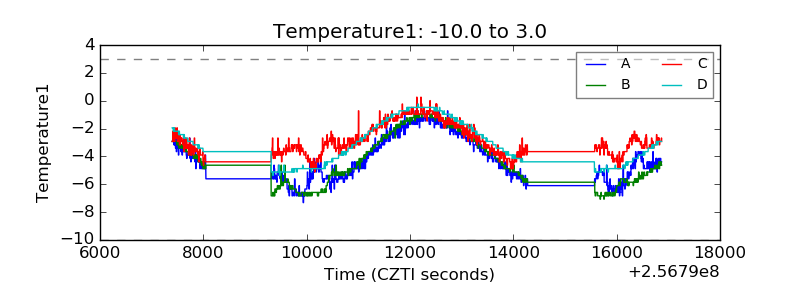 |
| Veto HV Monitor | 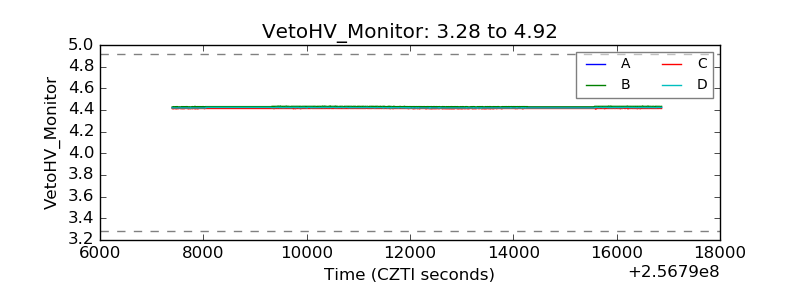 |
| Veto LLD | 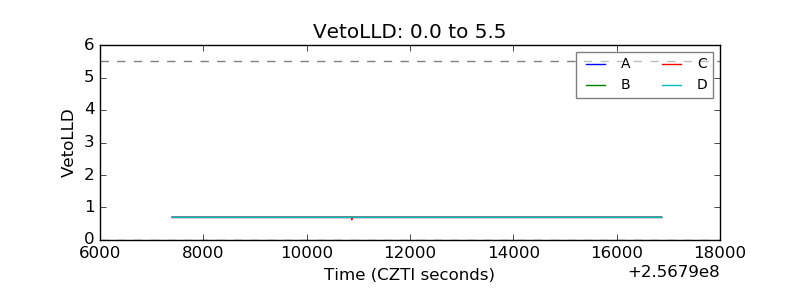 |
| Alpha Counter | 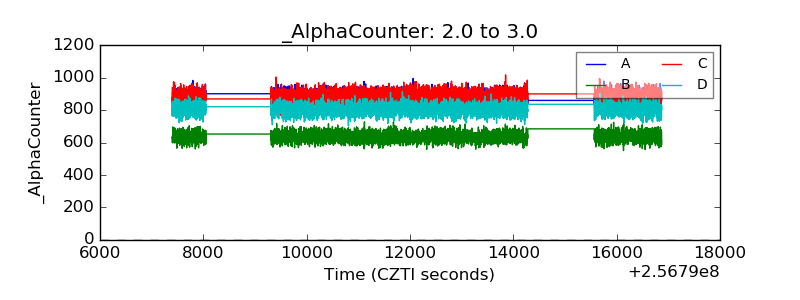 |
| _CPM_Rate | 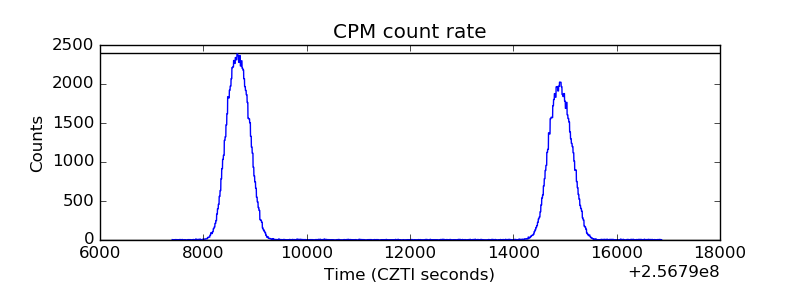 |
| CZT Counter | 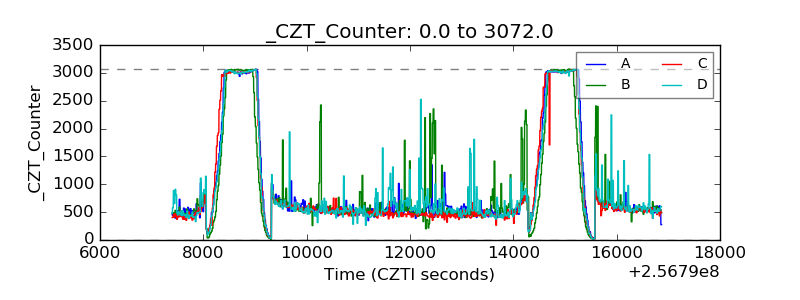 |
| +2.5 Volts monitor |  |
| +5 Volts monitor |  |
| _ROLL_ROT | 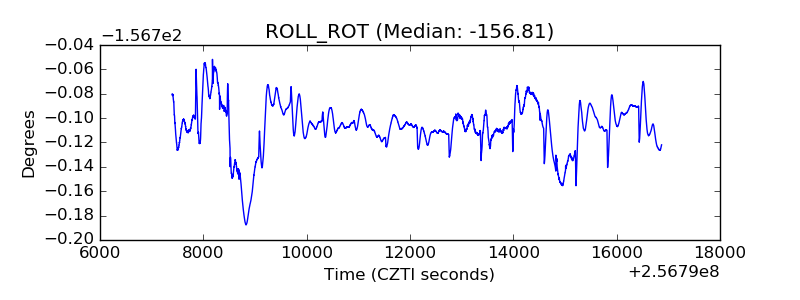 |
| _Roll_DEC | 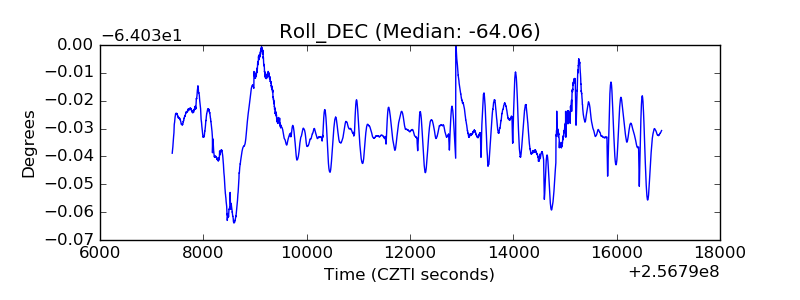 |
| _Roll_RA | 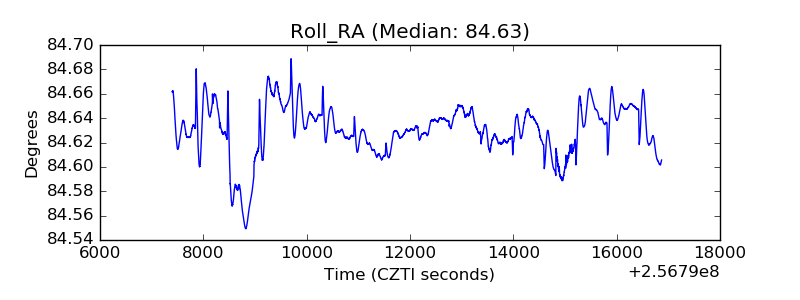 |
| Veto Counter | 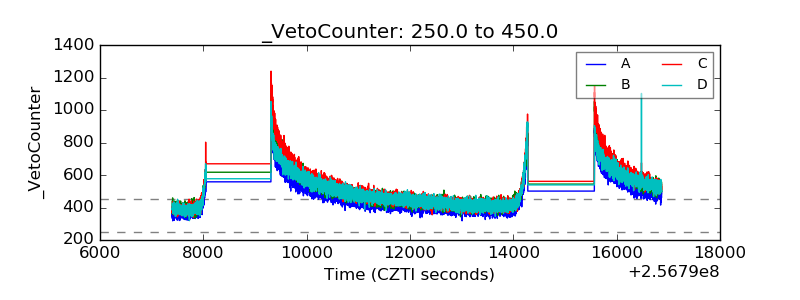 |