| Param | Original file | Final file |
|---|---|---|
| Filename | modeM0/AS1A04_112T01_9000001908_12970cztM0_level2.evt | modeM0/AS1A04_112T01_9000001908_12970cztM0_level2_quad_clean.evt |
| Size (bytes) | 542,410,560 | 114,626,880 |
| Size | 517.3 MB | 109.3 MB |
| Events in quadrant A | 3,892,580 | 761,186 |
| Events in quadrant B | 4,367,144 | 719,831 |
| Events in quadrant C | 3,433,200 | 773,176 |
| Events in quadrant D | 4,262,565 | 733,269 |
| Mode SS | |||
|---|---|---|---|
| Quadrant | BADHDUFLAG | Total packets | Discarded packets |
| A | 0 | 140 | 0 |
| B | 0 | 140 | 0 |
| C | 0 | 140 | 0 |
| D | 0 | 140 | 0 |
| Mode M0 | |||
|---|---|---|---|
| Quadrant | BADHDUFLAG | Total packets | Discarded packets |
| A | 0 | 15801 | 3 |
| B | 0 | 17271 | 2 |
| C | 0 | 14652 | 2 |
| D | 0 | 17049 | 2 |
| Mode M9 | |||
|---|---|---|---|
| Quadrant | BADHDUFLAG | Total packets | Discarded packets |
| A | 0 | 26 | 0 |
| B | 0 | 26 | 0 |
| C | 0 | 26 | 0 |
| D | 0 | 26 | 0 |
| Quadrant | Total seconds | Saturated seconds | Saturation percentage |
|---|---|---|---|
| A | 6953 | 223 | 3.207249% |
| B | 6953 | 687 | 9.880627% |
| C | 6953 | 190 | 2.732633% |
| D | 6953 | 341 | 4.904358% |
Noise dominated data is calculated using 1-second bins in cleaned event files. If a bin has >2000 counts, and if more than 50% of those come from <1% of pixels, then it is considered to be noise-dominated and hence unusable.
| Quadrant | # 1 sec bins | Bins with >0 counts | Bins with >2000 counts | High rate bins dominated by noise | Noise dominated (total time) | Noise dominated (detector-on time) | Marked lightcurve |
|---|---|---|---|---|---|---|---|
| A | 9469 | 6956 | 12 | 12 | 0.13% | 0.17% | 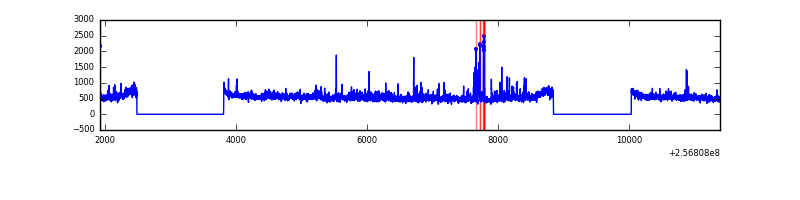 |
| B | 9469 | 6956 | 228 | 228 | 2.41% | 3.28% | 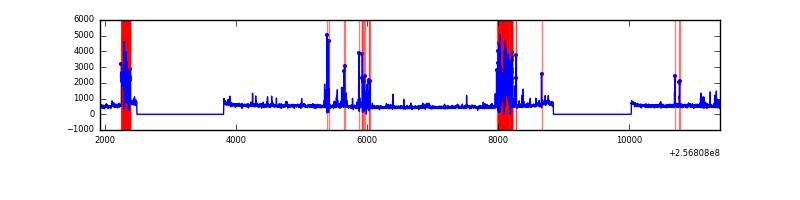 |
| C | 9469 | 6956 | 0 | 0 | 0.00% | 0.00% | 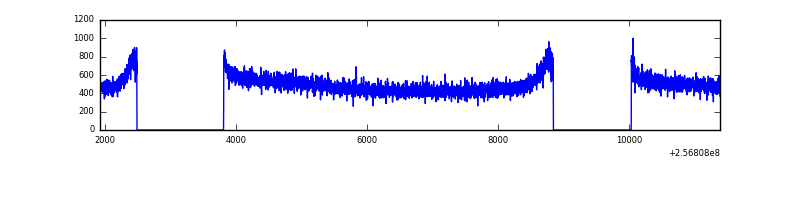 |
| D | 9469 | 6956 | 138 | 138 | 1.46% | 1.98% | 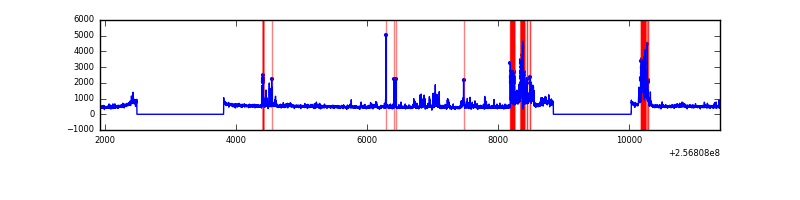 |
Top three noisy pixels from each quadrant. If the there are fewer than three noisy pixels in the level2.evt file, extra rows are filled as -1
| Pixel properties | Quadrant properties | ||||||
|---|---|---|---|---|---|---|---|
| Quadrant | DetID | PixID | Counts | Sigma | Mean | Median | Sigma |
| A | 12 | 189 | 108992 | 605.73 | 901 | 881 | 178.5 |
| A | 1 | 162 | 99659 | 553.43 | 901 | 881 | 178.5 |
| A | 1 | 178 | 43594 | 239.31 | 901 | 881 | 178.5 |
| B | 4 | 239 | 856768 | 5382.24 | 851 | 829 | 159.0 |
| B | 3 | 64 | 78689 | 489.59 | 851 | 829 | 159.0 |
| B | 0 | 219 | 54183 | 335.5 | 851 | 829 | 159.0 |
| C | 13 | 61 | 6283 | 27.22 | 879 | 879 | 198.5 |
| C | 0 | 207 | 2997 | 10.67 | 879 | 879 | 198.5 |
| C | 8 | 222 | 2602 | 8.68 | 879 | 879 | 198.5 |
| D | 1 | 52 | 380914 | 1857.66 | 870 | 847 | 204.6 |
| D | 2 | 14 | 298753 | 1456.08 | 870 | 847 | 204.6 |
| D | 8 | 195 | 209248 | 1018.6 | 870 | 847 | 204.6 |
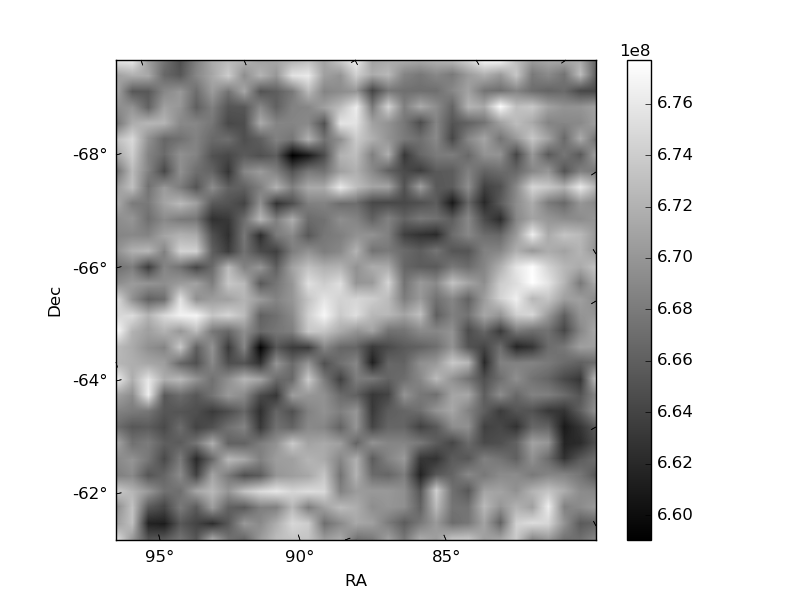
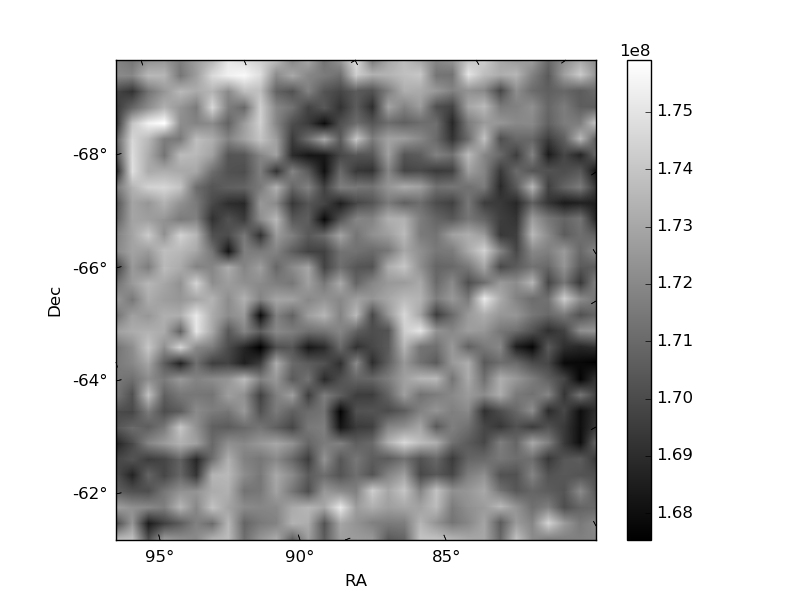
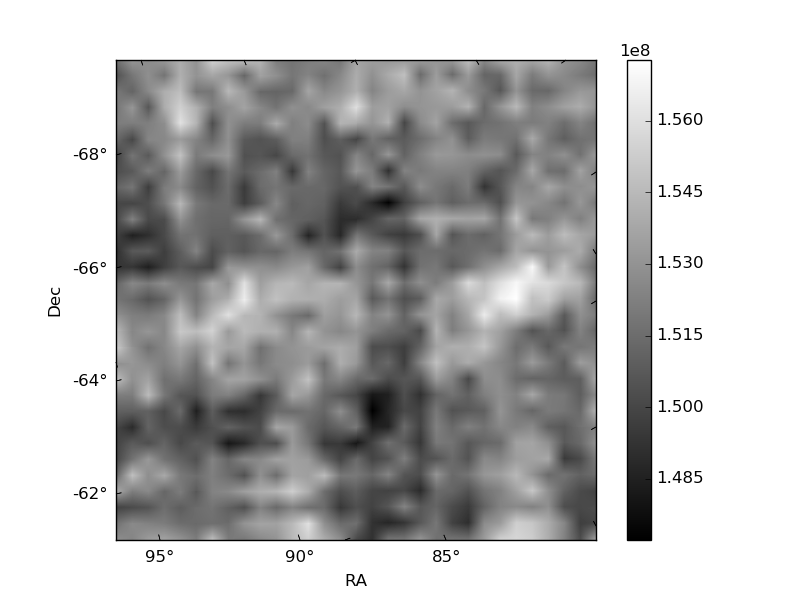
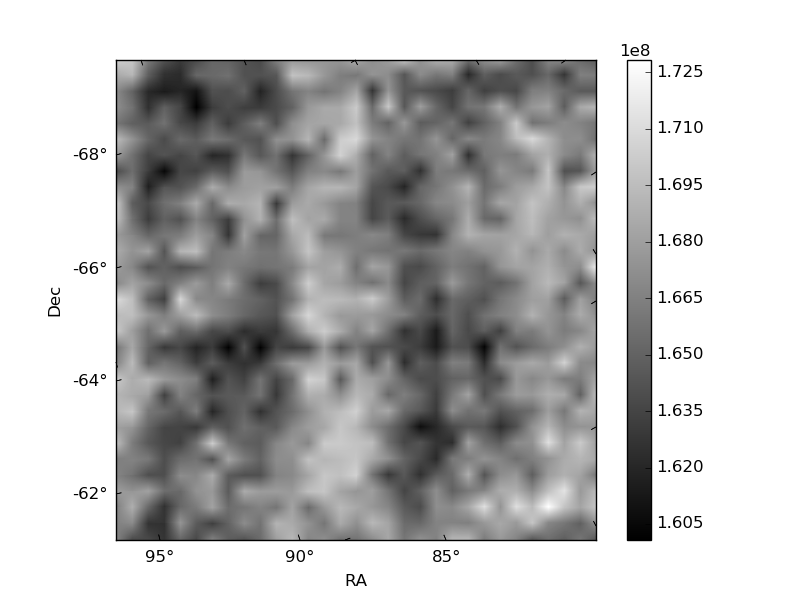
Histogram calculated using DETX and DETY for each event in the final _common_clean file
| Quadrant A | 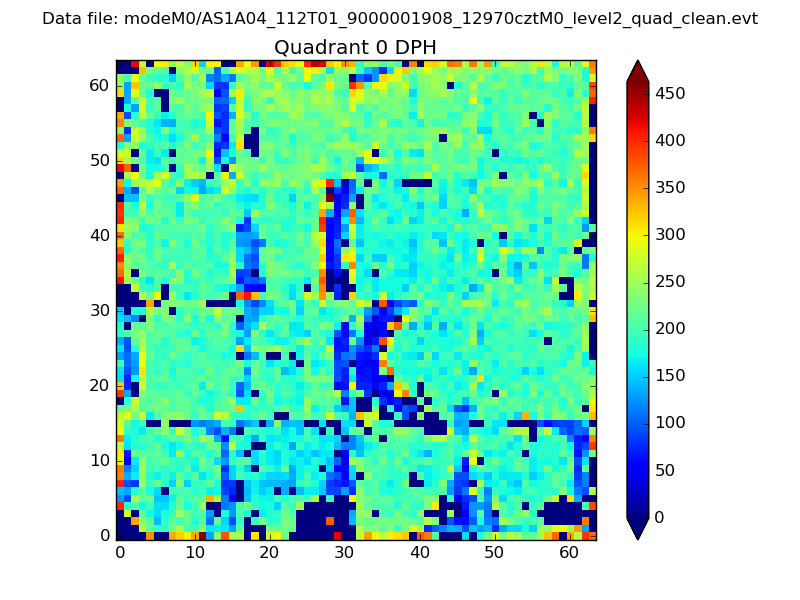 |
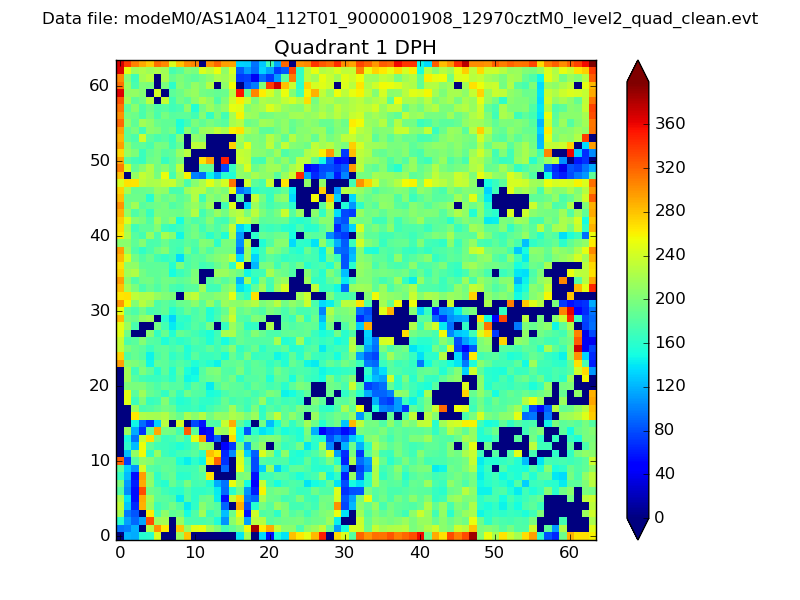 |
Quadrant B |
|---|---|---|---|
| Quadrant D | 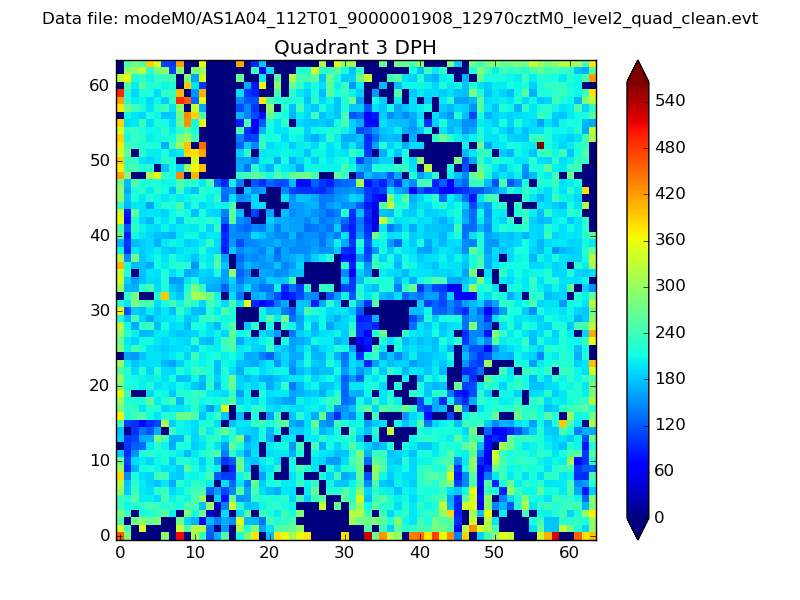 |
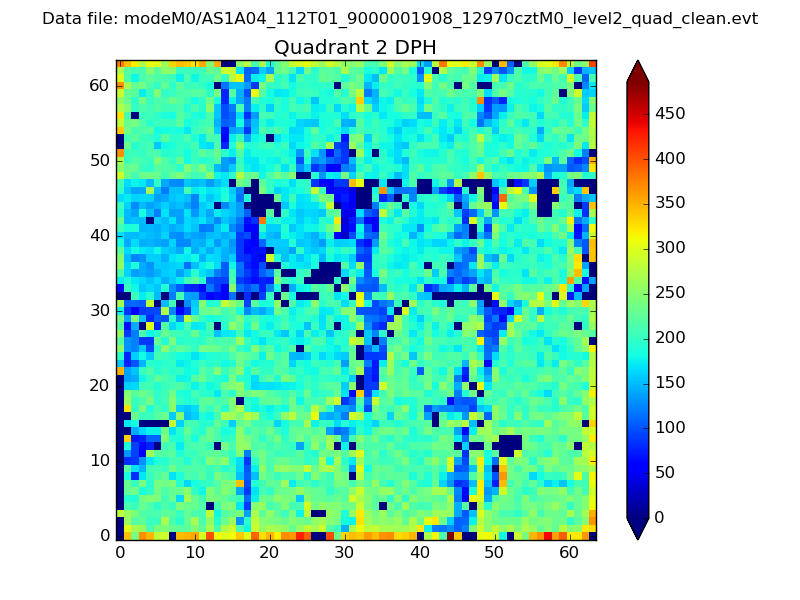 |
Quadrant C |
| Plot type | Count rate plots | Images |
|---|---|---|
| Comparison with Poisson distribution Blue bars denote a histogram of data divided into 1 sec bins. Red curve is a Poisson curve with rate = median count rate of data. |
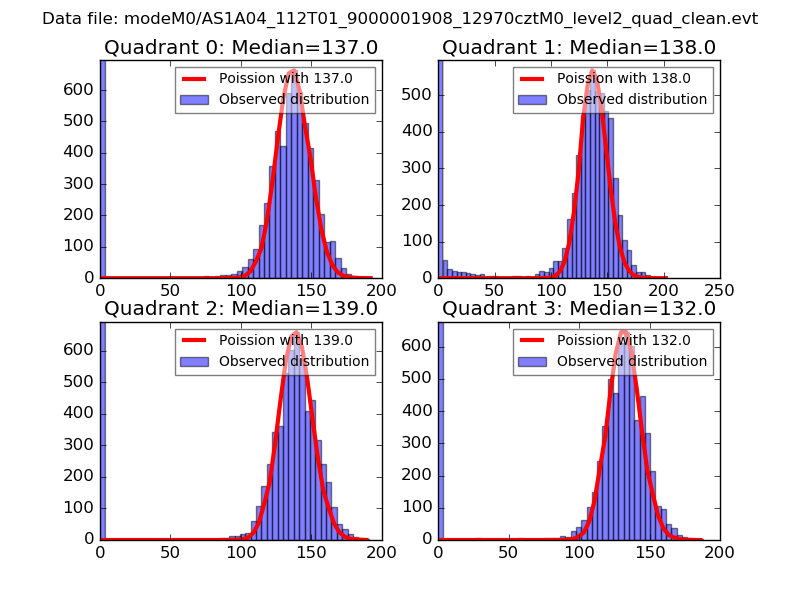 |
 |
| Quadrant-wise count rates Data is divided into 100 sec bins |
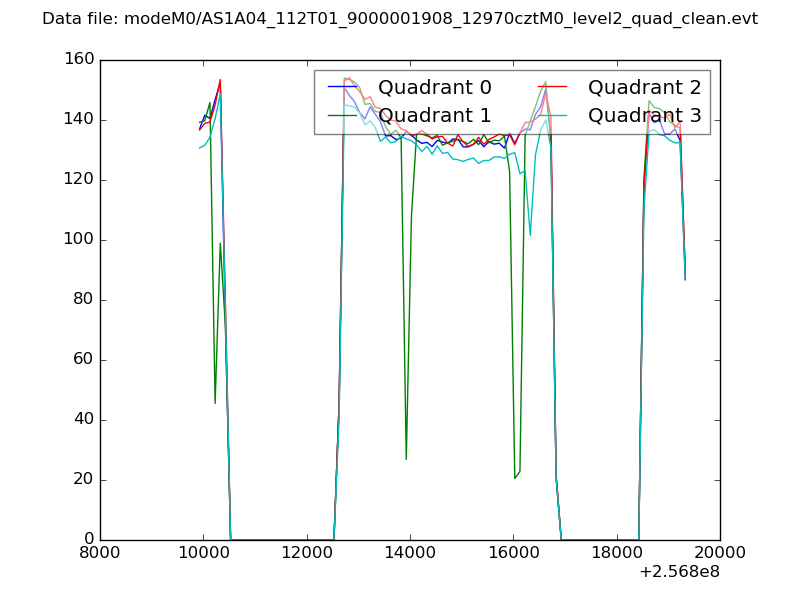 |
|
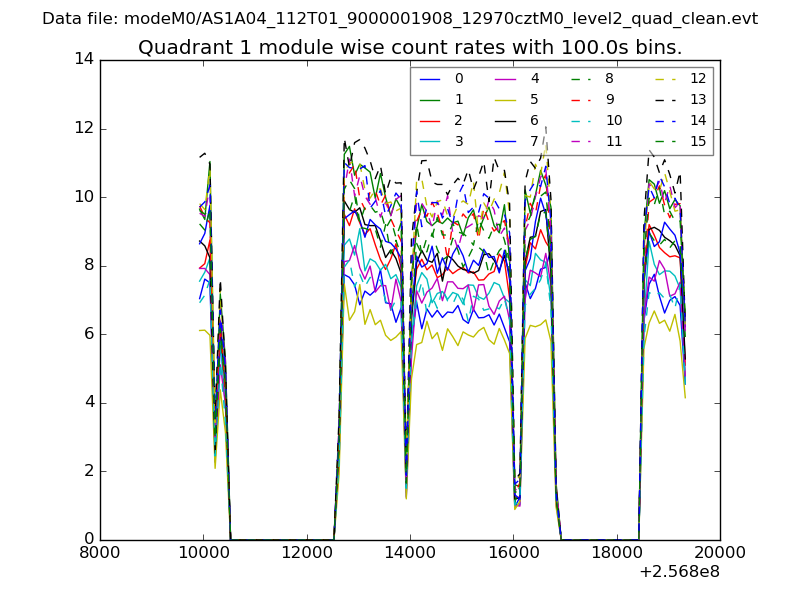
| Module-wise count rates for Quadrant A Data is divided into 100 sec bins |
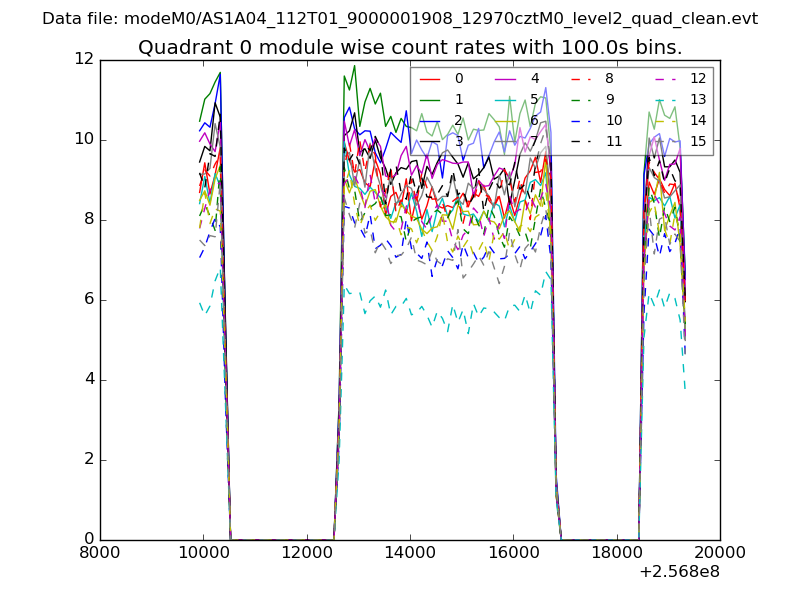 |
 |
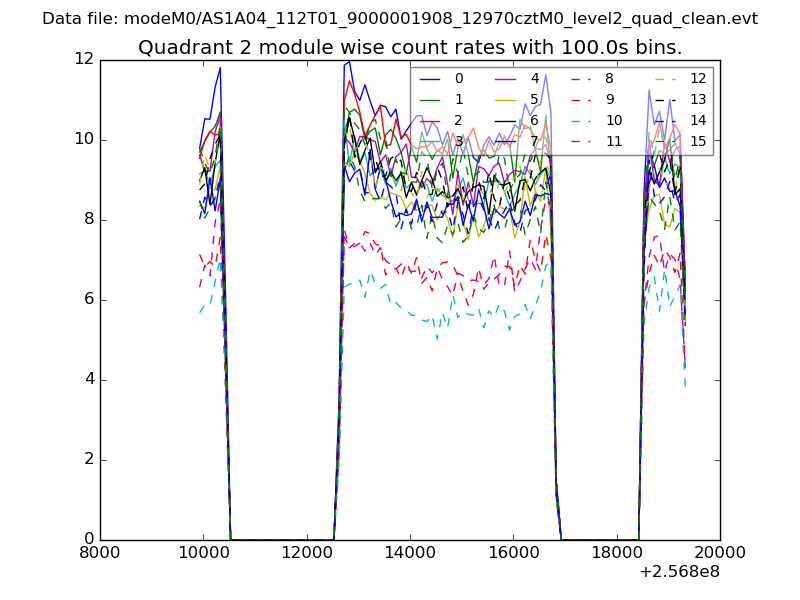
| Module-wise count rates for Quadrant B Data is divided into 100 sec bins |
 |
 |
| Module-wise count rates for Quadrant C Data is divided into 100 sec bins |
 |
 |
| Module-wise count rates for Quadrant D Data is divided into 100 sec bins |
 |
 |
| Parameter | Plot |
|---|---|
| CZT HV Monitor | 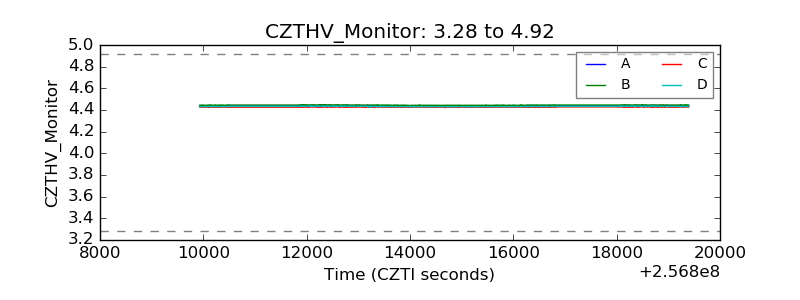 |
| D_VDD | 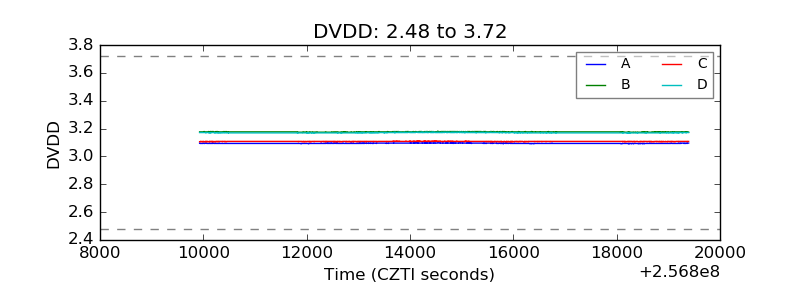 |
| Temperature 1 |  |
| Veto HV Monitor |  |
| Veto LLD | 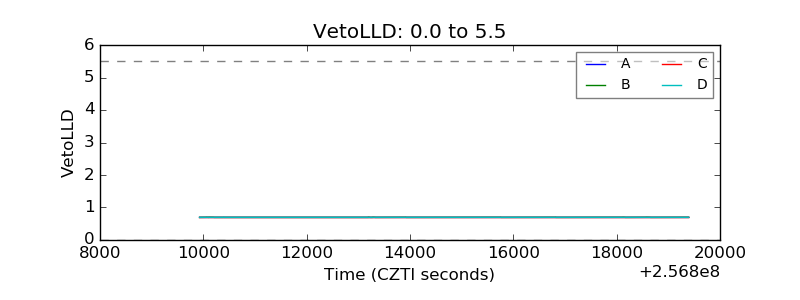 |
| Alpha Counter | 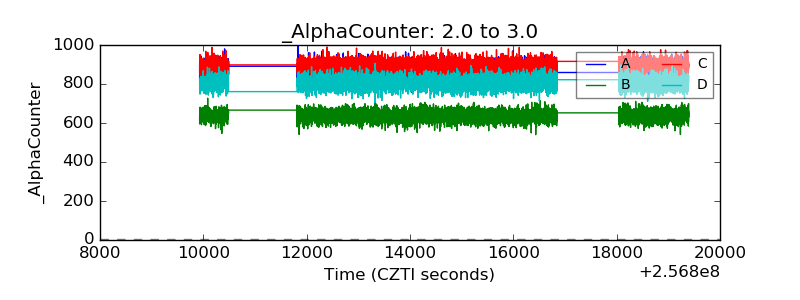 |
| _CPM_Rate | 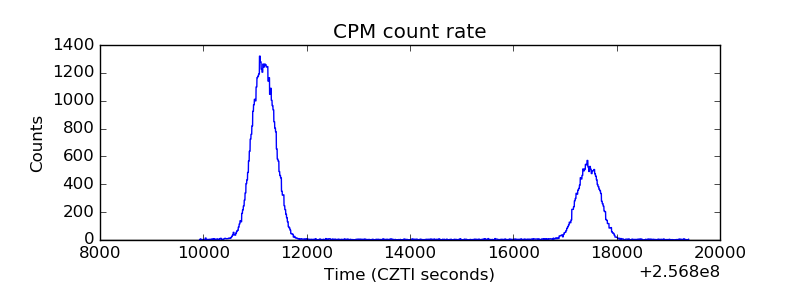 |
| CZT Counter | 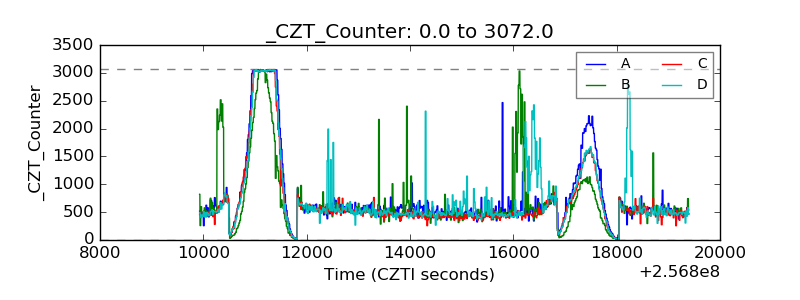 |
| +2.5 Volts monitor |  |
| +5 Volts monitor | 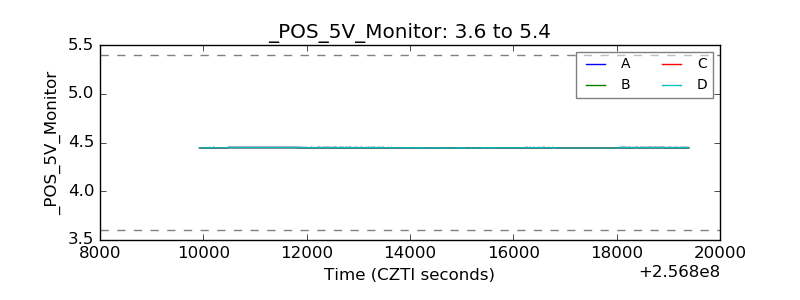 |
| _ROLL_ROT | 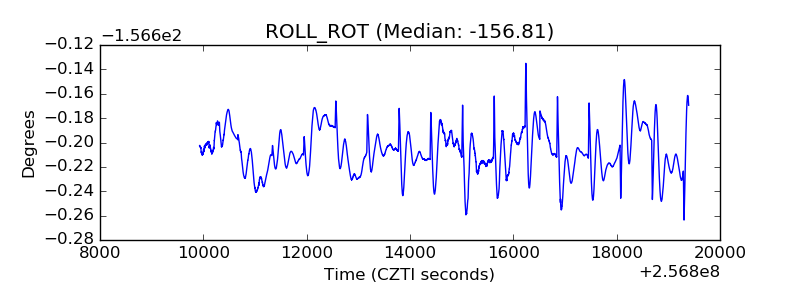 |
| _Roll_DEC |  |
| _Roll_RA | 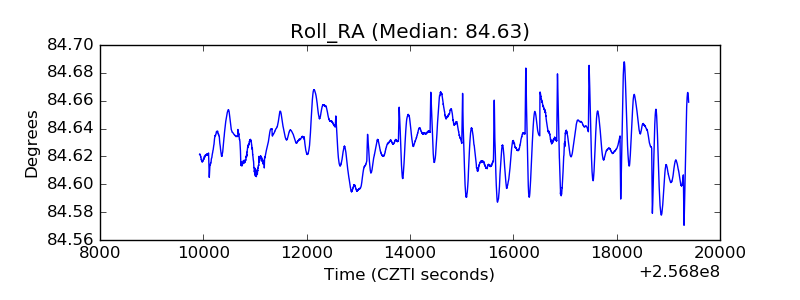 |
| Veto Counter |  |