| Param | Original file | Final file |
|---|---|---|
| Filename | modeM0/AS1A04_112T01_9000001908_12973cztM0_level2.evt | modeM0/AS1A04_112T01_9000001908_12973cztM0_level2_quad_clean.evt |
| Size (bytes) | 1,042,128,000 | 202,343,040 |
| Size | 993.9 MB | 193.0 MB |
| Events in quadrant A | 7,366,052 | 1,338,119 |
| Events in quadrant B | 8,476,401 | 1,272,428 |
| Events in quadrant C | 7,279,118 | 1,302,793 |
| Events in quadrant D | 7,535,927 | 1,291,991 |
| Mode SS | |||
|---|---|---|---|
| Quadrant | BADHDUFLAG | Total packets | Discarded packets |
| A | 0 | 272 | 0 |
| B | 0 | 272 | 0 |
| C | 0 | 272 | 0 |
| D | 0 | 272 | 0 |
| Mode M0 | |||
|---|---|---|---|
| Quadrant | BADHDUFLAG | Total packets | Discarded packets |
| A | 0 | 30198 | 3 |
| B | 0 | 33955 | 2 |
| C | 0 | 31022 | 2 |
| D | 0 | 31397 | 2 |
| Mode M9 | |||
|---|---|---|---|
| Quadrant | BADHDUFLAG | Total packets | Discarded packets |
| A | 0 | 6 | 0 |
| B | 0 | 6 | 0 |
| C | 0 | 6 | 0 |
| D | 0 | 6 | 0 |
| Quadrant | Total seconds | Saturated seconds | Saturation percentage |
|---|---|---|---|
| A | 13352 | 255 | 1.909826% |
| B | 13352 | 1210 | 9.062313% |
| C | 13352 | 565 | 4.231576% |
| D | 13352 | 270 | 2.022169% |
Noise dominated data is calculated using 1-second bins in cleaned event files. If a bin has >2000 counts, and if more than 50% of those come from <1% of pixels, then it is considered to be noise-dominated and hence unusable.
| Quadrant | # 1 sec bins | Bins with >0 counts | Bins with >2000 counts | High rate bins dominated by noise | Noise dominated (total time) | Noise dominated (detector-on time) | Marked lightcurve |
|---|---|---|---|---|---|---|---|
| A | 14003 | 13354 | 63 | 63 | 0.45% | 0.47% | 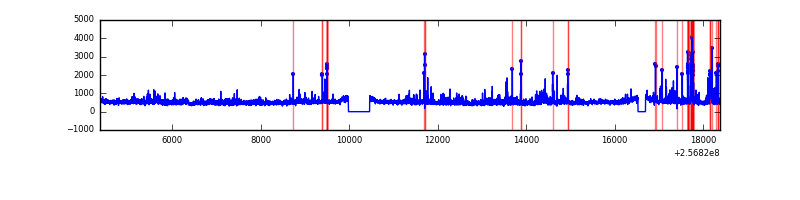 |
| B | 14003 | 13354 | 558 | 558 | 3.98% | 4.18% | 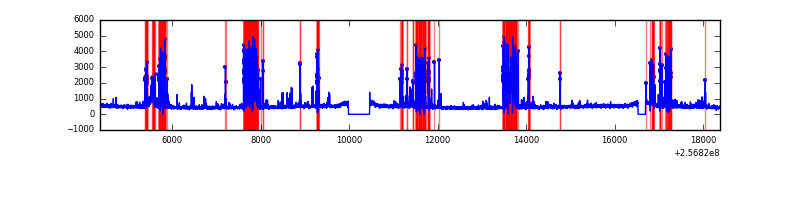 |
| C | 14003 | 13354 | 439 | 439 | 3.14% | 3.29% |  |
| D | 14003 | 13354 | 132 | 132 | 0.94% | 0.99% | 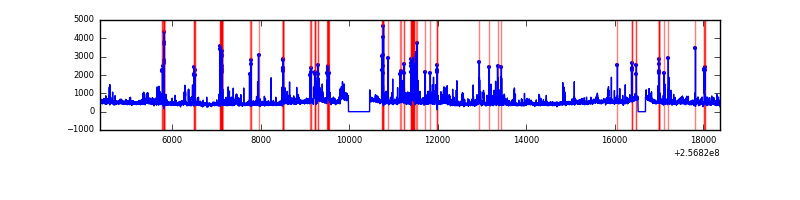 |
Top three noisy pixels from each quadrant. If the there are fewer than three noisy pixels in the level2.evt file, extra rows are filled as -1
| Pixel properties | Quadrant properties | ||||||
|---|---|---|---|---|---|---|---|
| Quadrant | DetID | PixID | Counts | Sigma | Mean | Median | Sigma |
| A | 12 | 189 | 384386 | 1221.22 | 1575 | 1542 | 313.5 |
| A | 15 | 223 | 243642 | 772.27 | 1575 | 1542 | 313.5 |
| A | 1 | 162 | 212261 | 672.16 | 1575 | 1542 | 313.5 |
| B | 4 | 239 | 2059091 | 7292.02 | 1507 | 1471 | 282.2 |
| B | 3 | 64 | 259716 | 915.2 | 1507 | 1471 | 282.2 |
| B | 0 | 85 | 142619 | 500.22 | 1507 | 1471 | 282.2 |
| C | 0 | 207 | 1430656 | 4158.2 | 1498 | 1501 | 343.7 |
| C | 13 | 61 | 11165 | 28.12 | 1498 | 1501 | 343.7 |
| C | 14 | 234 | 5009 | 10.21 | 1498 | 1501 | 343.7 |
| D | 1 | 52 | 1079637 | 2967.49 | 1524 | 1477 | 363.3 |
| D | 8 | 195 | 534143 | 1466.09 | 1524 | 1477 | 363.3 |
| D | 2 | 234 | 58811 | 157.8 | 1524 | 1477 | 363.3 |
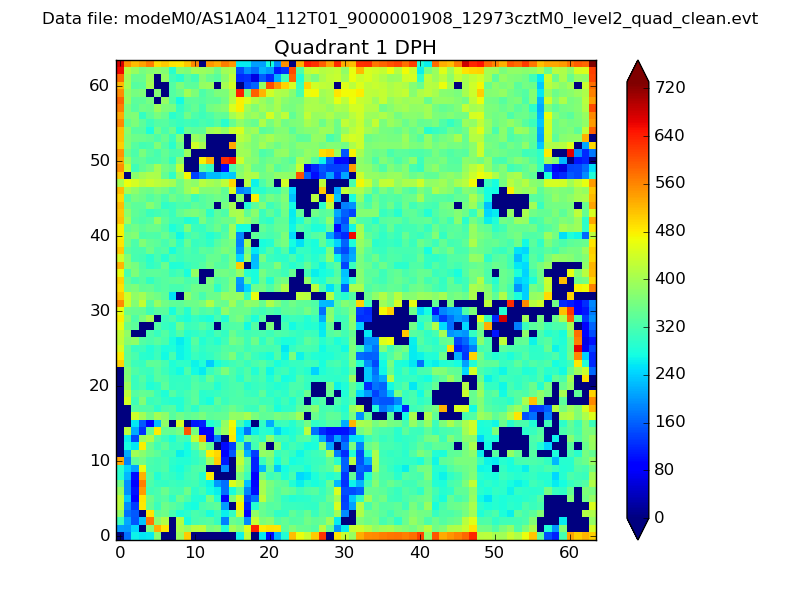
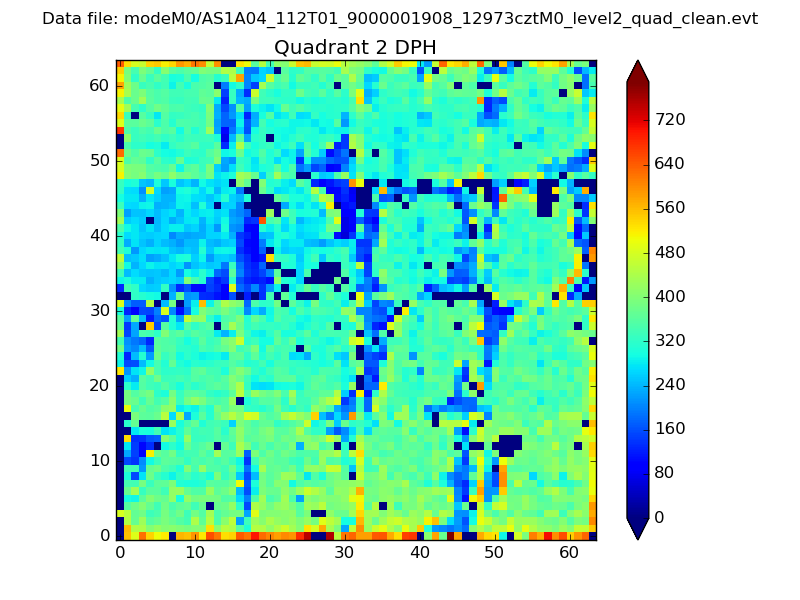
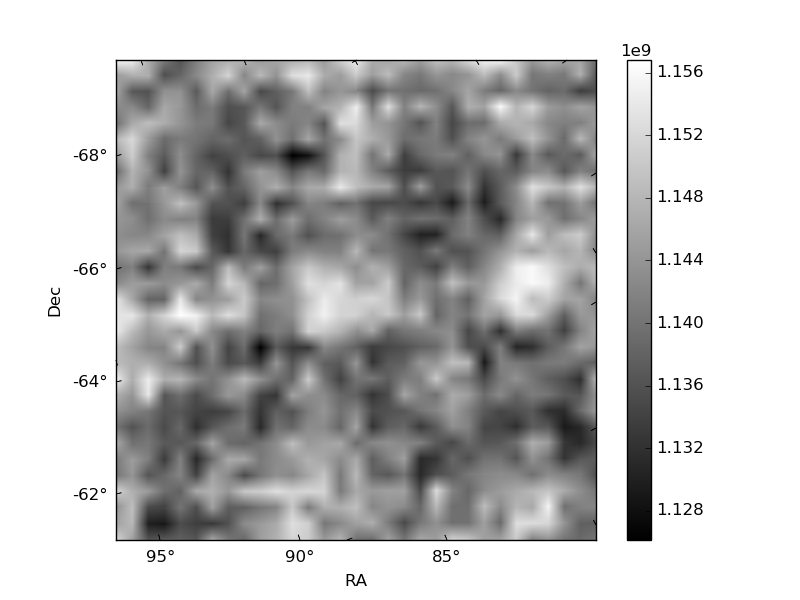
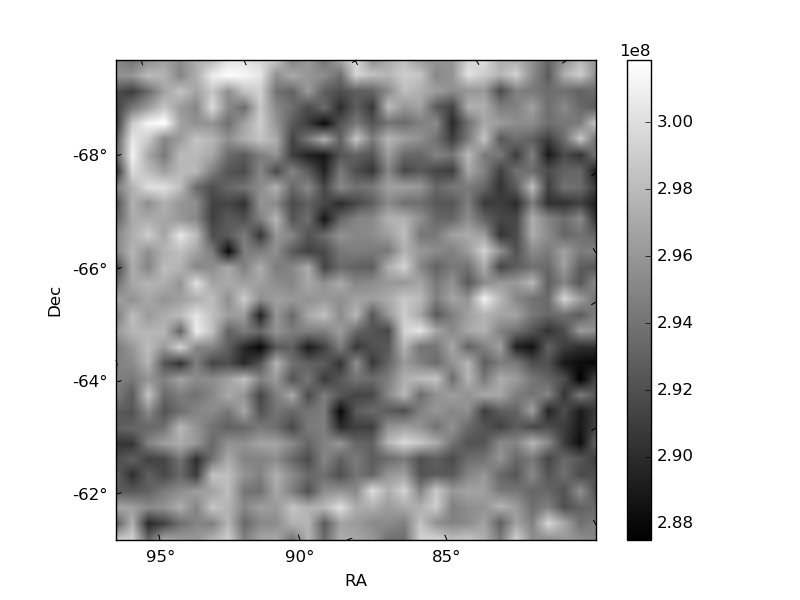
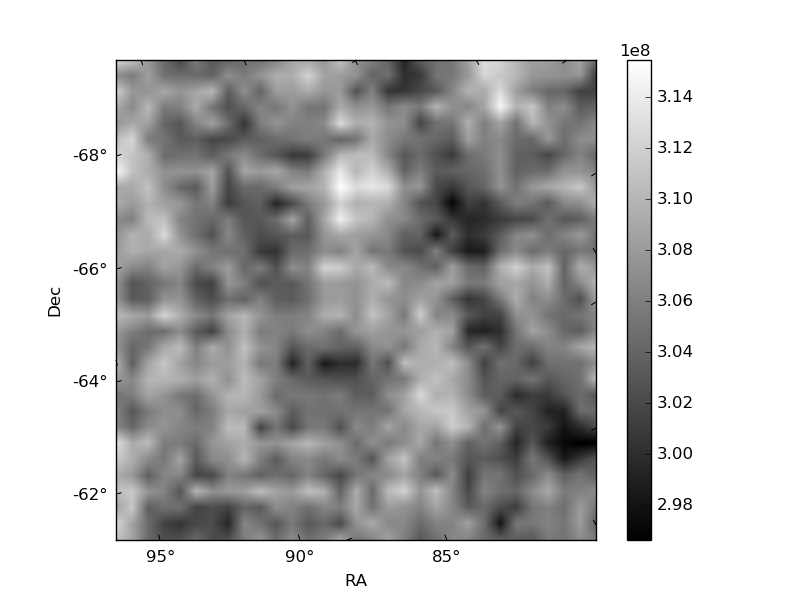
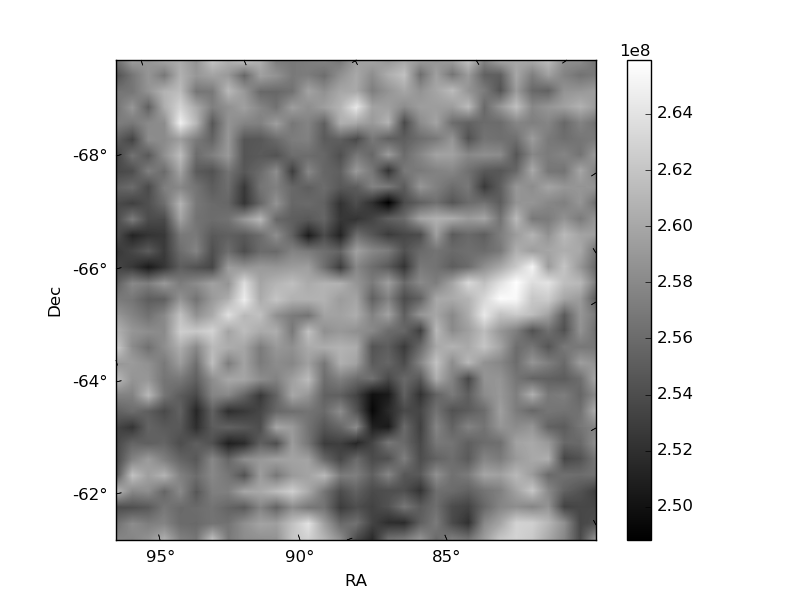
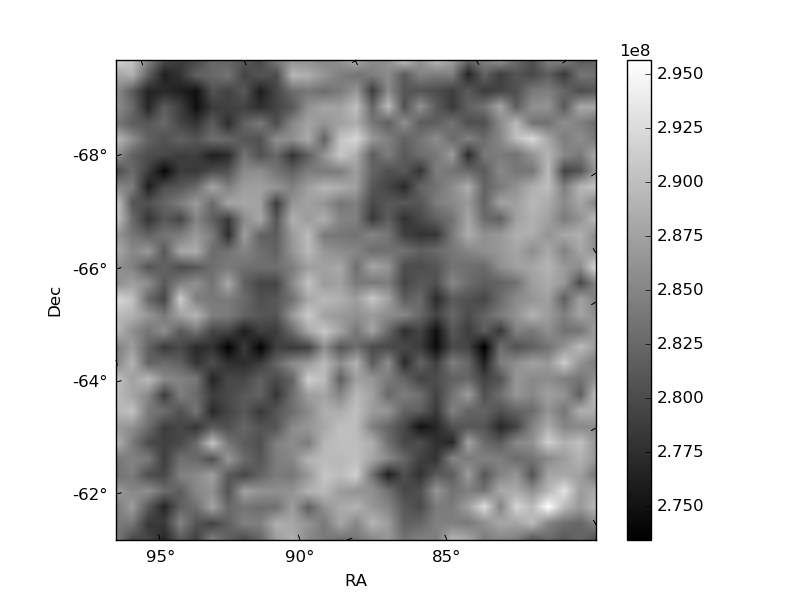
Histogram calculated using DETX and DETY for each event in the final _common_clean file
| Quadrant A | 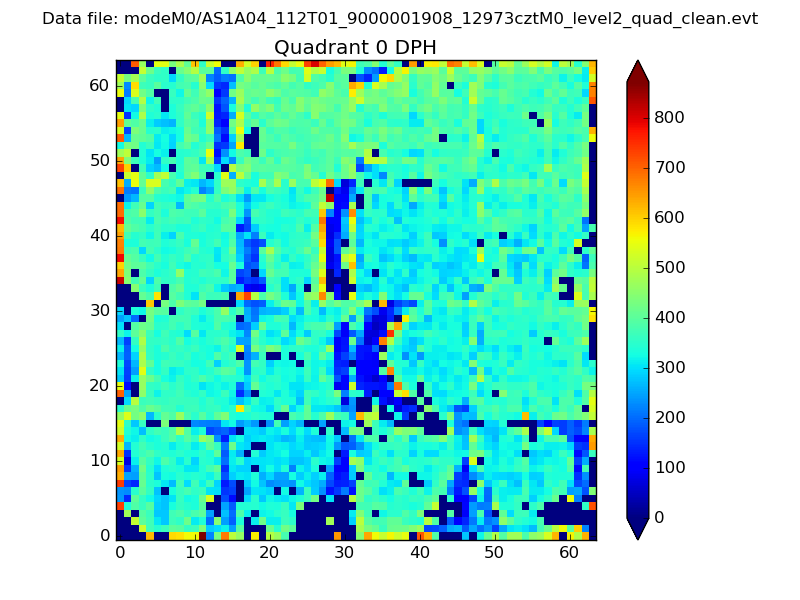 |
 |
Quadrant B |
|---|---|---|---|
| Quadrant D | 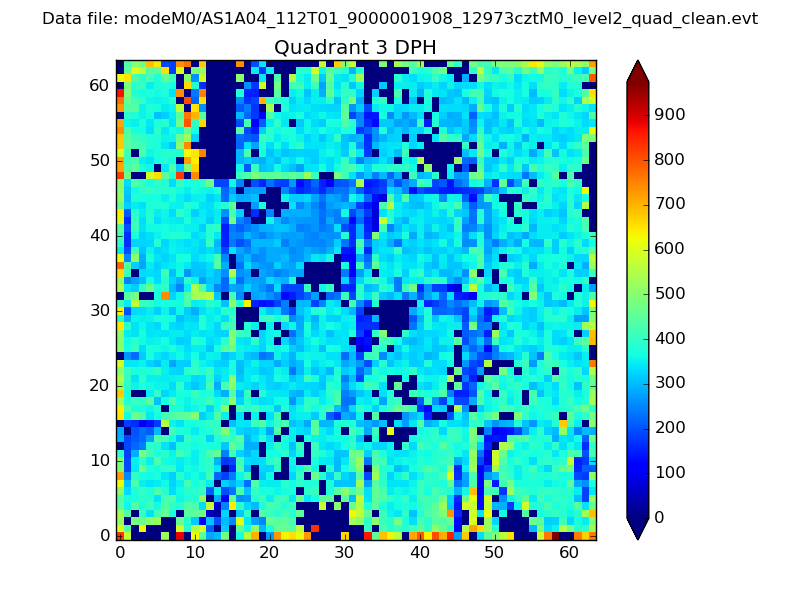 |
 |
Quadrant C |
| Plot type | Count rate plots | Images |
|---|---|---|
| Comparison with Poisson distribution Blue bars denote a histogram of data divided into 1 sec bins. Red curve is a Poisson curve with rate = median count rate of data. |
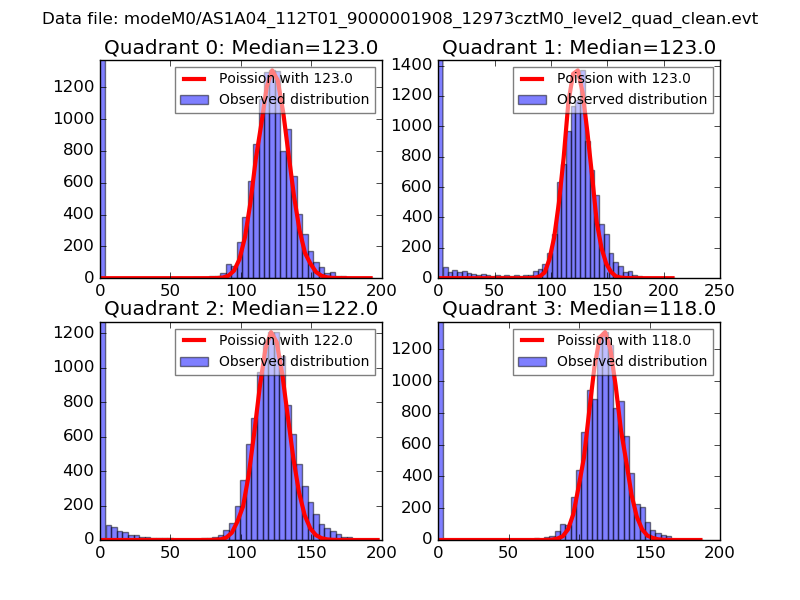 |
 |
| Quadrant-wise count rates Data is divided into 100 sec bins |
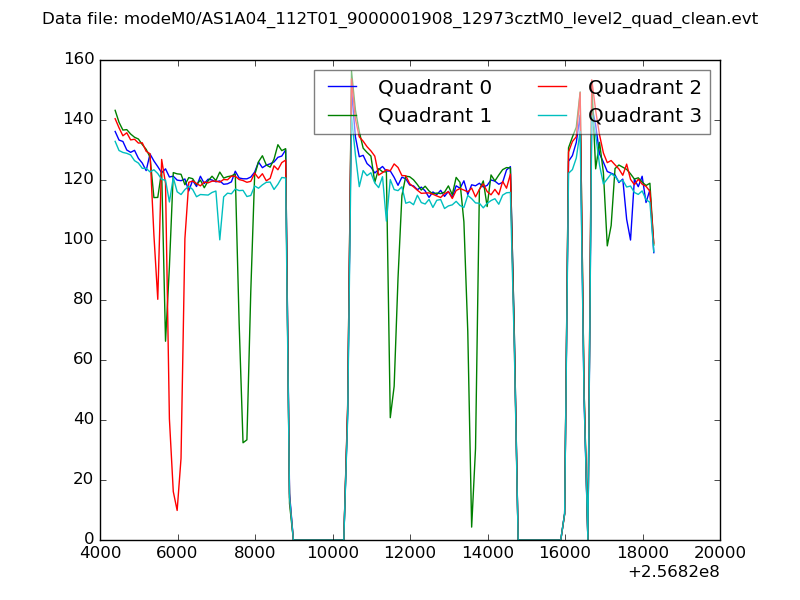 |
|
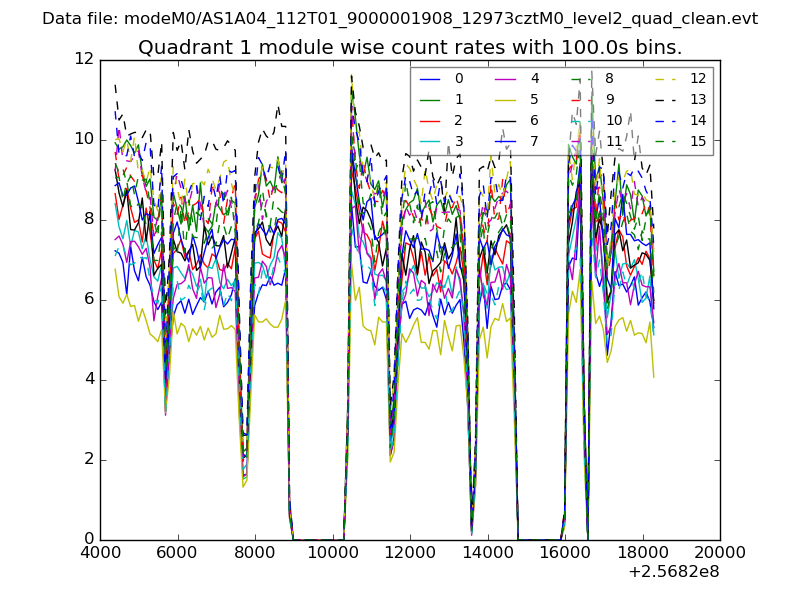
| Module-wise count rates for Quadrant A Data is divided into 100 sec bins |
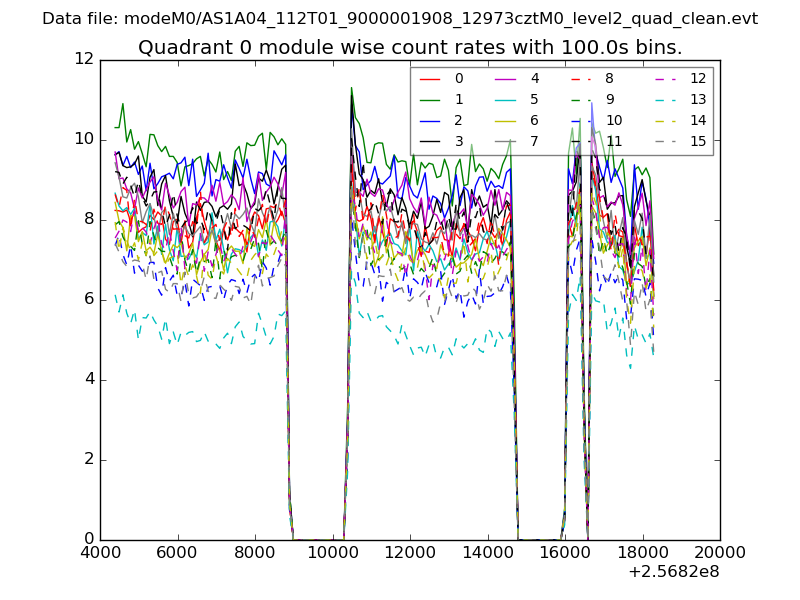 |
 |
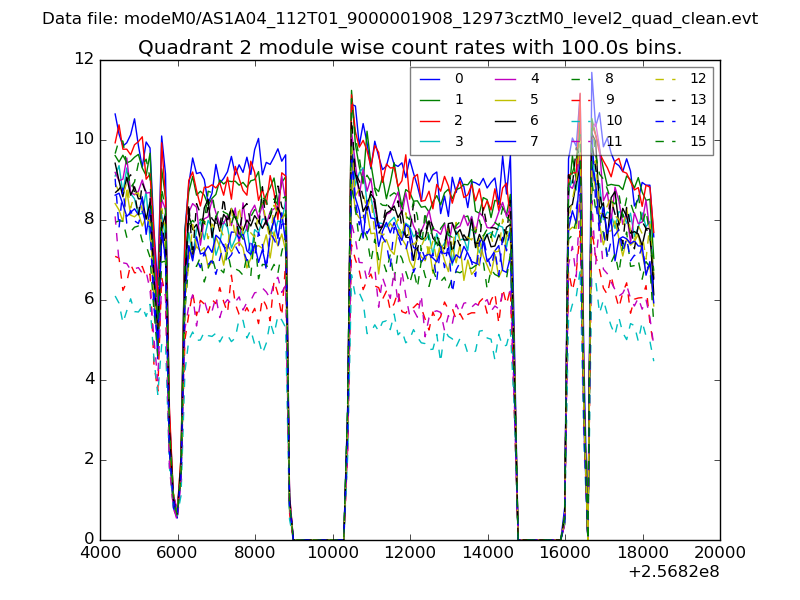
| Module-wise count rates for Quadrant B Data is divided into 100 sec bins |
 |
 |
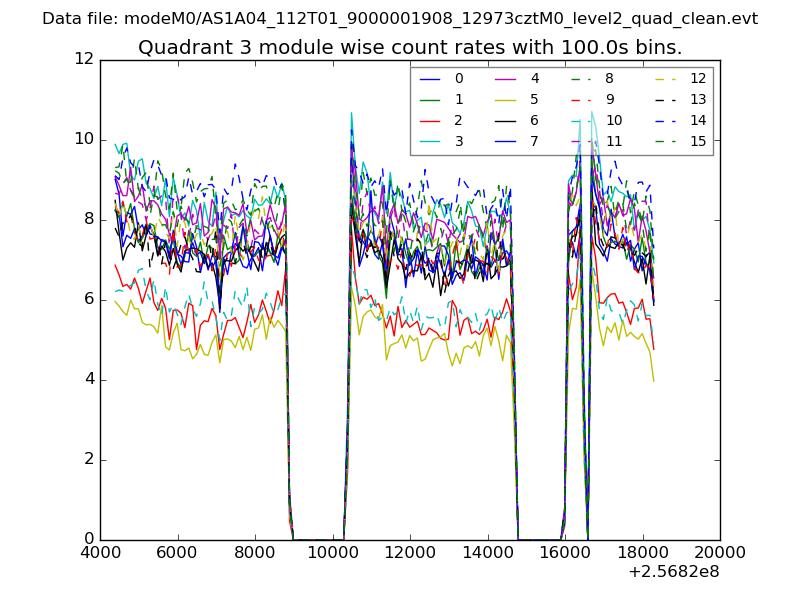
| Module-wise count rates for Quadrant C Data is divided into 100 sec bins |
 |
 |
| Module-wise count rates for Quadrant D Data is divided into 100 sec bins |
 |
 |
| Parameter | Plot |
|---|---|
| CZT HV Monitor | 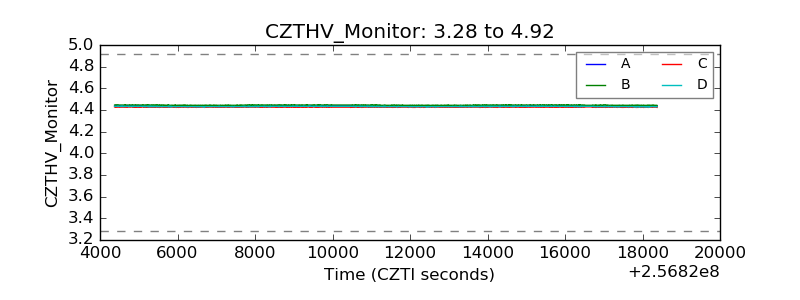 |
| D_VDD | 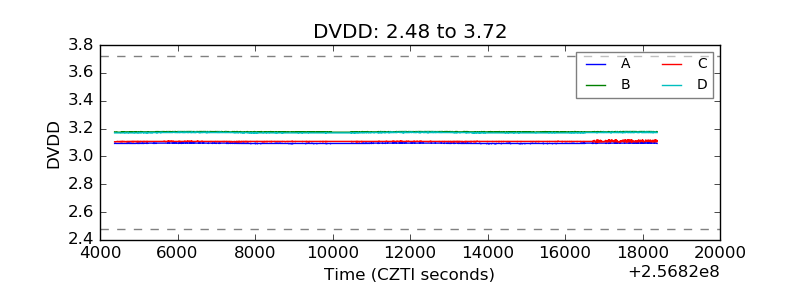 |
| Temperature 1 | 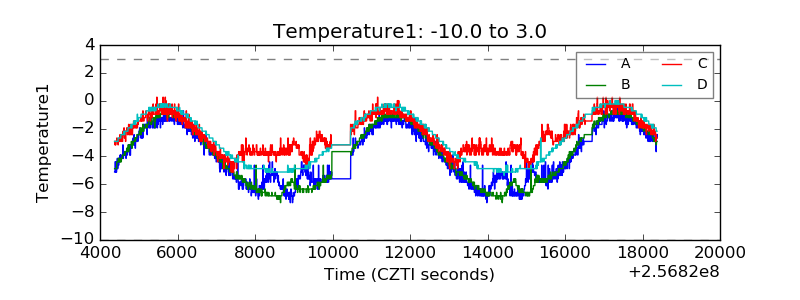 |
| Veto HV Monitor |  |
| Veto LLD | 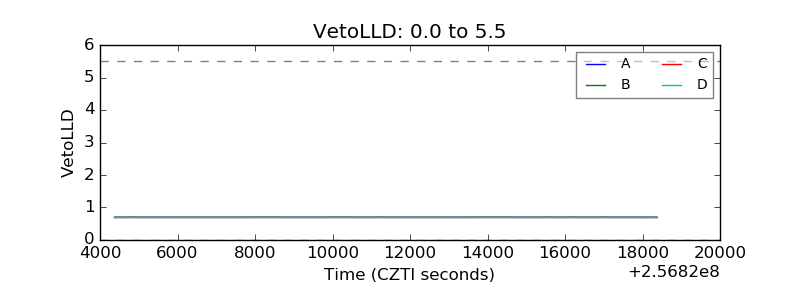 |
| Alpha Counter | 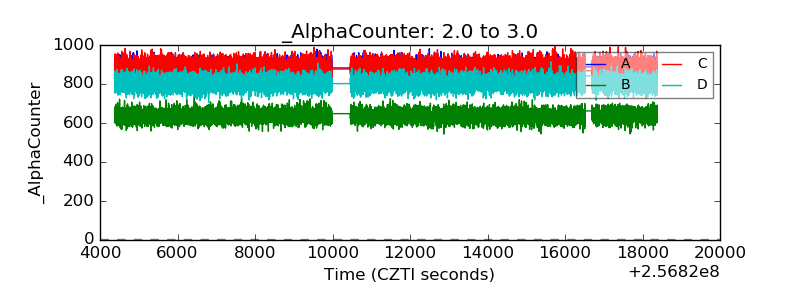 |
| _CPM_Rate | 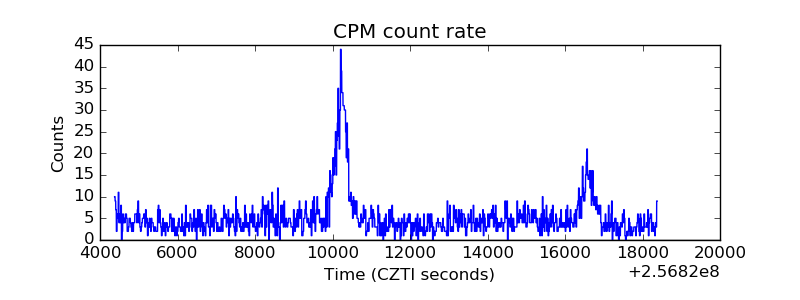 |
| CZT Counter | 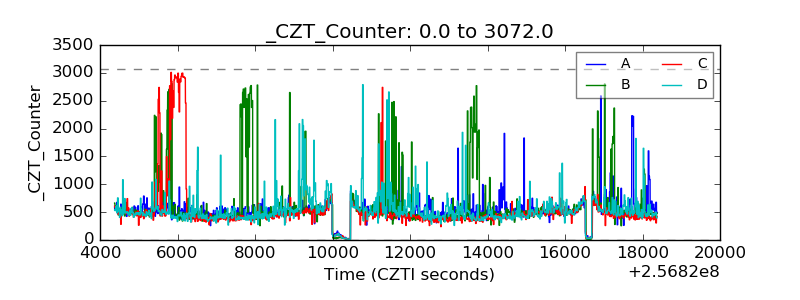 |
| +2.5 Volts monitor |  |
| +5 Volts monitor |  |
| _ROLL_ROT | 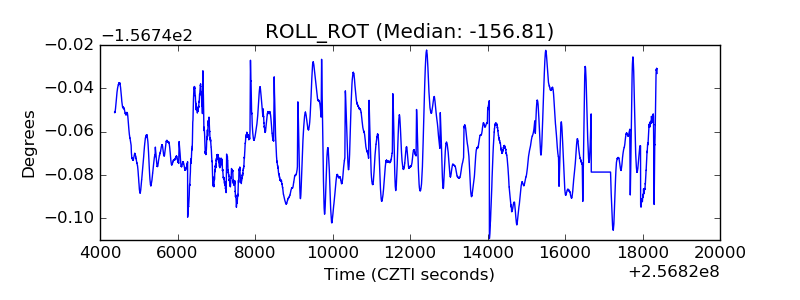 |
| _Roll_DEC | 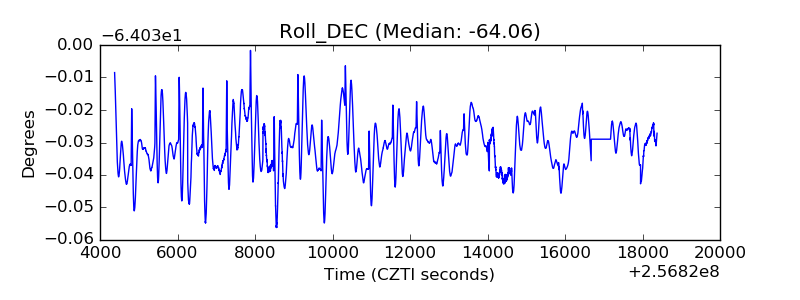 |
| _Roll_RA | 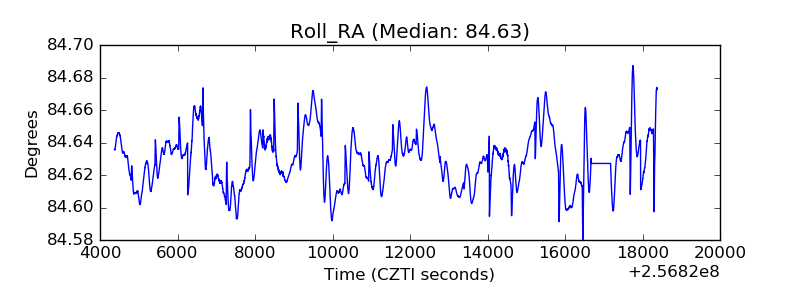 |
| Veto Counter | 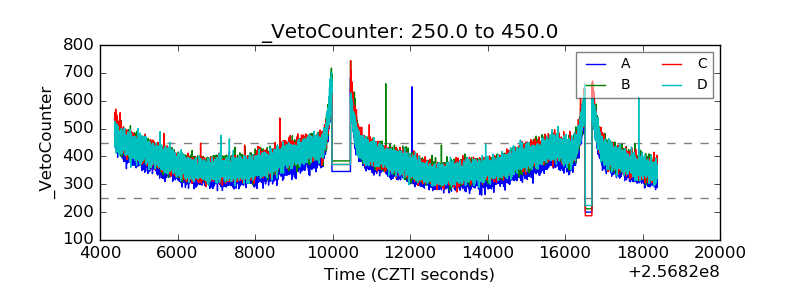 |