| Param | Original file | Final file |
|---|---|---|
| Filename | modeM0/AS1A04_112T01_9000001908_12974cztM0_level2.evt | modeM0/AS1A04_112T01_9000001908_12974cztM0_level2_quad_clean.evt |
| Size (bytes) | 547,116,480 | 109,514,880 |
| Size | 521.8 MB | 104.4 MB |
| Events in quadrant A | 4,265,379 | 716,173 |
| Events in quadrant B | 4,968,602 | 663,454 |
| Events in quadrant C | 3,346,733 | 722,566 |
| Events in quadrant D | 3,489,669 | 702,415 |
| Mode SS | |||
|---|---|---|---|
| Quadrant | BADHDUFLAG | Total packets | Discarded packets |
| A | 0 | 150 | 0 |
| B | 0 | 150 | 0 |
| C | 0 | 150 | 0 |
| D | 0 | 150 | 0 |
| Mode M0 | |||
|---|---|---|---|
| Quadrant | BADHDUFLAG | Total packets | Discarded packets |
| A | 0 | 17425 | 2 |
| B | 0 | 19571 | 1 |
| C | 0 | 15231 | 1 |
| D | 0 | 15476 | 1 |
| Mode M9 | |||
|---|---|---|---|
| Quadrant | BADHDUFLAG | Total packets | Discarded packets |
| A | 0 | 3 | 0 |
| B | 0 | 3 | 0 |
| C | 0 | 3 | 0 |
| D | 0 | 3 | 0 |
| Quadrant | Total seconds | Saturated seconds | Saturation percentage |
|---|---|---|---|
| A | 7354 | 136 | 1.849334% |
| B | 7354 | 768 | 10.443296% |
| C | 7354 | 46 | 0.625510% |
| D | 7354 | 23 | 0.312755% |
Noise dominated data is calculated using 1-second bins in cleaned event files. If a bin has >2000 counts, and if more than 50% of those come from <1% of pixels, then it is considered to be noise-dominated and hence unusable.
| Quadrant | # 1 sec bins | Bins with >0 counts | Bins with >2000 counts | High rate bins dominated by noise | Noise dominated (total time) | Noise dominated (detector-on time) | Marked lightcurve |
|---|---|---|---|---|---|---|---|
| A | 7636 | 7358 | 58 | 58 | 0.76% | 0.79% | 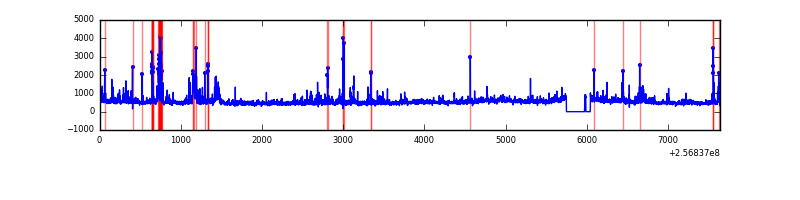 |
| B | 7636 | 7357 | 455 | 455 | 5.96% | 6.18% | 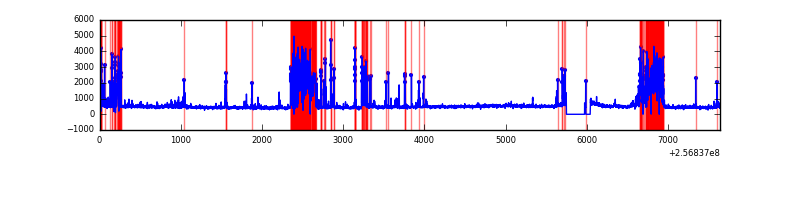 |
| C | 7636 | 7358 | 25 | 25 | 0.33% | 0.34% | 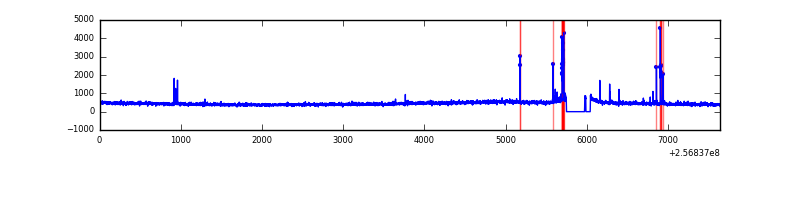 |
| D | 7636 | 7358 | 10 | 10 | 0.13% | 0.14% | 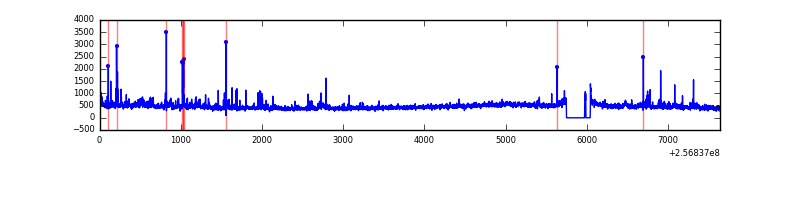 |
Top three noisy pixels from each quadrant. If the there are fewer than three noisy pixels in the level2.evt file, extra rows are filled as -1
| Pixel properties | Quadrant properties | ||||||
|---|---|---|---|---|---|---|---|
| Quadrant | DetID | PixID | Counts | Sigma | Mean | Median | Sigma |
| A | 15 | 223 | 263908 | 1516.09 | 850 | 832 | 173.5 |
| A | 12 | 189 | 233102 | 1338.56 | 850 | 832 | 173.5 |
| A | 1 | 162 | 140034 | 802.21 | 850 | 832 | 173.5 |
| B | 4 | 239 | 1647340 | 10814.69 | 797 | 775 | 152.3 |
| B | 3 | 64 | 98917 | 644.6 | 797 | 775 | 152.3 |
| B | 0 | 219 | 30477 | 195.08 | 797 | 775 | 152.3 |
| C | 0 | 207 | 119593 | 626.41 | 821 | 822 | 189.6 |
| C | 8 | 128 | 9804 | 47.37 | 821 | 822 | 189.6 |
| C | 14 | 234 | 7764 | 36.61 | 821 | 822 | 189.6 |
| D | 1 | 52 | 188379 | 944.65 | 823 | 797 | 198.6 |
| D | 8 | 195 | 144130 | 721.81 | 823 | 797 | 198.6 |
| D | 14 | 35 | 30505 | 149.61 | 823 | 797 | 198.6 |
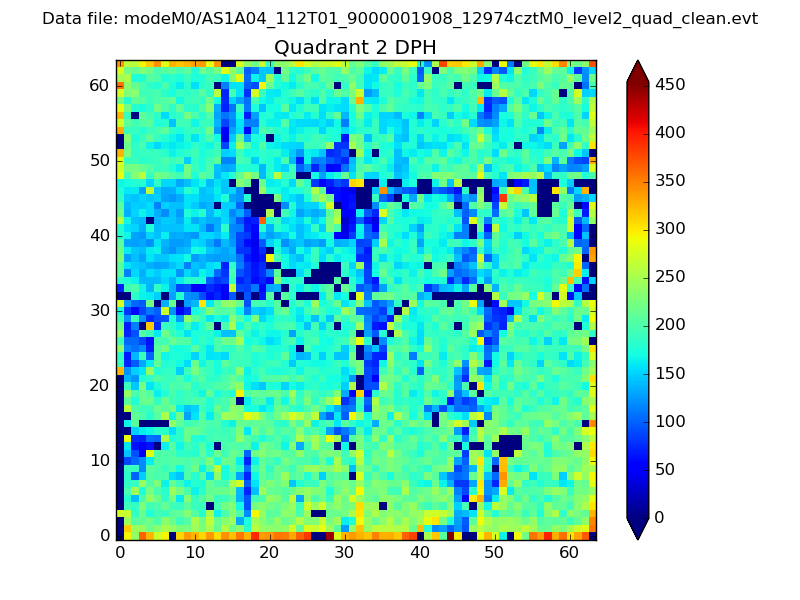
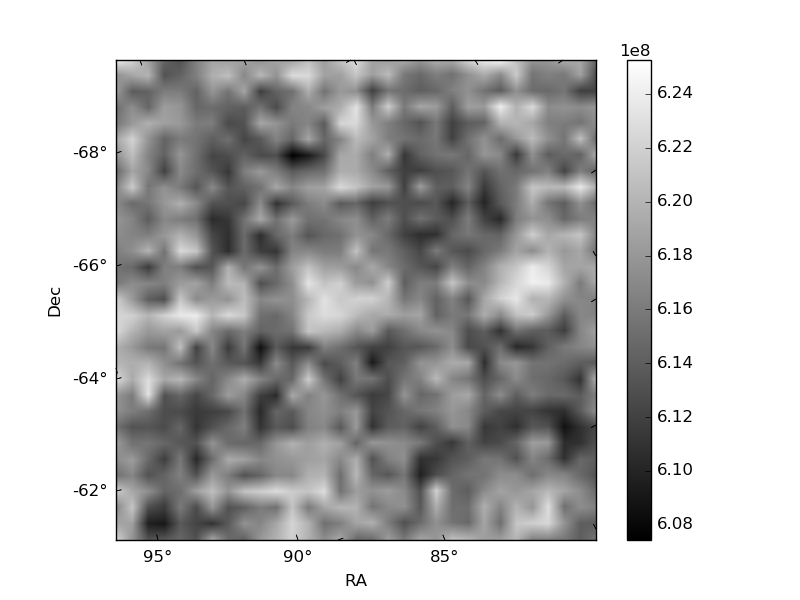
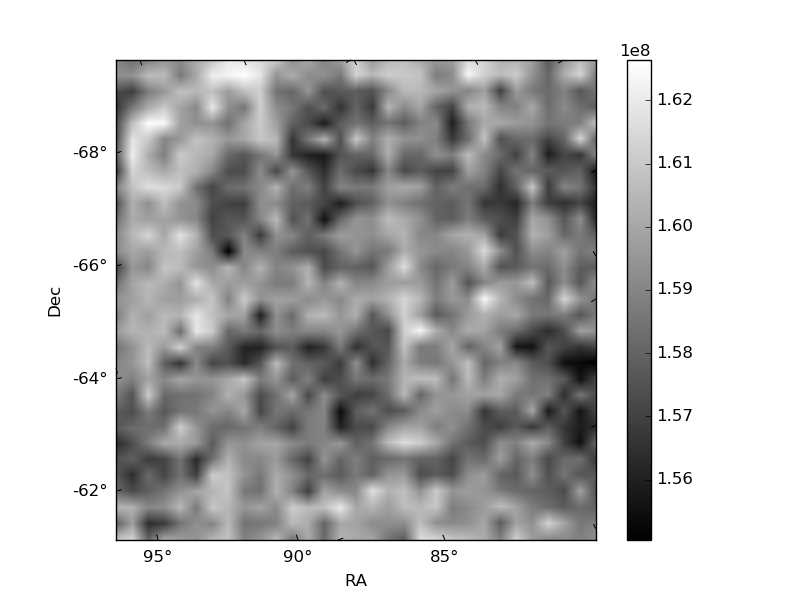
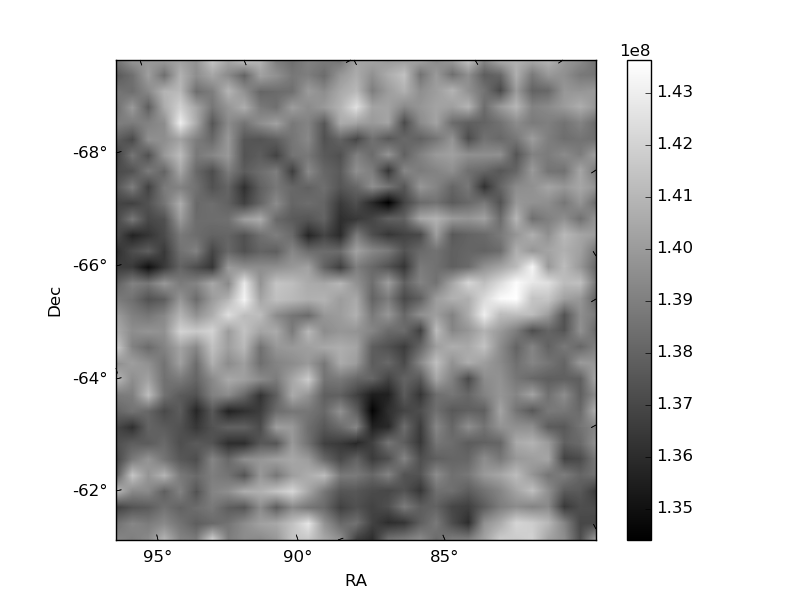
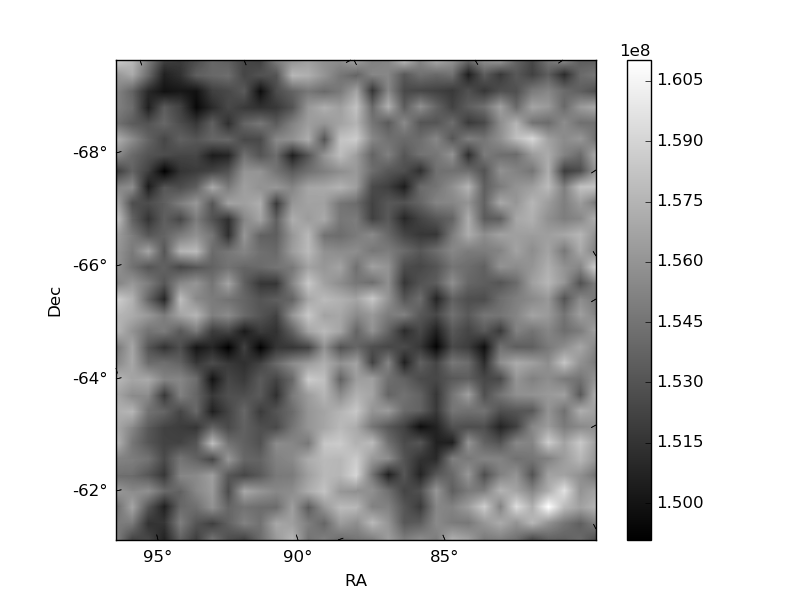
Histogram calculated using DETX and DETY for each event in the final _common_clean file
| Quadrant A | 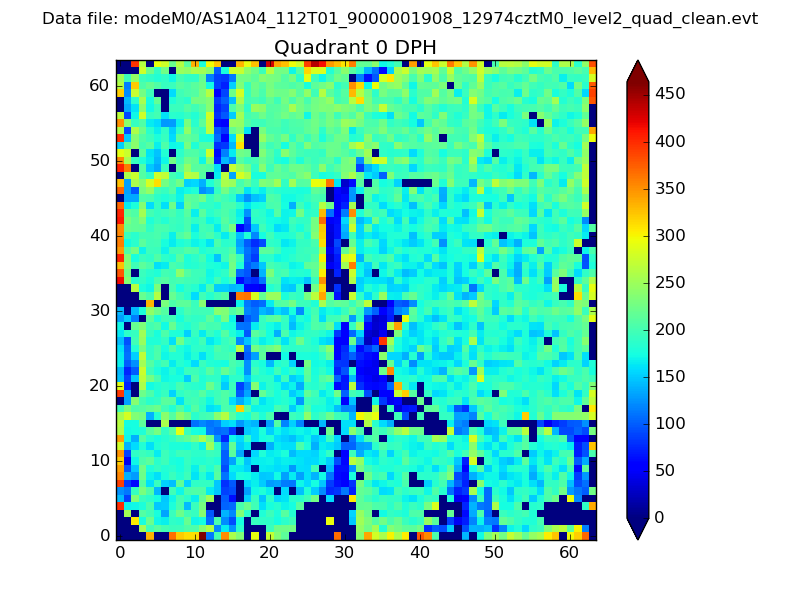 |
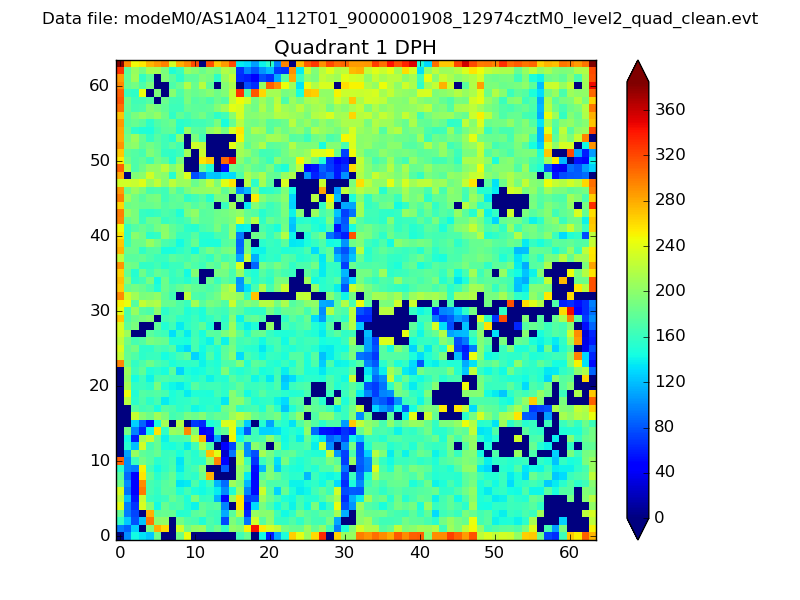 |
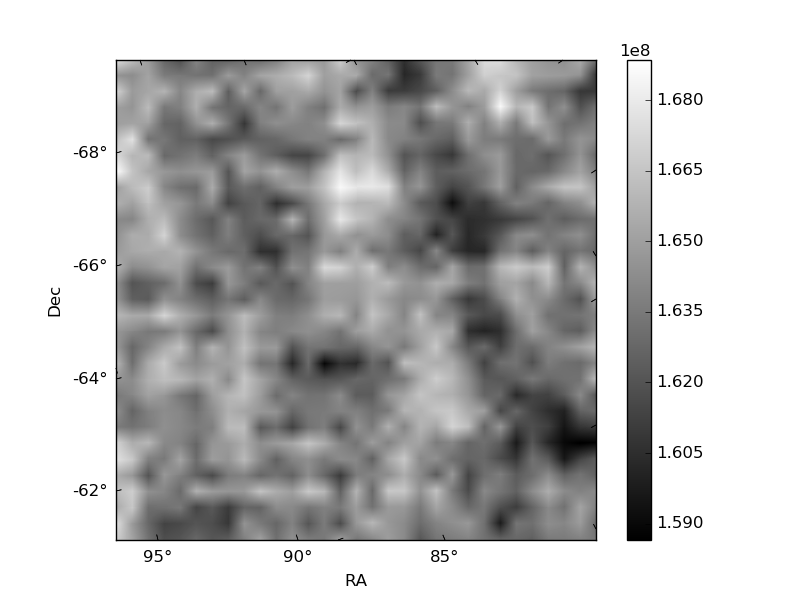
Quadrant B |
|---|---|---|---|
| Quadrant D | 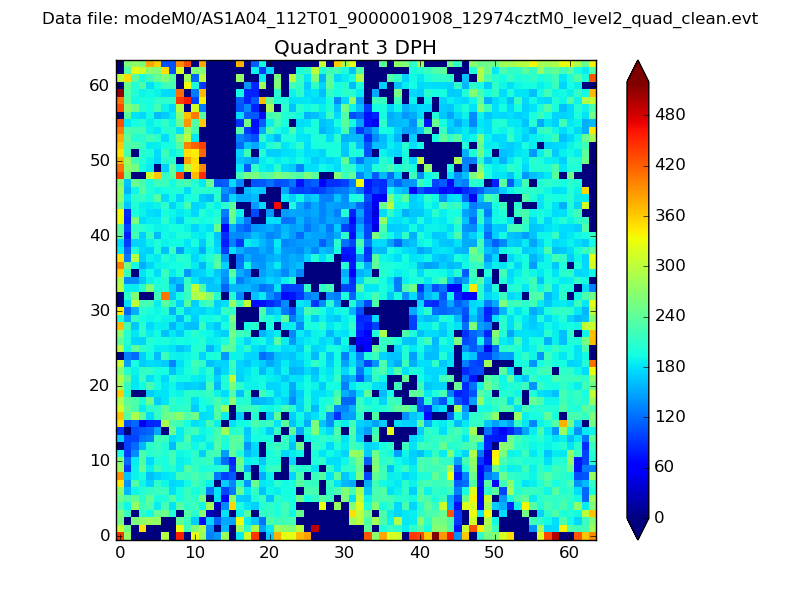 |
 |
Quadrant C |
| Plot type | Count rate plots | Images |
|---|---|---|
| Comparison with Poisson distribution Blue bars denote a histogram of data divided into 1 sec bins. Red curve is a Poisson curve with rate = median count rate of data. |
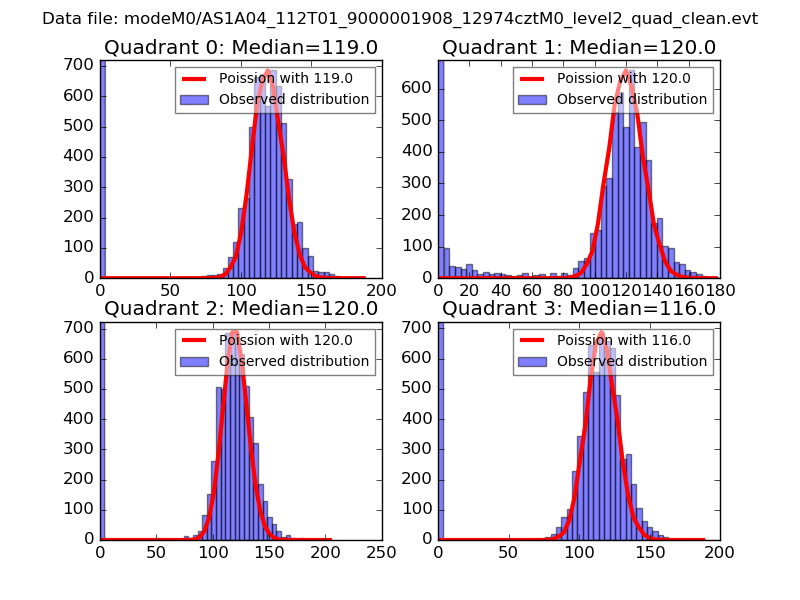 |
 |
| Quadrant-wise count rates Data is divided into 100 sec bins |
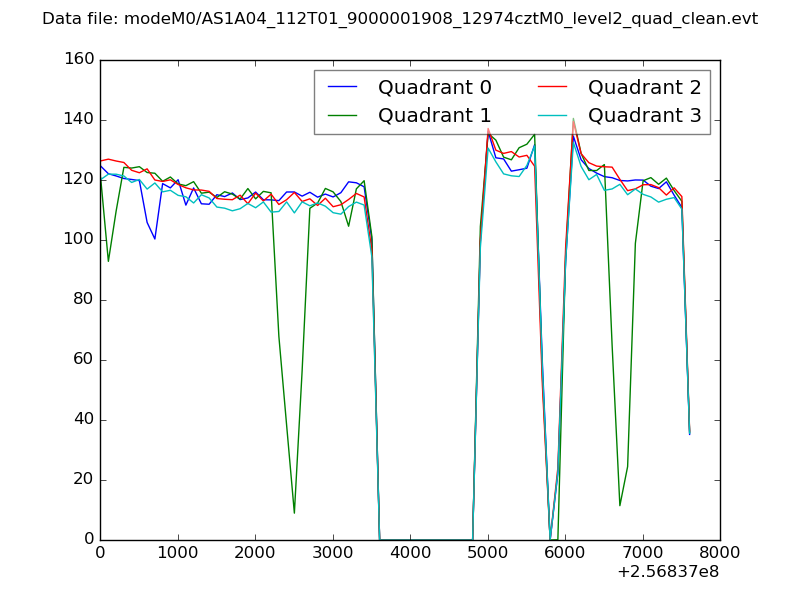 |
|
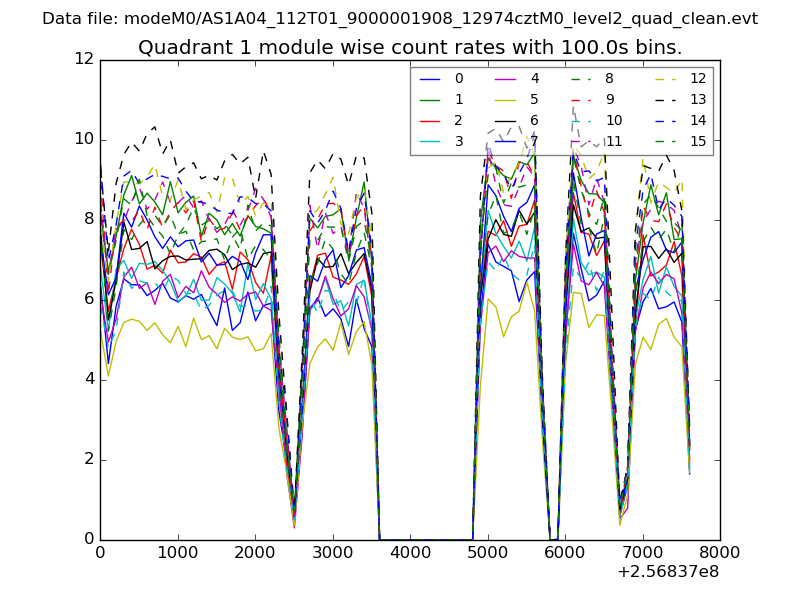
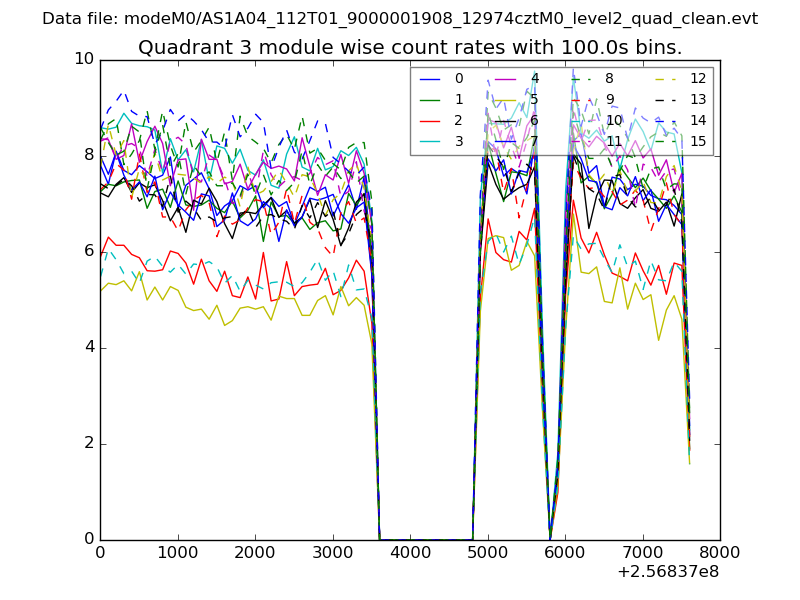
| Module-wise count rates for Quadrant A Data is divided into 100 sec bins |
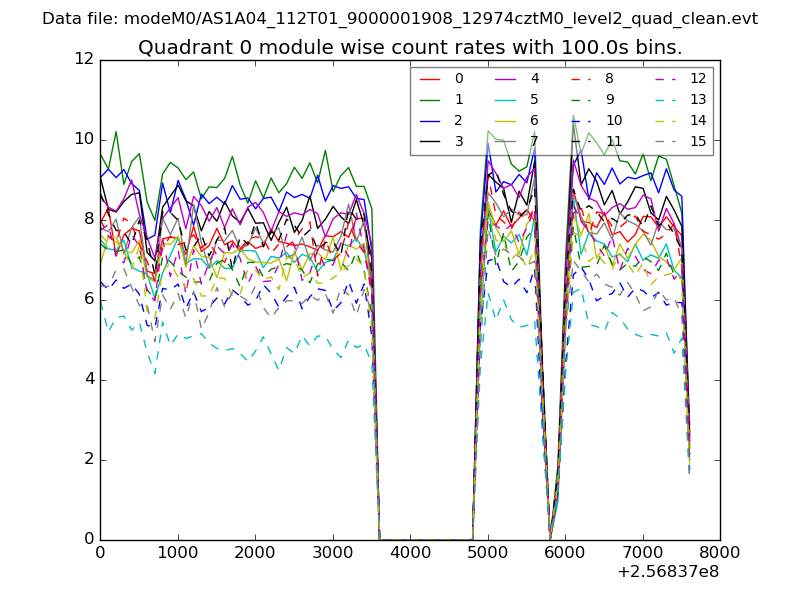 |
 |
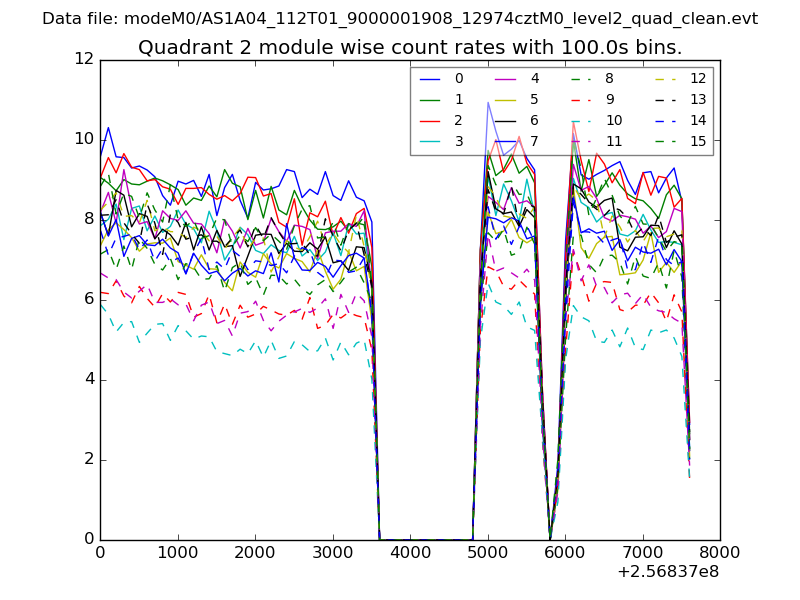
| Module-wise count rates for Quadrant B Data is divided into 100 sec bins |
 |
 |
| Module-wise count rates for Quadrant C Data is divided into 100 sec bins |
 |
 |
| Module-wise count rates for Quadrant D Data is divided into 100 sec bins |
 |
 |
| Parameter | Plot |
|---|---|
| CZT HV Monitor | 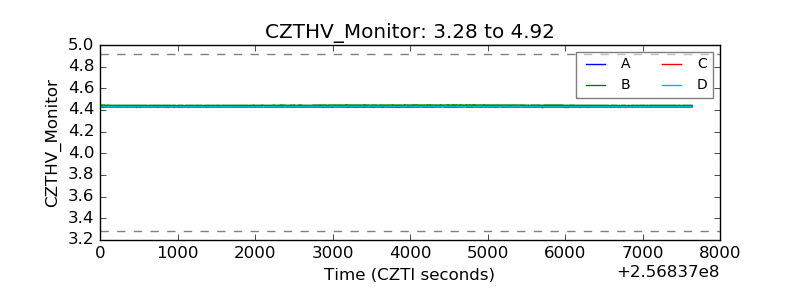 |
| D_VDD | 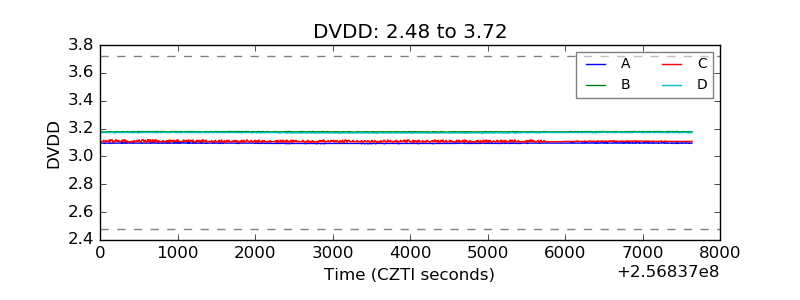 |
| Temperature 1 | 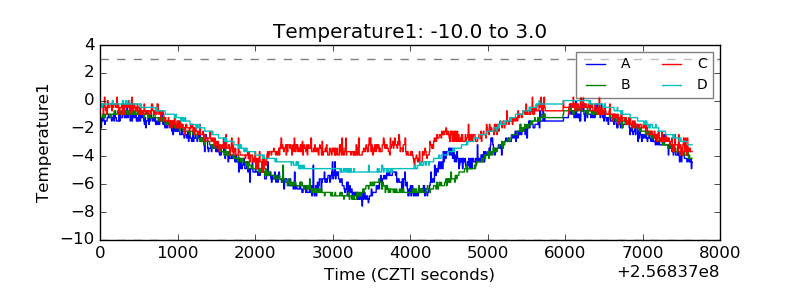 |
| Veto HV Monitor | 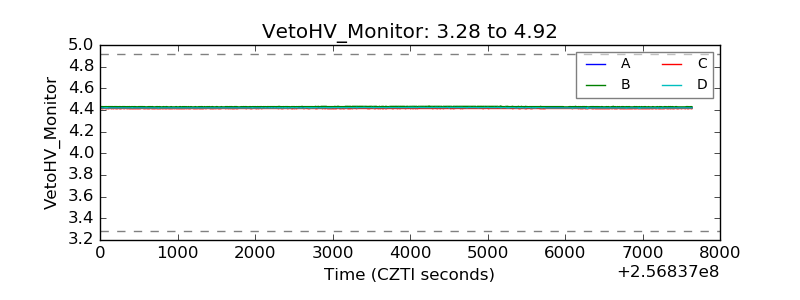 |
| Veto LLD | 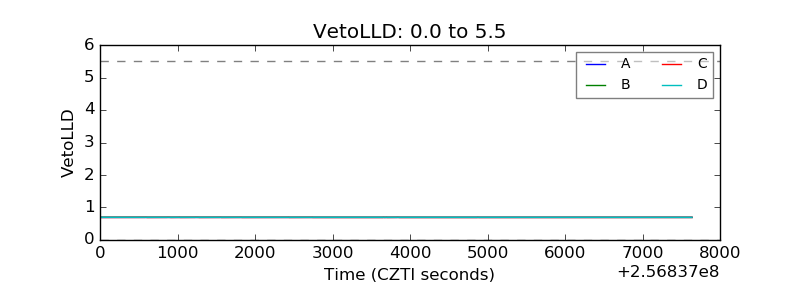 |
| Alpha Counter | 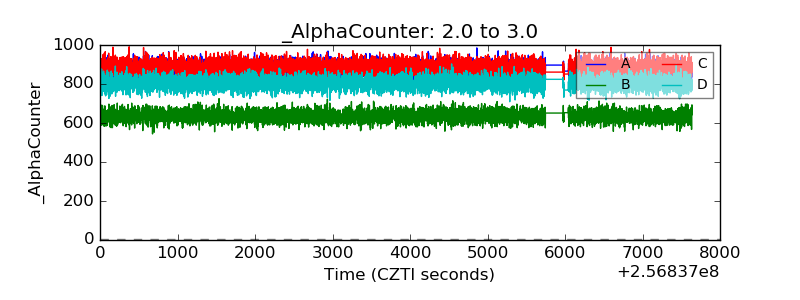 |
| _CPM_Rate | 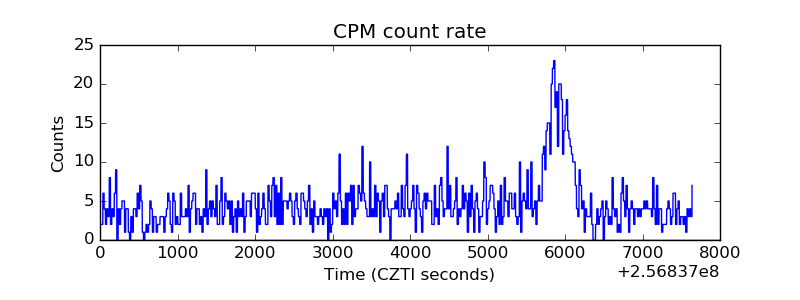 |
| CZT Counter | 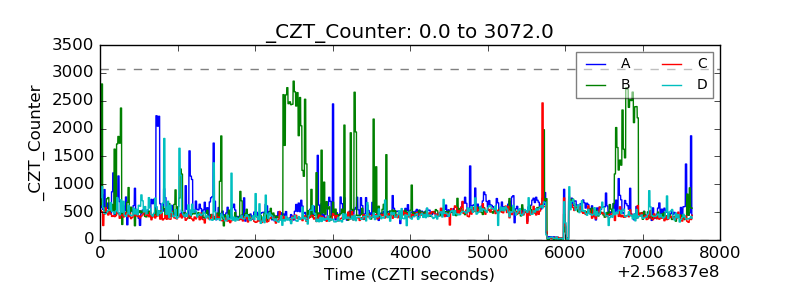 |
| +2.5 Volts monitor |  |
| +5 Volts monitor |  |
| _ROLL_ROT | 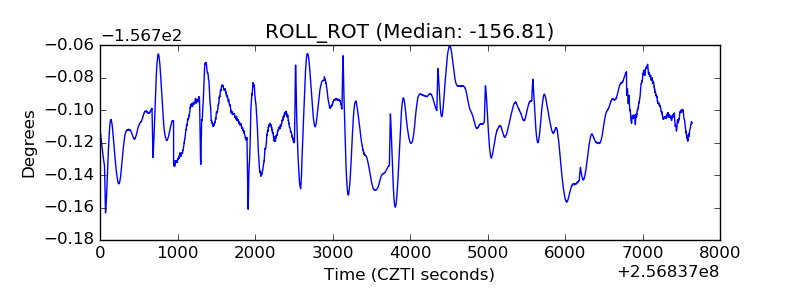 |
| _Roll_DEC | 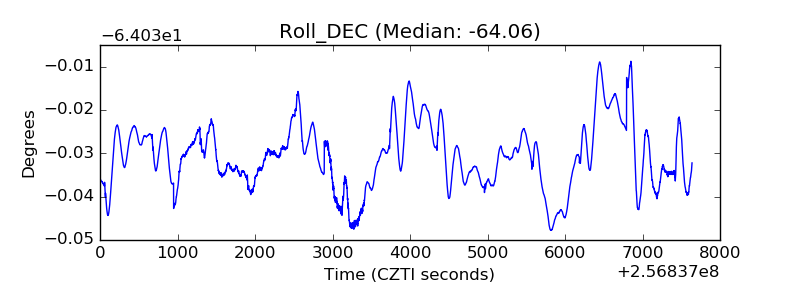 |
| _Roll_RA | 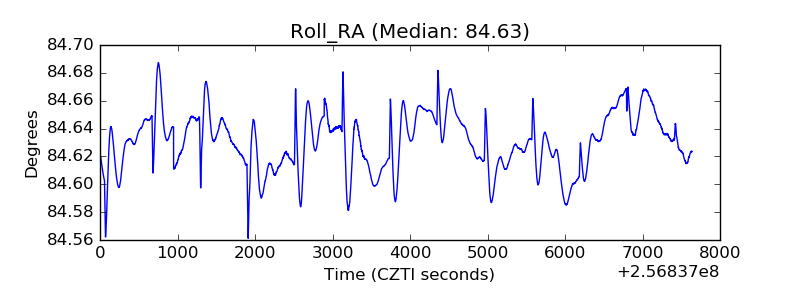 |
| Veto Counter | 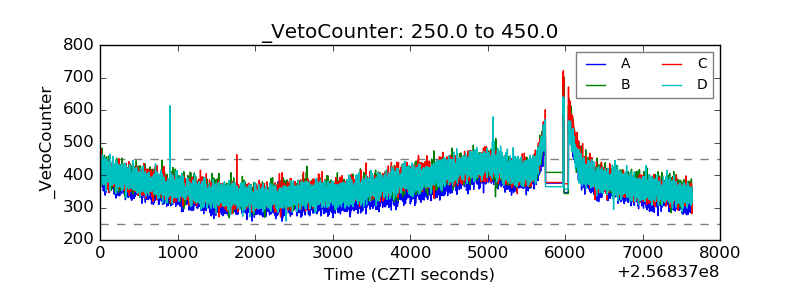 |