| Param | Original file | Final file |
|---|---|---|
| Filename | modeM0/AS1T02_004T01_9000001910cztM0_level2.fits | modeM0/AS1T02_004T01_9000001910cztM0_level2_quad_clean.evt |
| Size (bytes) | 291,424,320 | 295,499,520 |
| Size | 277.9 MB | 281.8 MB |
| Events in quadrant A | 1,764,348 | 1,803,843 |
| Events in quadrant B | 1,636,654 | 1,703,709 |
| Events in quadrant C | 1,770,588 | 1,732,041 |
| Events in quadrant D | 1,512,724 | 1,569,195 |
| Mode M0 | |||
|---|---|---|---|
| Quadrant | BADHDUFLAG | Total packets | Discarded packets |
| A | 0 | 70292 | 0 |
| B | 0 | 87962 | 0 |
| C | 0 | 64125 | 0 |
| D | 0 | 78865 | 0 |
| Mode SS | |||
|---|---|---|---|
| Quadrant | BADHDUFLAG | Total packets | Discarded packets |
| A | 0 | 638 | 0 |
| B | 0 | 638 | 0 |
| C | 0 | 638 | 0 |
| D | 0 | 638 | 0 |
| Mode M9 | |||
|---|---|---|---|
| Quadrant | BADHDUFLAG | Total packets | Discarded packets |
| A | 0 | 49 | 0 |
| B | 0 | 49 | 0 |
| C | 0 | 49 | 0 |
| D | 0 | 49 | 0 |
| Quadrant | Total seconds | Saturated seconds | Saturation percentage |
|---|---|---|---|
| A | 31128 | 458 | 1.471344% |
| B | 31128 | 2868 | 9.213570% |
| C | 31128 | 178 | 0.571832% |
| D | 31128 | 1228 | 3.945001% |
Noise dominated data is calculated using 1-second bins in cleaned event files. If a bin has >2000 counts, and if more than 50% of those come from <1% of pixels, then it is considered to be noise-dominated and hence unusable.
| Quadrant | # 1 sec bins | Bins with >0 counts | Bins with >2000 counts | High rate bins dominated by noise | Noise dominated (total time) | Noise dominated (detector-on time) | Marked lightcurve |
|---|---|---|---|---|---|---|---|
| A | 36234 | 31130 | 0 | 0 | 0.00% | 0.00% |  |
| B | 36234 | 30935 | 0 | 0 | 0.00% | 0.00% |  |
| C | 36234 | 31130 | 0 | 0 | 0.00% | 0.00% | 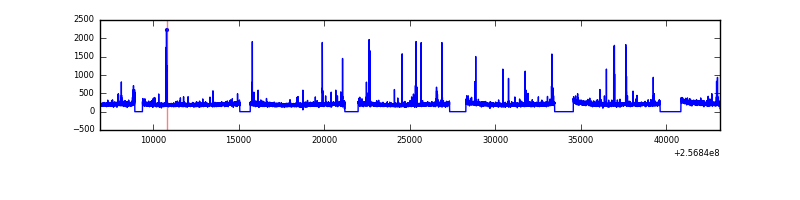 |
| D | 36234 | 31124 | 0 | 0 | 0.00% | 0.00% |  |
Top three noisy pixels from each quadrant. If the there are fewer than three noisy pixels in the level2.evt file, extra rows are filled as -1
| Pixel properties | Quadrant properties | ||||||
|---|---|---|---|---|---|---|---|
| Quadrant | DetID | PixID | Counts | Sigma | Mean | Median | Sigma |
| A | 0 | 29 | 1712 | 11.03 | 459 | 429 | 116.3 |
| A | 7 | 110 | 1509 | 9.29 | 459 | 429 | 116.3 |
| A | 9 | 19 | 1340 | 7.83 | 459 | 429 | 116.3 |
| B | 2 | 9 | 1367 | 10.87 | 432 | 412 | 87.9 |
| B | 3 | 17 | 1118 | 8.04 | 432 | 412 | 87.9 |
| B | 14 | 254 | 1094 | 7.76 | 432 | 412 | 87.9 |
| C | 12 | 241 | 1351 | 7.5 | 468 | 436 | 122.0 |
| C | 9 | 233 | 1178 | 6.08 | 468 | 436 | 122.0 |
| C | 2 | 191 | 1163 | 5.96 | 468 | 436 | 122.0 |
| D | 3 | 14 | 1124 | 6.27 | 430 | 391 | 116.9 |
| D | 6 | 231 | 1061 | 5.73 | 430 | 391 | 116.9 |
| D | 7 | 3 | 1048 | 5.62 | 430 | 391 | 116.9 |
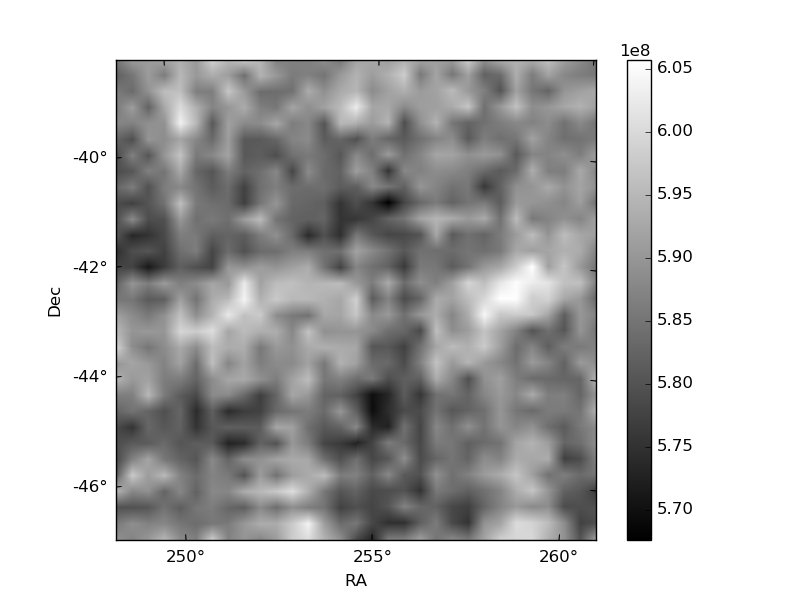
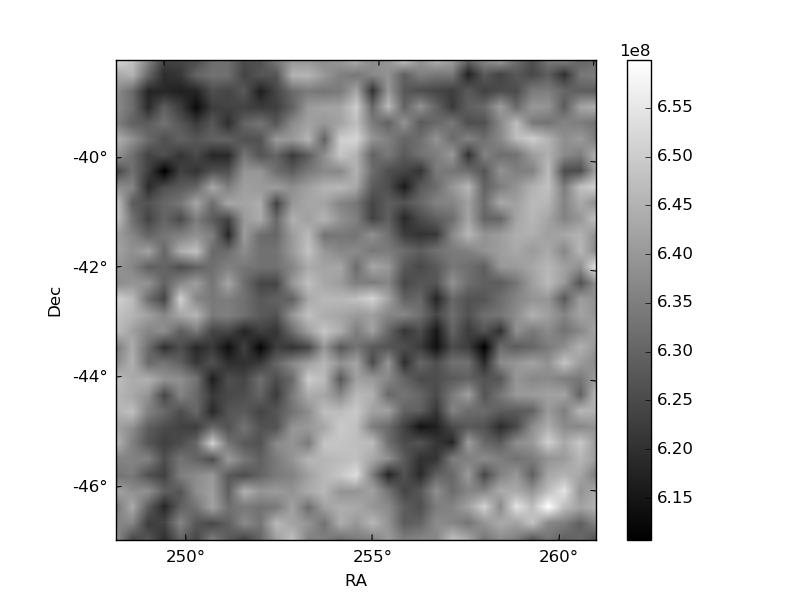
Histogram calculated using DETX and DETY for each event in the final _common_clean file
| Quadrant A | 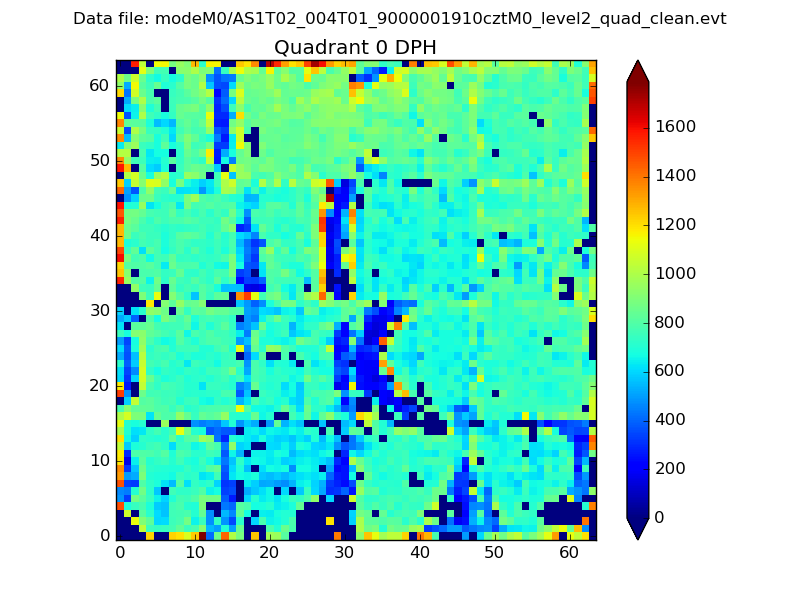 |
 |
Quadrant B |
|---|---|---|---|
| Quadrant D |  |
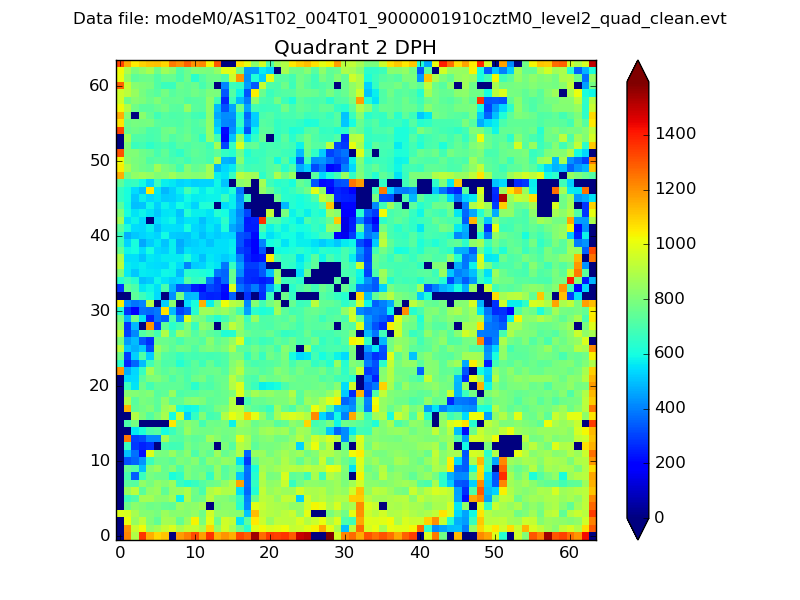 |
Quadrant C |
| Plot type | Count rate plots | Images |
|---|---|---|
| Comparison with Poisson distribution Blue bars denote a histogram of data divided into 1 sec bins. Red curve is a Poisson curve with rate = median count rate of data. |
 |
 |
| Quadrant-wise count rates Data is divided into 100 sec bins |
 |
|
| Module-wise count rates for Quadrant A Data is divided into 100 sec bins |
 |
 |
| Module-wise count rates for Quadrant B Data is divided into 100 sec bins |
 |
 |
| Module-wise count rates for Quadrant C Data is divided into 100 sec bins |
 |
 |
| Module-wise count rates for Quadrant D Data is divided into 100 sec bins |
 |
 |
| Parameter | Plot |
|---|---|
| CZT HV Monitor |  |
| D_VDD |  |
| Temperature 1 |  |
| Veto HV Monitor |  |
| Veto LLD |  |
| Alpha Counter |  |
| _CPM_Rate |  |
| CZT Counter |  |
| +2.5 Volts monitor |  |
| +5 Volts monitor |  |
| _ROLL_ROT |  |
| _Roll_DEC |  |
| _Roll_RA |  |
| Veto Counter |  |