| Param | Original file | Final file |
|---|---|---|
| Filename | modeM0/AS1T02_004T01_9000001910_12978cztM0_level2.evt | modeM0/AS1T02_004T01_9000001910_12978cztM0_level2_quad_clean.evt |
| Size (bytes) | 584,017,920 | 101,810,880 |
| Size | 557.0 MB | 97.1 MB |
| Events in quadrant A | 4,041,140 | 656,144 |
| Events in quadrant B | 6,004,097 | 640,448 |
| Events in quadrant C | 3,362,985 | 662,723 |
| Events in quadrant D | 3,796,600 | 628,465 |
| Mode M0 | |||
|---|---|---|---|
| Quadrant | BADHDUFLAG | Total packets | Discarded packets |
| A | 0 | 16632 | 3 |
| B | 0 | 22531 | 2 |
| C | 0 | 14677 | 2 |
| D | 0 | 16095 | 2 |
| Mode SS | |||
|---|---|---|---|
| Quadrant | BADHDUFLAG | Total packets | Discarded packets |
| A | 0 | 150 | 0 |
| B | 0 | 150 | 0 |
| C | 0 | 150 | 0 |
| D | 0 | 150 | 0 |
| Mode M9 | |||
|---|---|---|---|
| Quadrant | BADHDUFLAG | Total packets | Discarded packets |
| A | 0 | 16 | 0 |
| B | 0 | 16 | 0 |
| C | 0 | 16 | 0 |
| D | 0 | 16 | 0 |
| Quadrant | Total seconds | Saturated seconds | Saturation percentage |
|---|---|---|---|
| A | 7099 | 160 | 2.253839% |
| B | 7099 | 844 | 11.888998% |
| C | 7099 | 56 | 0.788843% |
| D | 7099 | 85 | 1.197352% |
Noise dominated data is calculated using 1-second bins in cleaned event files. If a bin has >2000 counts, and if more than 50% of those come from <1% of pixels, then it is considered to be noise-dominated and hence unusable.
| Quadrant | # 1 sec bins | Bins with >0 counts | Bins with >2000 counts | High rate bins dominated by noise | Noise dominated (total time) | Noise dominated (detector-on time) | Marked lightcurve |
|---|---|---|---|---|---|---|---|
| A | 8830 | 7102 | 76 | 76 | 0.86% | 1.07% | 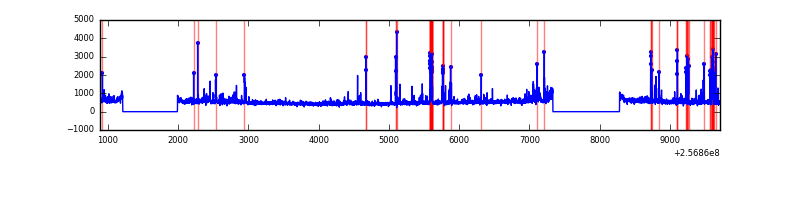 |
| B | 8830 | 7102 | 472 | 472 | 5.35% | 6.65% | 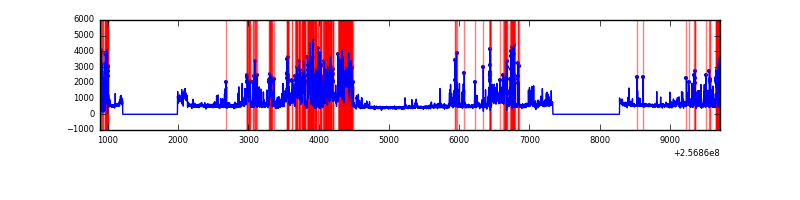 |
| C | 8830 | 7102 | 10 | 10 | 0.11% | 0.14% | 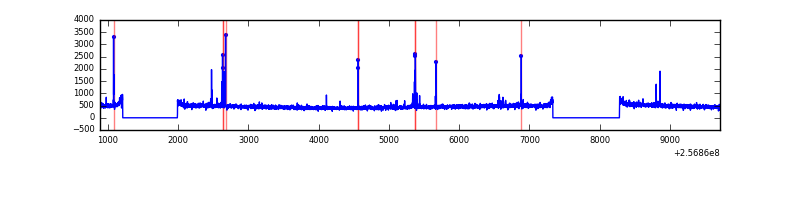 |
| D | 8830 | 7102 | 23 | 23 | 0.26% | 0.32% | 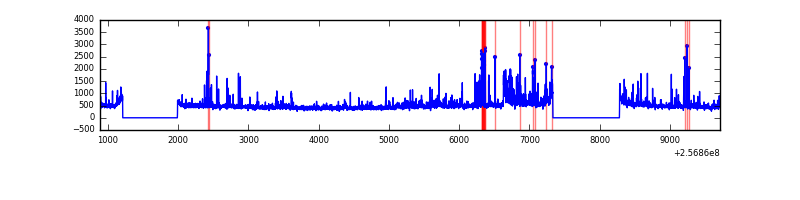 |
Top three noisy pixels from each quadrant. If the there are fewer than three noisy pixels in the level2.evt file, extra rows are filled as -1
| Pixel properties | Quadrant properties | ||||||
|---|---|---|---|---|---|---|---|
| Quadrant | DetID | PixID | Counts | Sigma | Mean | Median | Sigma |
| A | 12 | 189 | 178657 | 1030.08 | 853 | 835 | 172.6 |
| A | 15 | 223 | 174475 | 1005.85 | 853 | 835 | 172.6 |
| A | 9 | 143 | 120350 | 692.32 | 853 | 835 | 172.6 |
| B | 0 | 85 | 1732355 | 10980.53 | 825 | 804 | 157.7 |
| B | 4 | 239 | 695807 | 4407.32 | 825 | 804 | 157.7 |
| B | 3 | 64 | 244829 | 1547.47 | 825 | 804 | 157.7 |
| C | 14 | 234 | 66014 | 332.34 | 840 | 846 | 196.1 |
| C | 0 | 207 | 16757 | 81.14 | 840 | 846 | 196.1 |
| C | 13 | 61 | 6117 | 26.88 | 840 | 846 | 196.1 |
| D | 1 | 52 | 463614 | 2304.69 | 829 | 805 | 200.8 |
| D | 8 | 195 | 158422 | 784.9 | 829 | 805 | 200.8 |
| D | 2 | 234 | 35336 | 171.96 | 829 | 805 | 200.8 |
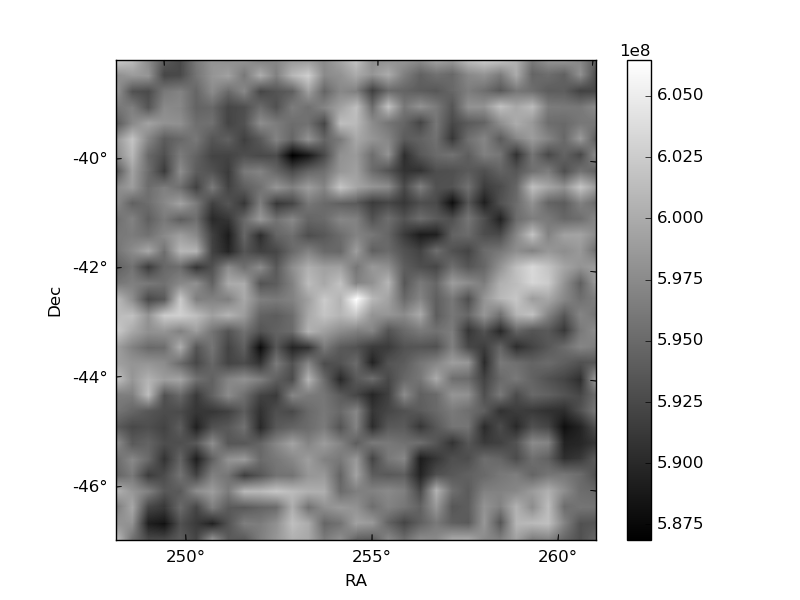
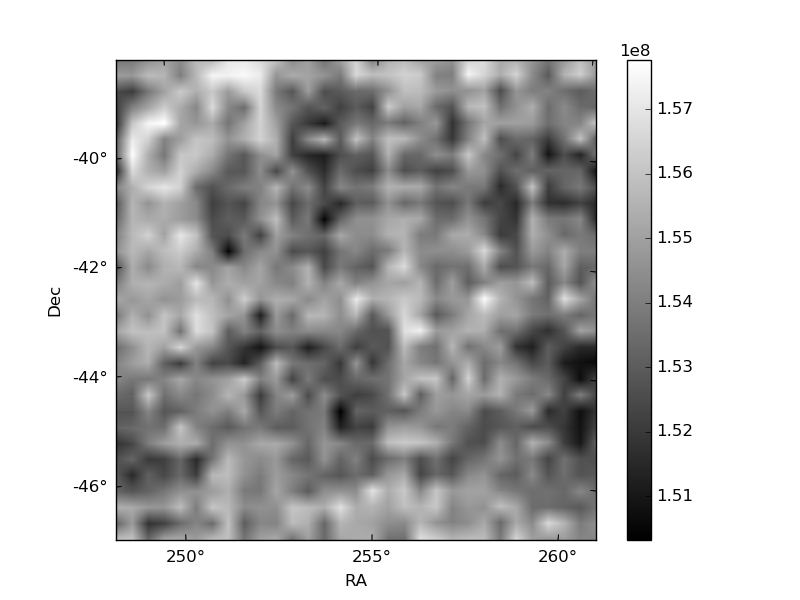
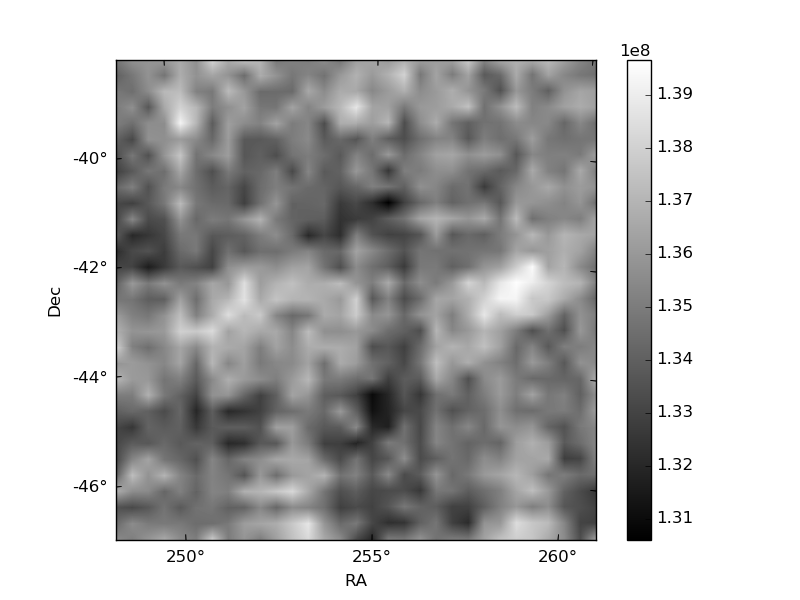
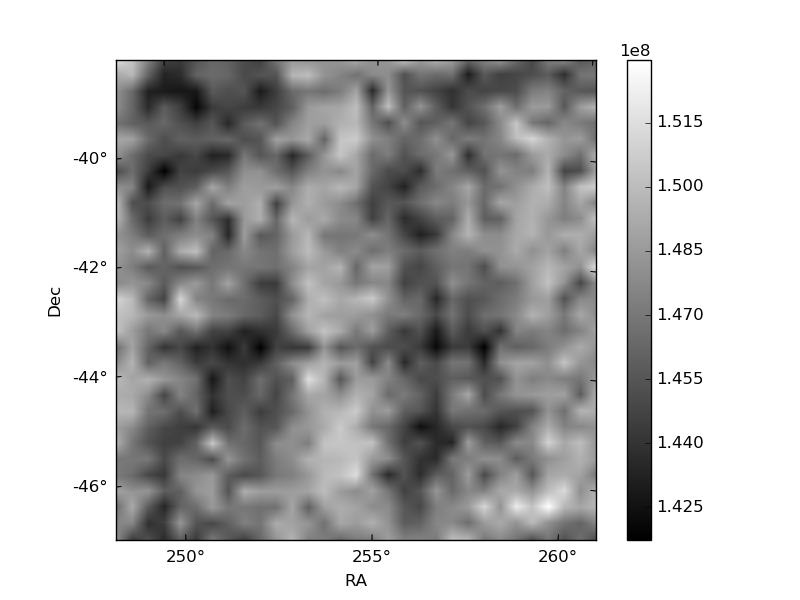
Histogram calculated using DETX and DETY for each event in the final _common_clean file
| Quadrant A | 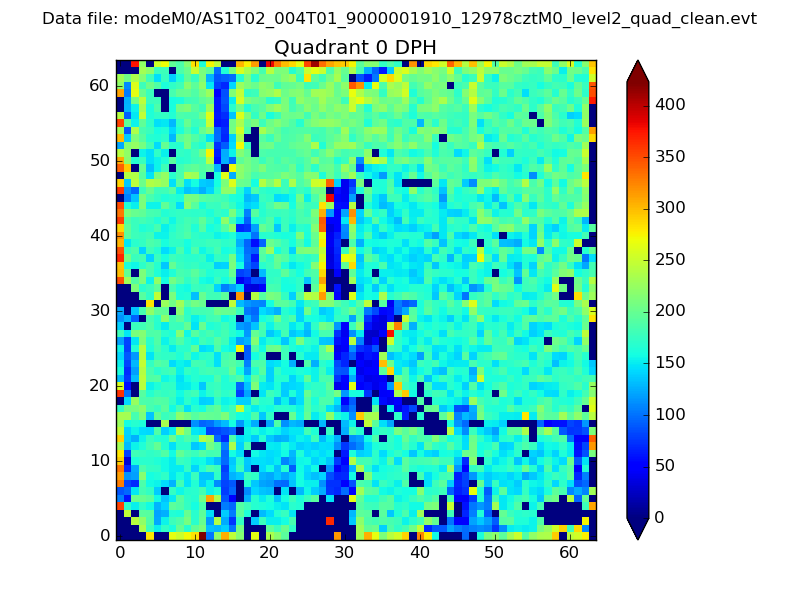 |
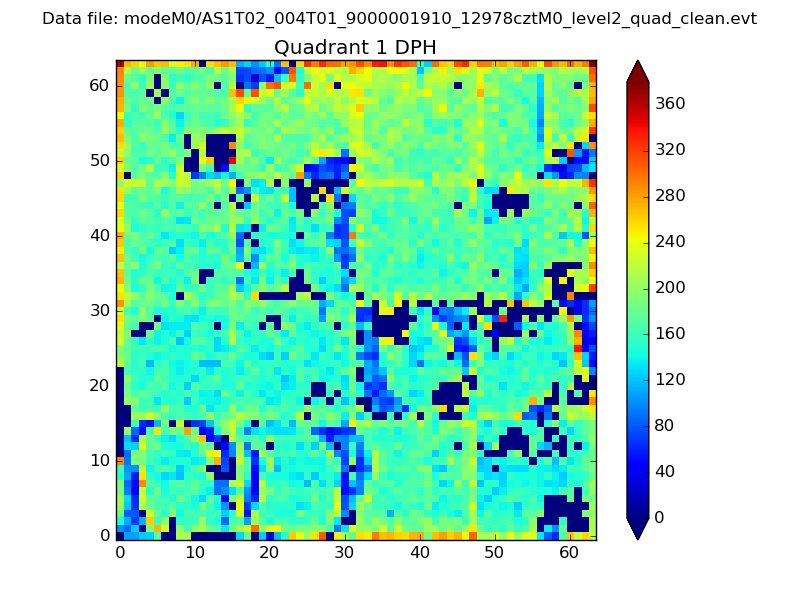 |
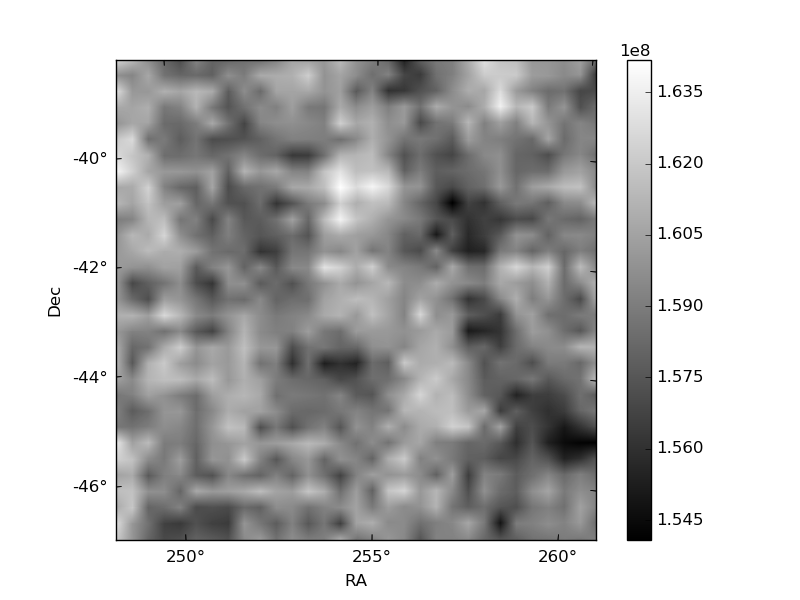
Quadrant B |
|---|---|---|---|
| Quadrant D | 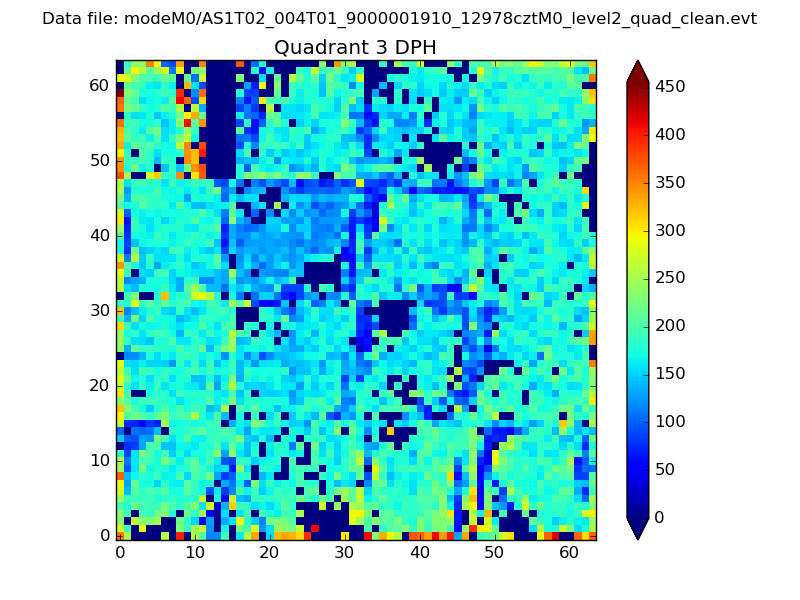 |
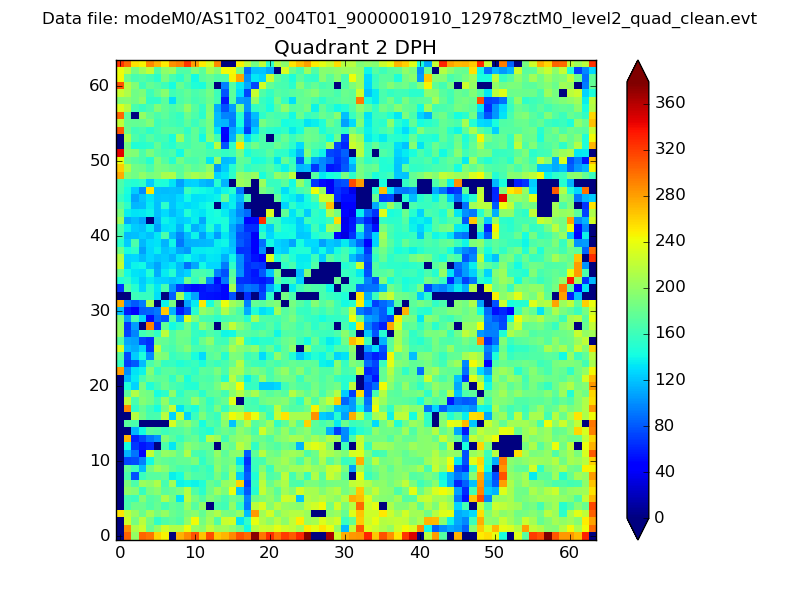 |
Quadrant C |
| Plot type | Count rate plots | Images |
|---|---|---|
| Comparison with Poisson distribution Blue bars denote a histogram of data divided into 1 sec bins. Red curve is a Poisson curve with rate = median count rate of data. |
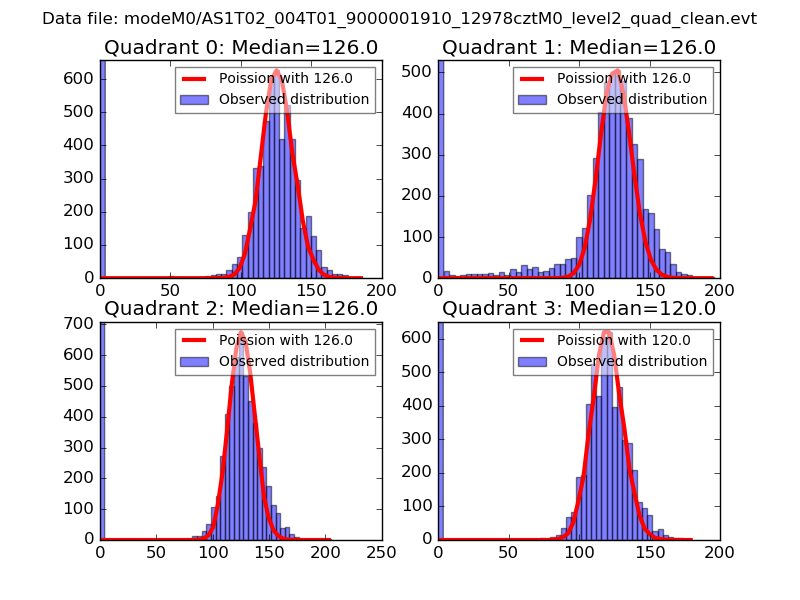 |
 |
| Quadrant-wise count rates Data is divided into 100 sec bins |
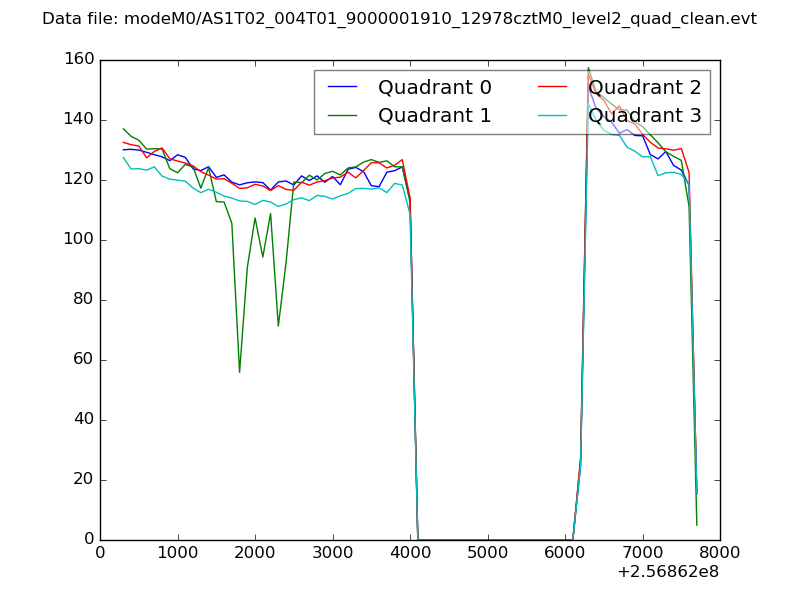 |
|
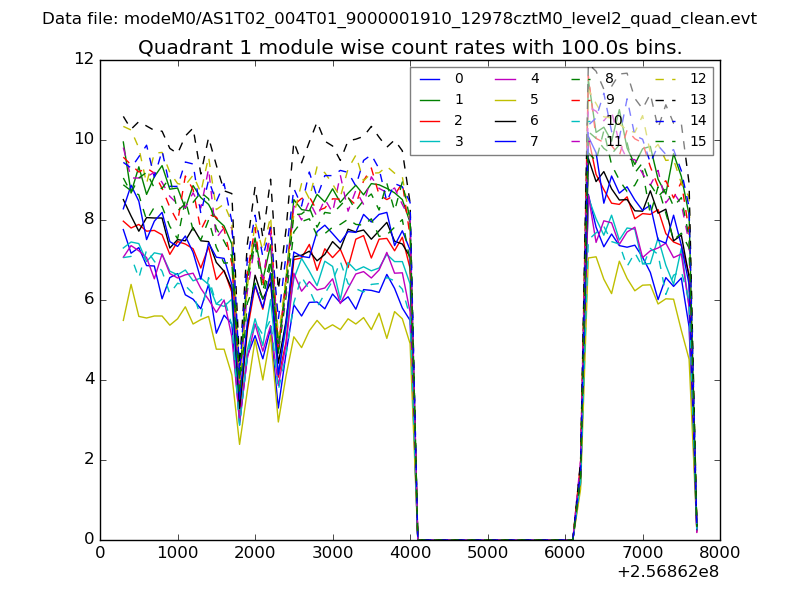
| Module-wise count rates for Quadrant A Data is divided into 100 sec bins |
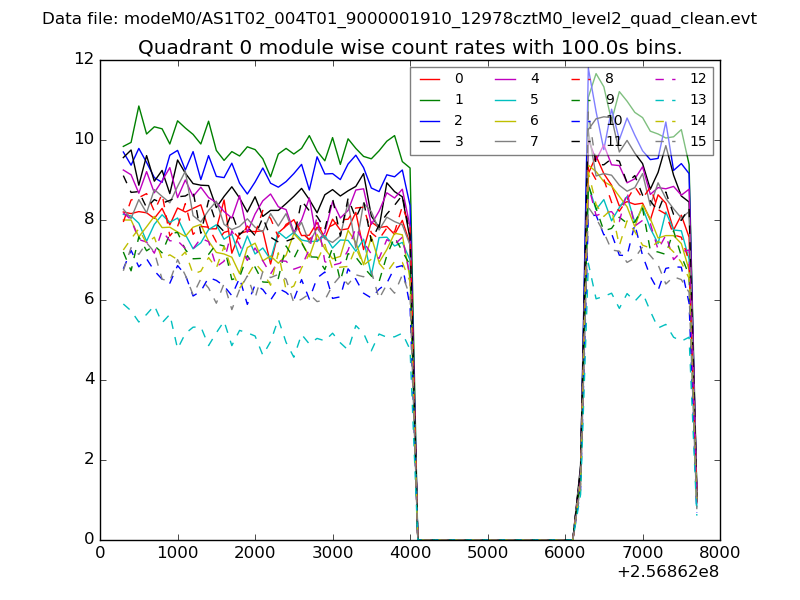 |
 |
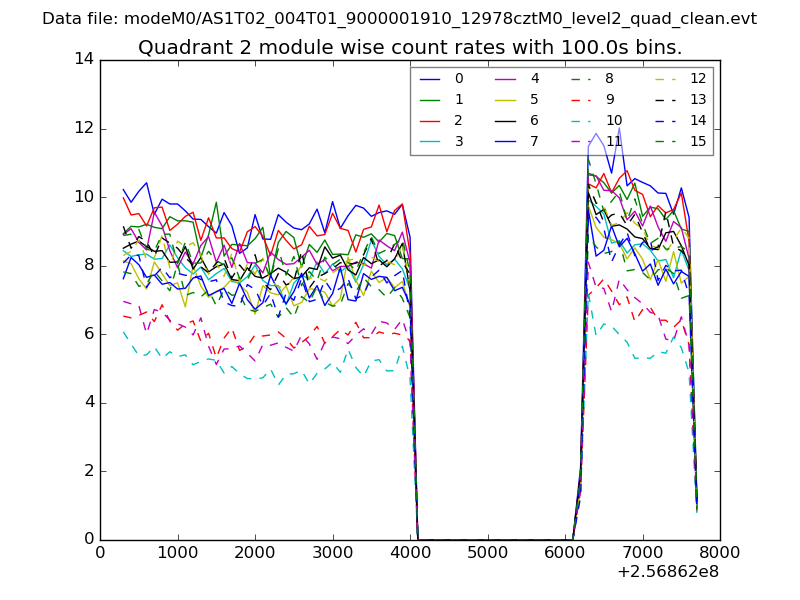
| Module-wise count rates for Quadrant B Data is divided into 100 sec bins |
 |
 |
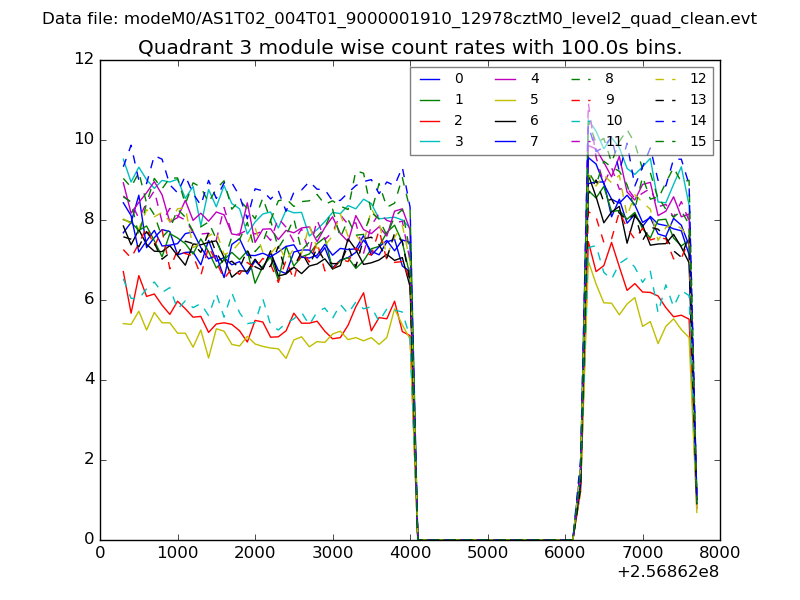
| Module-wise count rates for Quadrant C Data is divided into 100 sec bins |
 |
 |
| Module-wise count rates for Quadrant D Data is divided into 100 sec bins |
 |
 |
| Parameter | Plot |
|---|---|
| CZT HV Monitor | 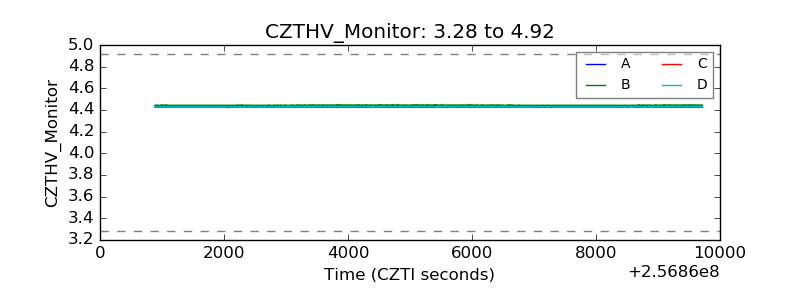 |
| D_VDD |  |
| Temperature 1 |  |
| Veto HV Monitor | 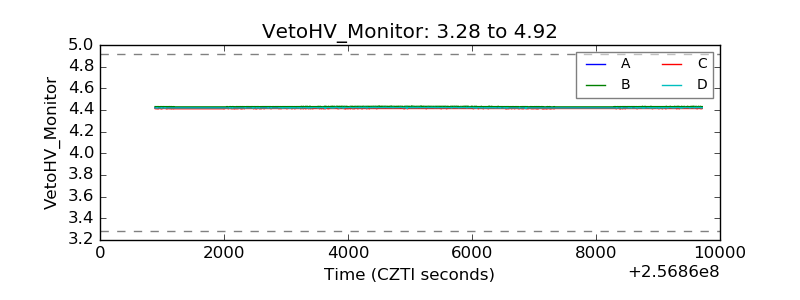 |
| Veto LLD | 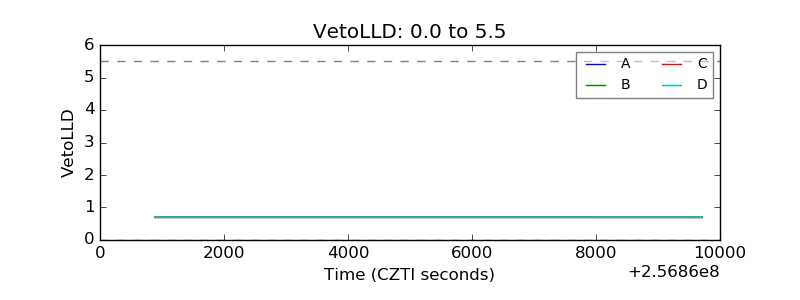 |
| Alpha Counter | 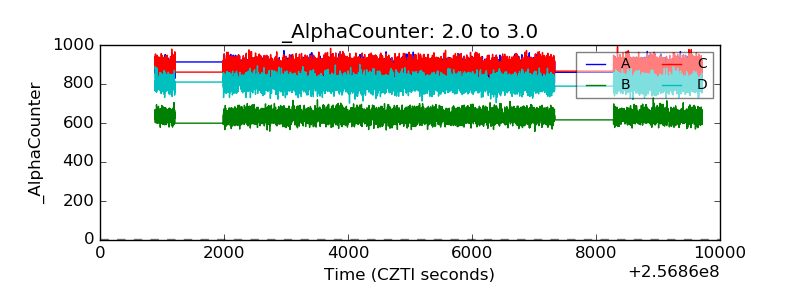 |
| _CPM_Rate | 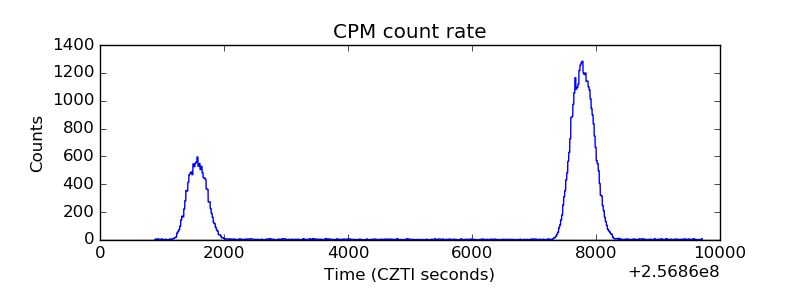 |
| CZT Counter | 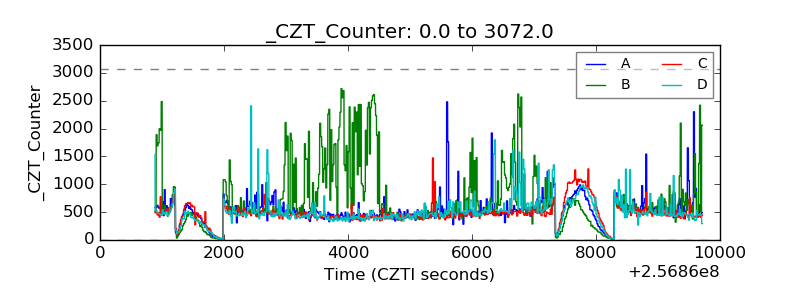 |
| +2.5 Volts monitor |  |
| +5 Volts monitor | 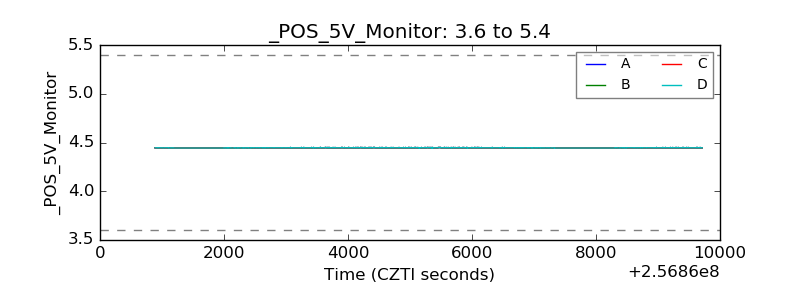 |
| _ROLL_ROT | 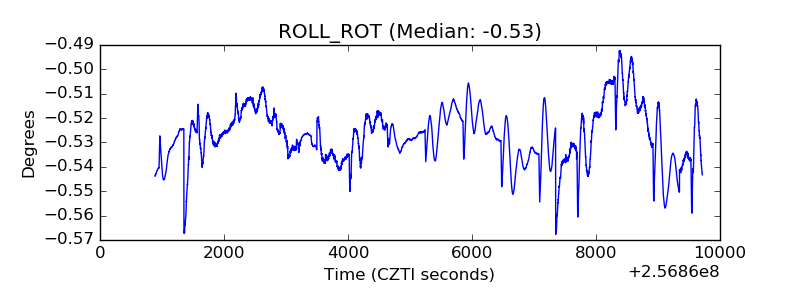 |
| _Roll_DEC | 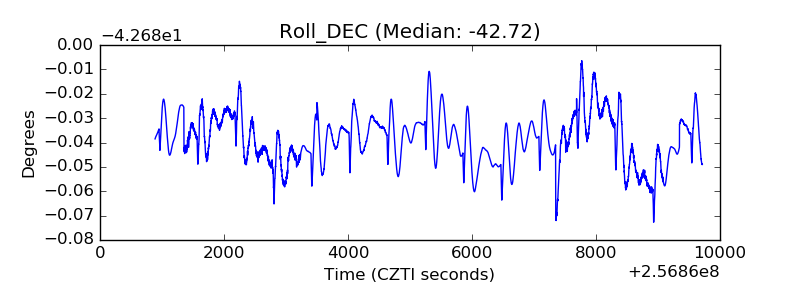 |
| _Roll_RA | 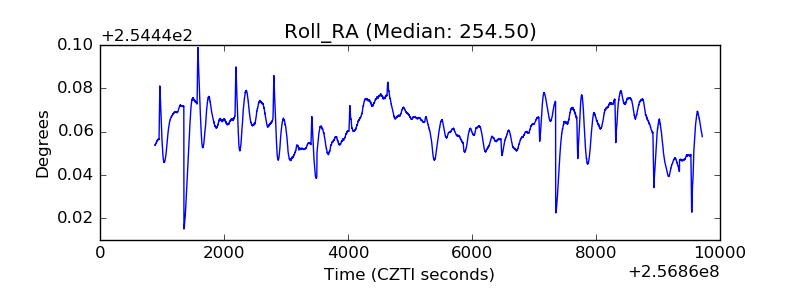 |
| Veto Counter | 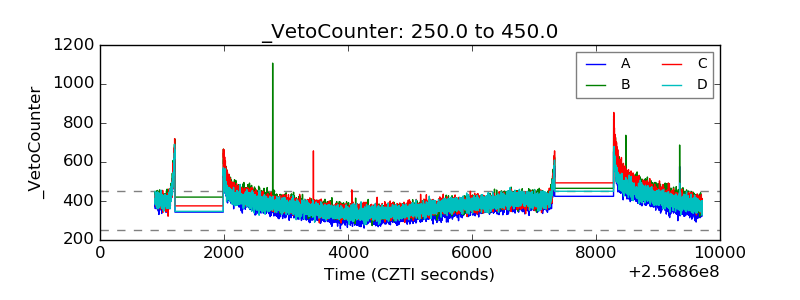 |