| Param | Original file | Final file |
|---|---|---|
| Filename | modeM0/AS1T02_004T01_9000001910_12982cztM0_level2.evt | modeM0/AS1T02_004T01_9000001910_12982cztM0_level2_quad_clean.evt |
| Size (bytes) | 103,789,440 | 31,878,720 |
| Size | 99.0 MB | 30.4 MB |
| Events in quadrant A | 720,173 | 211,990 |
| Events in quadrant B | 840,196 | 217,881 |
| Events in quadrant C | 716,942 | 217,334 |
| Events in quadrant D | 758,875 | 204,318 |
| Mode M0 | |||
|---|---|---|---|
| Quadrant | BADHDUFLAG | Total packets | Discarded packets |
| A | 0 | 3107 | 0 |
| B | 0 | 3477 | 0 |
| C | 0 | 3092 | 0 |
| D | 0 | 3210 | 0 |
| Mode SS | |||
|---|---|---|---|
| Quadrant | BADHDUFLAG | Total packets | Discarded packets |
| A | 0 | 30 | 0 |
| B | 0 | 30 | 0 |
| C | 0 | 30 | 0 |
| D | 0 | 30 | 0 |
| Quadrant | Total seconds | Saturated seconds | Saturation percentage |
|---|---|---|---|
| A | 1534 | 0 | 0.000000% |
| B | 1534 | 12 | 0.782269% |
| C | 1534 | 2 | 0.130378% |
| D | 1534 | 0 | 0.000000% |
Noise dominated data is calculated using 1-second bins in cleaned event files. If a bin has >2000 counts, and if more than 50% of those come from <1% of pixels, then it is considered to be noise-dominated and hence unusable.
| Quadrant | # 1 sec bins | Bins with >0 counts | Bins with >2000 counts | High rate bins dominated by noise | Noise dominated (total time) | Noise dominated (detector-on time) | Marked lightcurve |
|---|---|---|---|---|---|---|---|
| A | 1536 | 1536 | 0 | 0 | 0.00% | 0.00% | 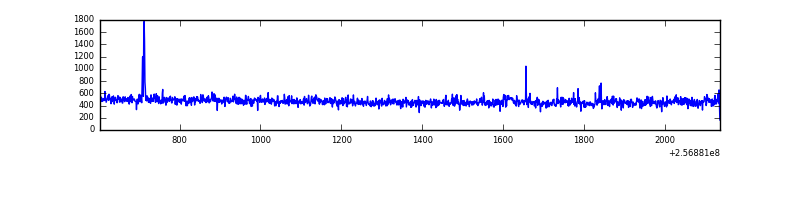 |
| B | 1536 | 1536 | 16 | 16 | 1.04% | 1.04% |  |
| C | 1536 | 1536 | 0 | 0 | 0.00% | 0.00% | 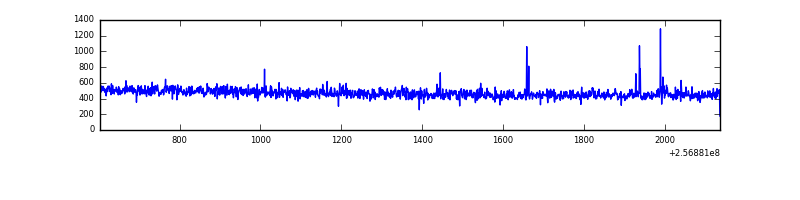 |
| D | 1536 | 1536 | 0 | 0 | 0.00% | 0.00% | 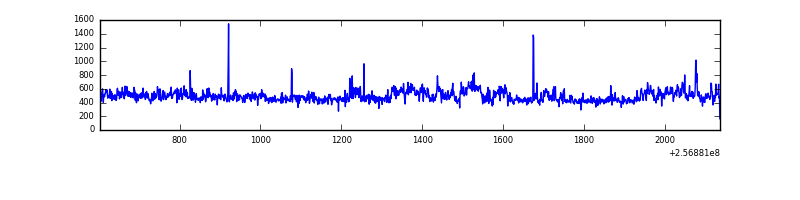 |
Top three noisy pixels from each quadrant. If the there are fewer than three noisy pixels in the level2.evt file, extra rows are filled as -1
| Pixel properties | Quadrant properties | ||||||
|---|---|---|---|---|---|---|---|
| Quadrant | DetID | PixID | Counts | Sigma | Mean | Median | Sigma |
| A | 1 | 162 | 8056 | 211.71 | 178 | 175 | 37.2 |
| A | 12 | 189 | 7826 | 205.53 | 178 | 175 | 37.2 |
| A | 9 | 143 | 4783 | 123.79 | 178 | 175 | 37.2 |
| B | 0 | 85 | 117882 | 3331.3 | 180 | 176 | 35.3 |
| B | 0 | 219 | 15255 | 426.76 | 180 | 176 | 35.3 |
| B | 0 | 214 | 5111 | 139.67 | 180 | 176 | 35.3 |
| C | 0 | 207 | 3612 | 78.41 | 182 | 183 | 43.7 |
| C | 14 | 234 | 1689 | 34.44 | 182 | 183 | 43.7 |
| C | 5 | 96 | 1559 | 31.47 | 182 | 183 | 43.7 |
| D | 1 | 52 | 83045 | 1887.17 | 177 | 171 | 43.9 |
| D | 8 | 195 | 8426 | 187.98 | 177 | 171 | 43.9 |
| D | 2 | 234 | 5930 | 131.14 | 177 | 171 | 43.9 |
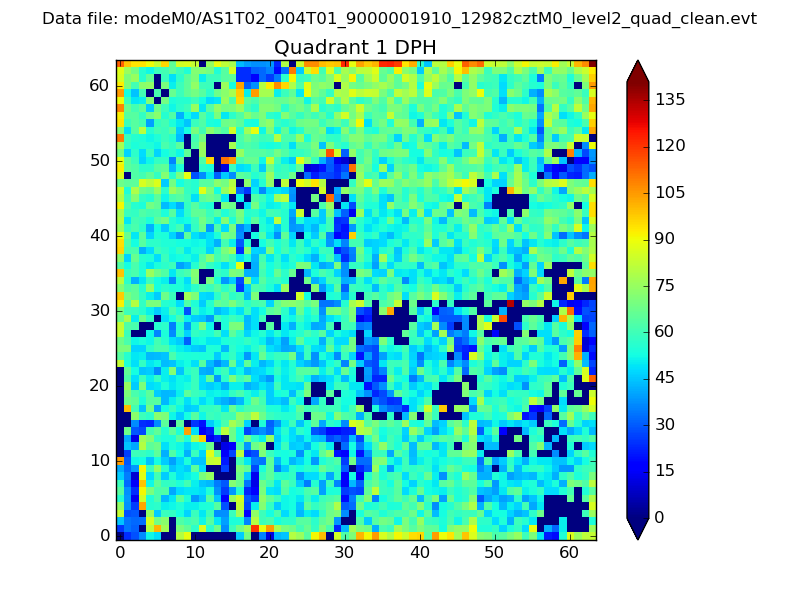
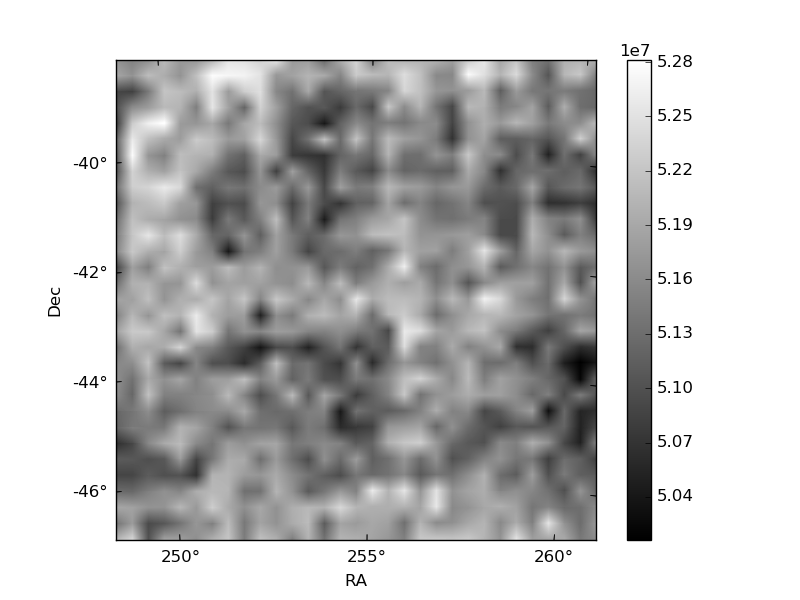
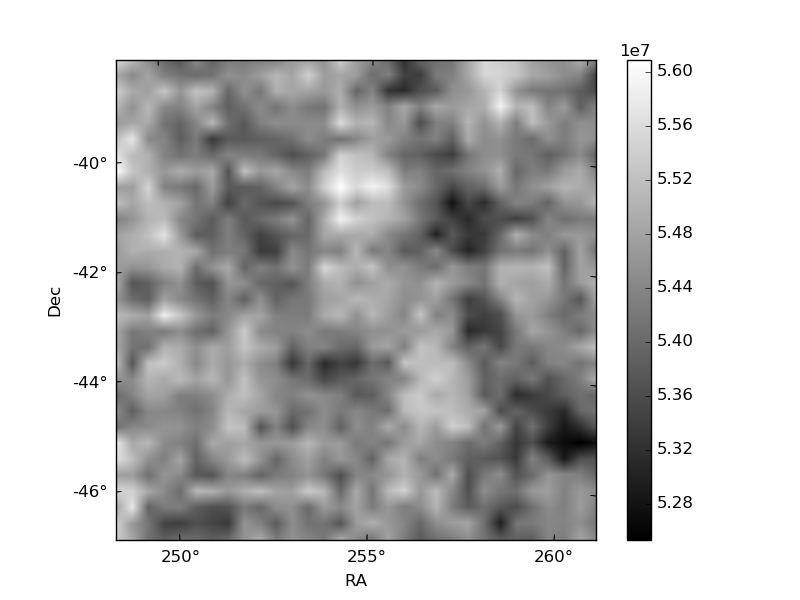
Histogram calculated using DETX and DETY for each event in the final _common_clean file
| Quadrant A | 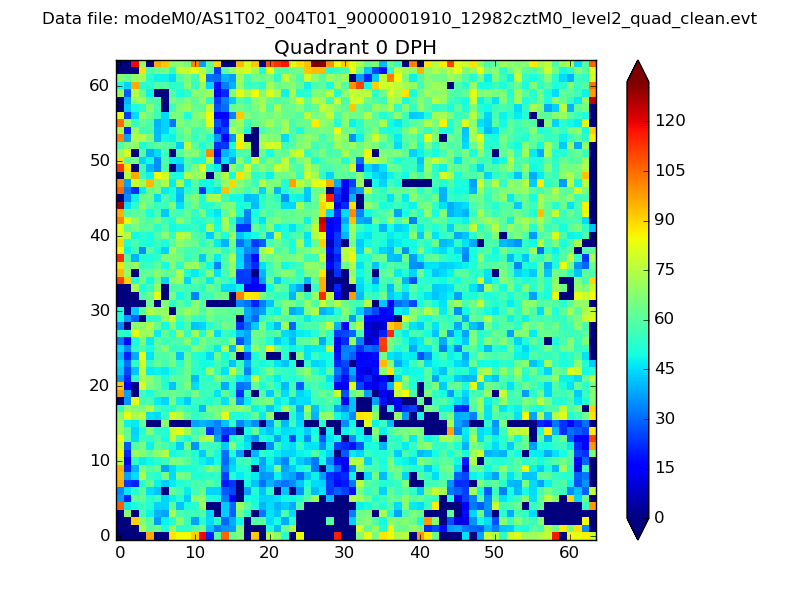 |
 |
Quadrant B |
|---|---|---|---|
| Quadrant D | 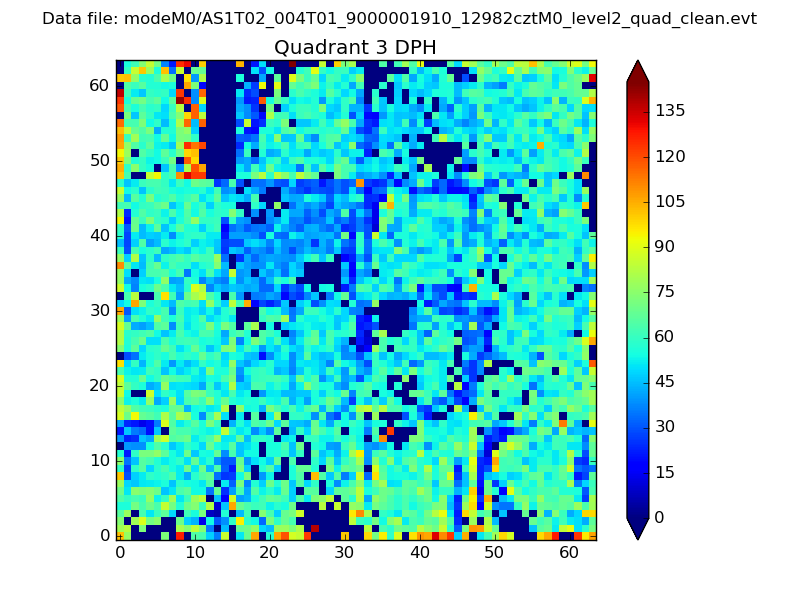 |
 |
Quadrant C |
| Plot type | Count rate plots | Images |
|---|---|---|
| Comparison with Poisson distribution Blue bars denote a histogram of data divided into 1 sec bins. Red curve is a Poisson curve with rate = median count rate of data. |
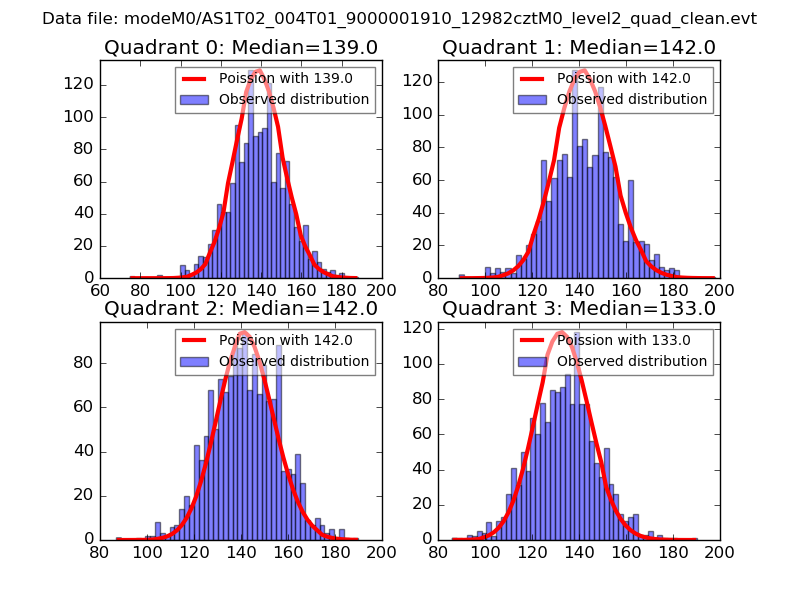 |
 |
| Quadrant-wise count rates Data is divided into 100 sec bins |
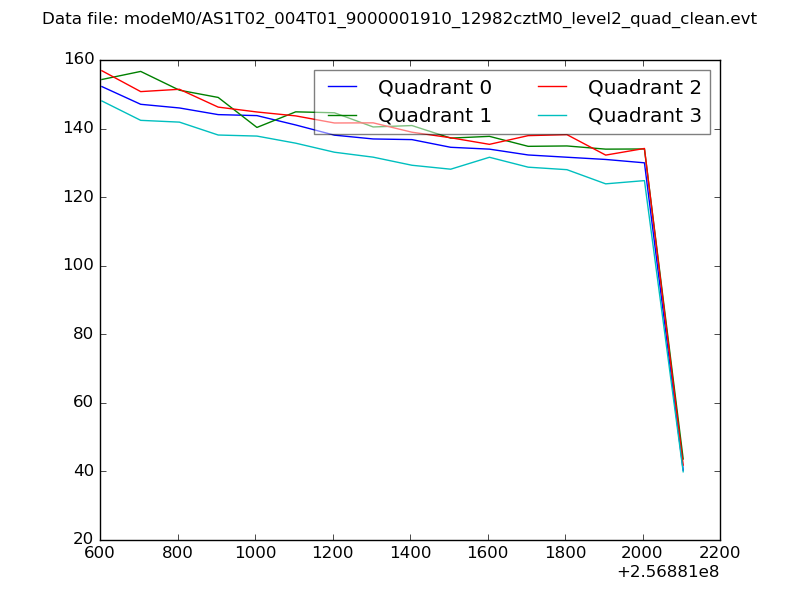 |
|
| Module-wise count rates for Quadrant A Data is divided into 100 sec bins |
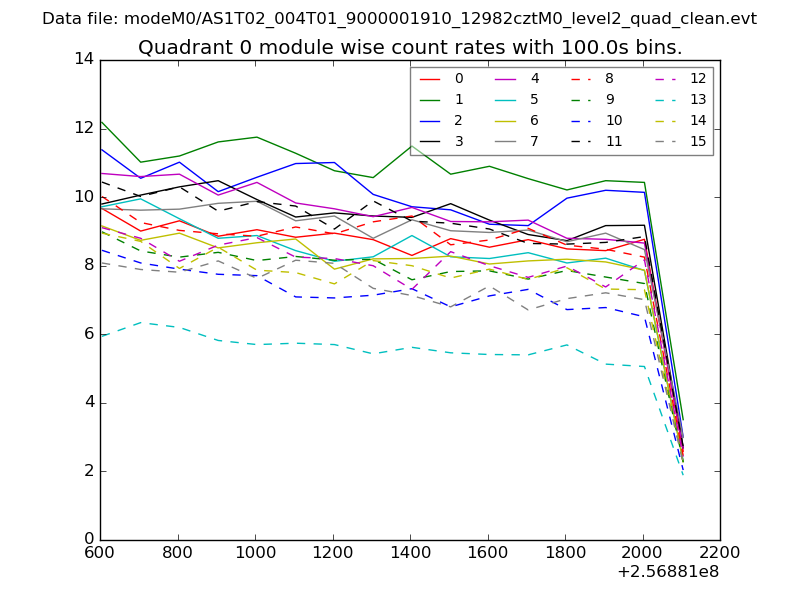 |
 |
| Module-wise count rates for Quadrant B Data is divided into 100 sec bins |
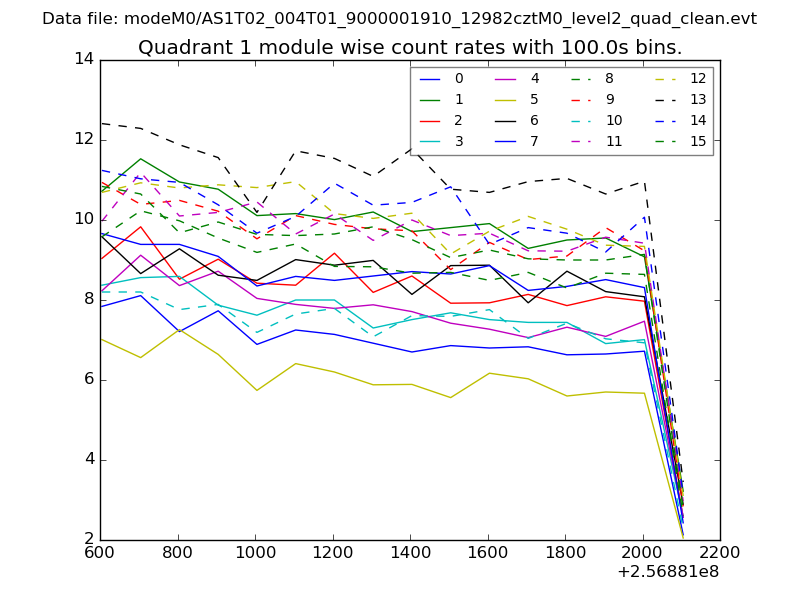 |
 |
| Module-wise count rates for Quadrant C Data is divided into 100 sec bins |
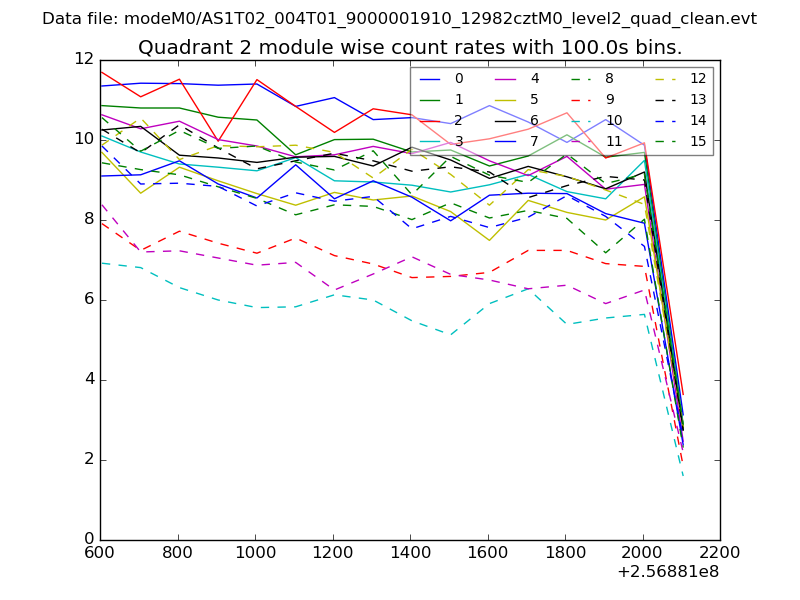 |
 |
| Module-wise count rates for Quadrant D Data is divided into 100 sec bins |
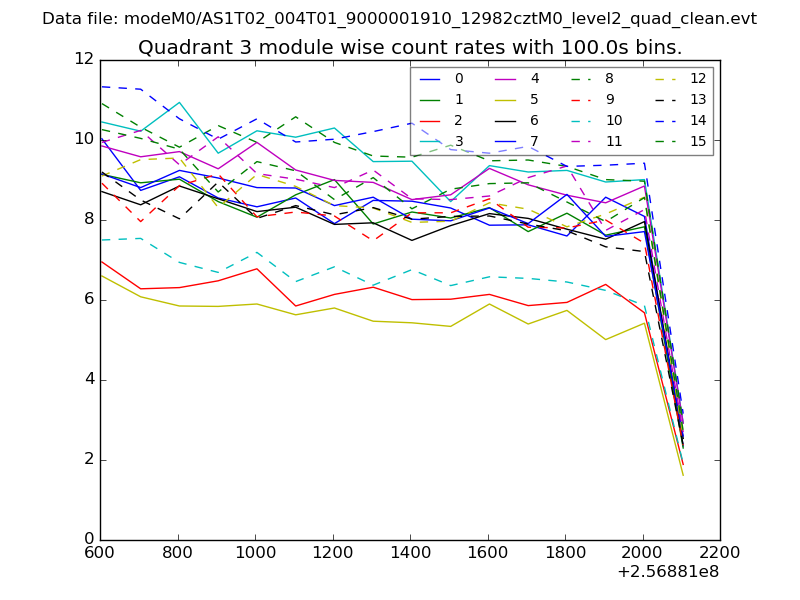 |
 |
| Parameter | Plot |
|---|---|
| CZT HV Monitor | 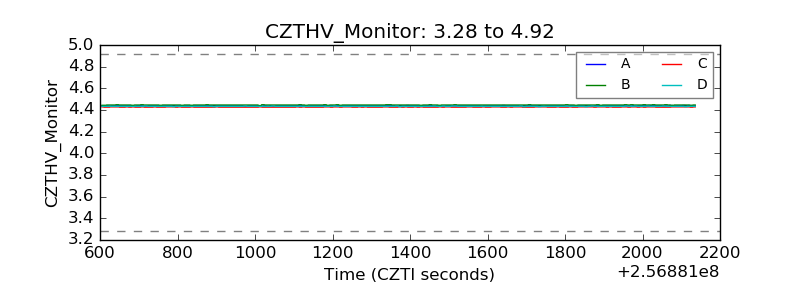 |
| D_VDD | 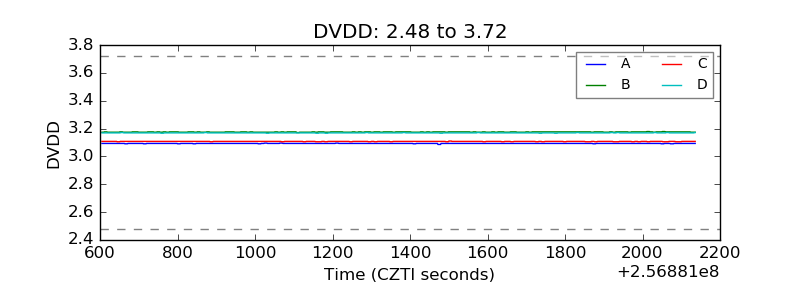 |
| Temperature 1 | 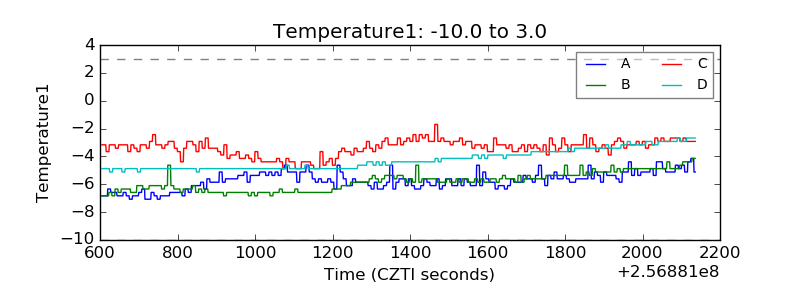 |
| Veto HV Monitor | 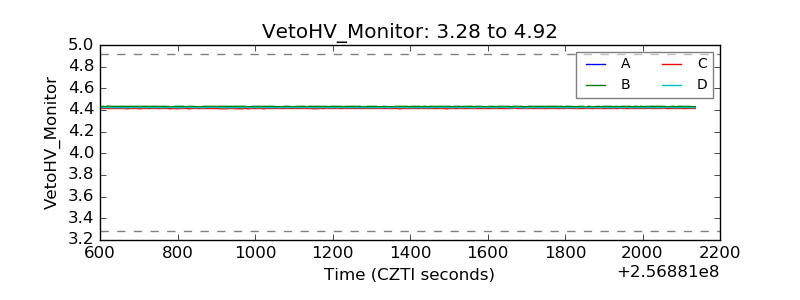 |
| Veto LLD | 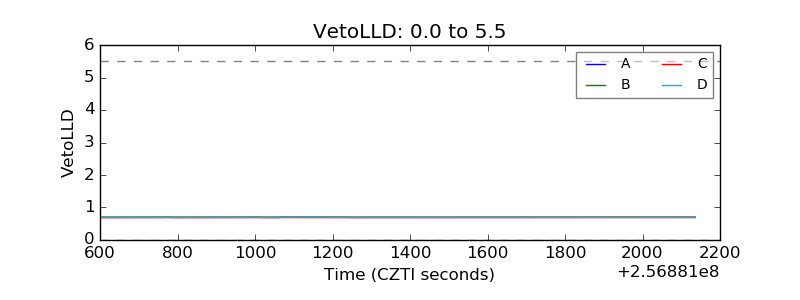 |
| Alpha Counter | 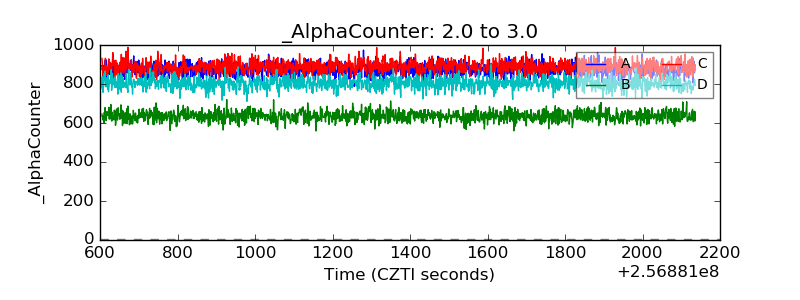 |
| _CPM_Rate | 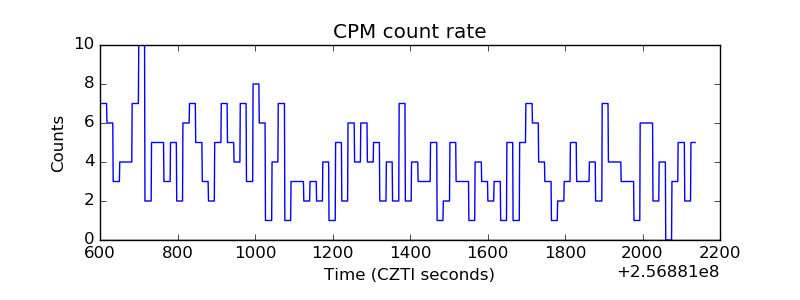 |
| CZT Counter | 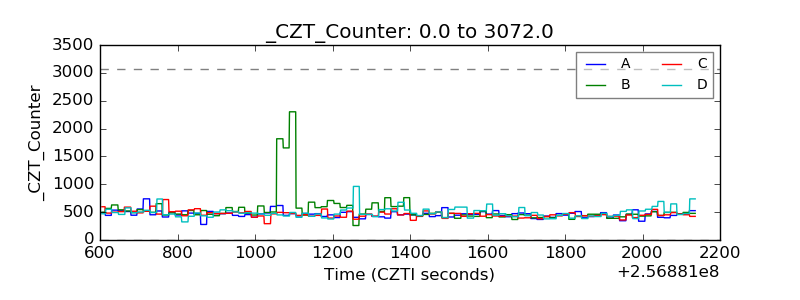 |
| +2.5 Volts monitor |  |
| +5 Volts monitor |  |
| _ROLL_ROT | 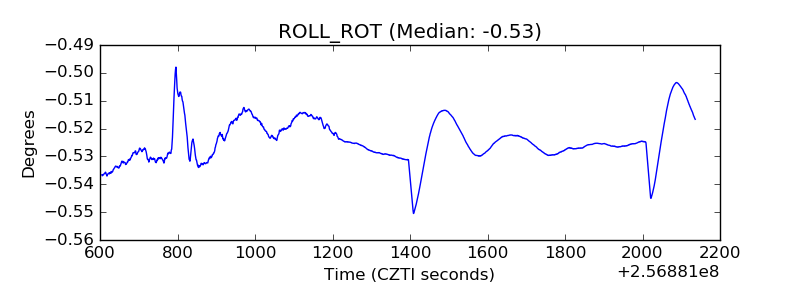 |
| _Roll_DEC | 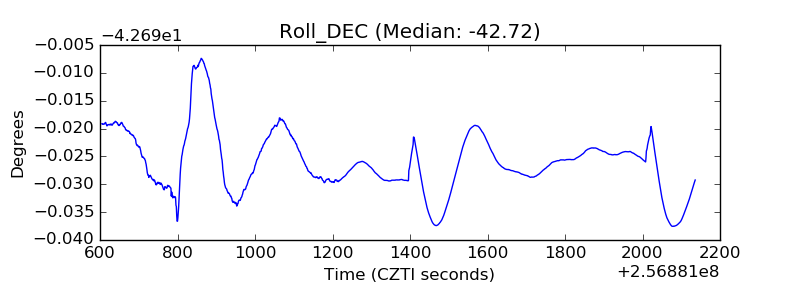 |
| _Roll_RA |  |
| Veto Counter | 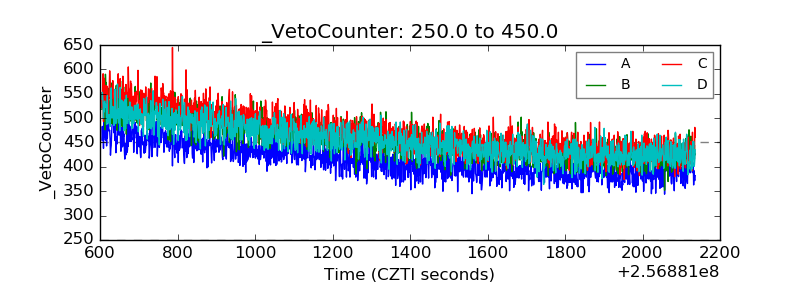 |