| Param | Original file | Final file |
|---|---|---|
| Filename | modeM0/AS1G08_055T01_9000001912cztM0_level2.fits | modeM0/AS1G08_055T01_9000001912cztM0_level2_quad_clean.evt |
| Size (bytes) | 1,083,320,640 | 1,015,894,080 |
| Size | 1.0 GB | 968.8 MB |
| Events in quadrant A | 6,650,890 | 6,168,760 |
| Events in quadrant B | 5,914,244 | 5,457,590 |
| Events in quadrant C | 6,672,780 | 5,927,463 |
| Events in quadrant D | 5,733,160 | 5,382,738 |
| Mode M9 | |||
|---|---|---|---|
| Quadrant | BADHDUFLAG | Total packets | Discarded packets |
| A | 0 | 179 | 0 |
| B | 0 | 179 | 0 |
| C | 0 | 179 | 0 |
| D | 0 | 179 | 0 |
| Mode SS | |||
|---|---|---|---|
| Quadrant | BADHDUFLAG | Total packets | Discarded packets |
| A | 0 | 2328 | 0 |
| B | 0 | 2328 | 0 |
| C | 0 | 2328 | 0 |
| D | 0 | 2328 | 0 |
| Mode M0 | |||
|---|---|---|---|
| Quadrant | BADHDUFLAG | Total packets | Discarded packets |
| A | 0 | 244984 | 0 |
| B | 0 | 341474 | 0 |
| C | 0 | 235255 | 0 |
| D | 0 | 282959 | 0 |
| Quadrant | Total seconds | Saturated seconds | Saturation percentage |
|---|---|---|---|
| A | 114246 | 1563 | 1.368100% |
| B | 114246 | 15269 | 13.365019% |
| C | 114246 | 1029 | 0.900688% |
| D | 114246 | 3536 | 3.095076% |
Noise dominated data is calculated using 1-second bins in cleaned event files. If a bin has >2000 counts, and if more than 50% of those come from <1% of pixels, then it is considered to be noise-dominated and hence unusable.
| Quadrant | # 1 sec bins | Bins with >0 counts | Bins with >2000 counts | High rate bins dominated by noise | Noise dominated (total time) | Noise dominated (detector-on time) | Marked lightcurve |
|---|---|---|---|---|---|---|---|
| A | 132227 | 114245 | 0 | 0 | 0.00% | 0.00% |  |
| B | 132227 | 111792 | 0 | 0 | 0.00% | 0.00% |  |
| C | 132227 | 114245 | 0 | 0 | 0.00% | 0.00% |  |
| D | 132227 | 114221 | 0 | 0 | 0.00% | 0.00% |  |
Top three noisy pixels from each quadrant. If the there are fewer than three noisy pixels in the level2.evt file, extra rows are filled as -1
| Pixel properties | Quadrant properties | ||||||
|---|---|---|---|---|---|---|---|
| Quadrant | DetID | PixID | Counts | Sigma | Mean | Median | Sigma |
| A | 0 | 29 | 6472 | 11.39 | 1732 | 1625 | 425.4 |
| A | 7 | 110 | 5493 | 9.09 | 1732 | 1625 | 425.4 |
| A | 9 | 19 | 5046 | 8.04 | 1732 | 1625 | 425.4 |
| B | 2 | 9 | 5193 | 12.34 | 1560 | 1493 | 299.9 |
| B | 3 | 17 | 4021 | 8.43 | 1560 | 1493 | 299.9 |
| B | 14 | 254 | 3904 | 8.04 | 1560 | 1493 | 299.9 |
| C | 1 | 80 | 5077 | 7.62 | 1761 | 1647 | 450.3 |
| C | 1 | 81 | 4988 | 7.42 | 1761 | 1647 | 450.3 |
| C | 12 | 241 | 4617 | 6.6 | 1761 | 1647 | 450.3 |
| D | 6 | 231 | 4241 | 6.35 | 1633 | 1489 | 433.1 |
| D | 3 | 14 | 4032 | 5.87 | 1633 | 1489 | 433.1 |
| D | 7 | 5 | 3990 | 5.77 | 1633 | 1489 | 433.1 |
Histogram calculated using DETX and DETY for each event in the final _common_clean file
| Quadrant A |  |
 |
Quadrant B |
|---|---|---|---|
| Quadrant D | 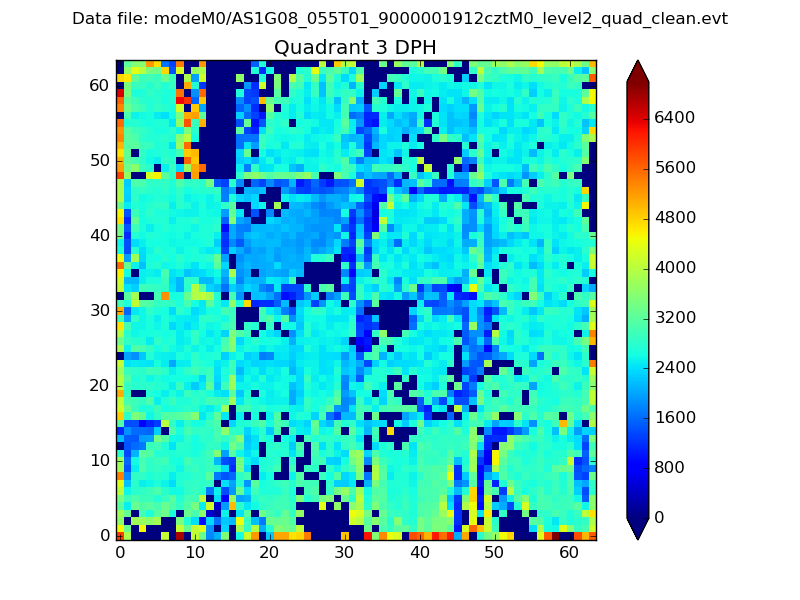 |
 |
Quadrant C |
| Plot type | Count rate plots | Images |
|---|---|---|
| Comparison with Poisson distribution Blue bars denote a histogram of data divided into 1 sec bins. Red curve is a Poisson curve with rate = median count rate of data. |
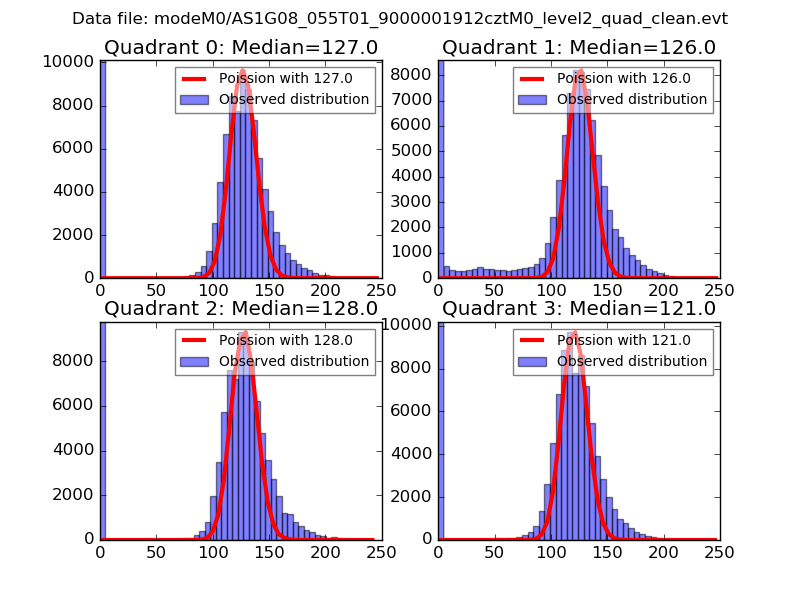 |
 |
| Quadrant-wise count rates Data is divided into 100 sec bins |
 |
|
| Module-wise count rates for Quadrant A Data is divided into 100 sec bins |
 |
 |
| Module-wise count rates for Quadrant B Data is divided into 100 sec bins |
 |
 |
| Module-wise count rates for Quadrant C Data is divided into 100 sec bins |
 |
 |
| Module-wise count rates for Quadrant D Data is divided into 100 sec bins |
 |
 |
| Parameter | Plot |
|---|---|
| CZT HV Monitor |  |
| D_VDD |  |
| Temperature 1 |  |
| Veto HV Monitor |  |
| Veto LLD |  |
| Alpha Counter |  |
| _CPM_Rate |  |
| CZT Counter | 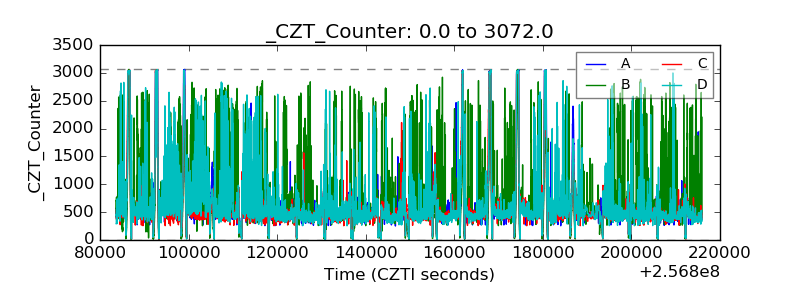 |
| +2.5 Volts monitor |  |
| +5 Volts monitor |  |
| _ROLL_ROT |  |
| _Roll_DEC |  |
| _Roll_RA |  |
| Veto Counter |  |