| Param | Original file | Final file |
|---|---|---|
| Filename | modeM0/AS1G08_055T01_9000001912_12982cztM0_level2.evt | modeM0/AS1G08_055T01_9000001912_12982cztM0_level2_quad_clean.evt |
| Size (bytes) | 278,291,520 | 52,416,000 |
| Size | 265.4 MB | 50.0 MB |
| Events in quadrant A | 1,863,421 | 347,110 |
| Events in quadrant B | 2,366,899 | 314,024 |
| Events in quadrant C | 1,730,046 | 352,869 |
| Events in quadrant D | 2,234,467 | 330,996 |
| Mode M9 | |||
|---|---|---|---|
| Quadrant | BADHDUFLAG | Total packets | Discarded packets |
| A | 0 | 13 | 0 |
| B | 0 | 13 | 0 |
| C | 0 | 13 | 0 |
| D | 0 | 13 | 0 |
| Mode SS | |||
|---|---|---|---|
| Quadrant | BADHDUFLAG | Total packets | Discarded packets |
| A | 0 | 70 | 0 |
| B | 0 | 70 | 0 |
| C | 0 | 70 | 0 |
| D | 0 | 70 | 0 |
| Mode M0 | |||
|---|---|---|---|
| Quadrant | BADHDUFLAG | Total packets | Discarded packets |
| A | 0 | 7528 | 2 |
| B | 0 | 9219 | 1 |
| C | 0 | 7227 | 1 |
| D | 0 | 8749 | 1 |
| Quadrant | Total seconds | Saturated seconds | Saturation percentage |
|---|---|---|---|
| A | 3410 | 22 | 0.645161% |
| B | 3410 | 432 | 12.668622% |
| C | 3410 | 27 | 0.791789% |
| D | 3410 | 168 | 4.926686% |
Noise dominated data is calculated using 1-second bins in cleaned event files. If a bin has >2000 counts, and if more than 50% of those come from <1% of pixels, then it is considered to be noise-dominated and hence unusable.
| Quadrant | # 1 sec bins | Bins with >0 counts | Bins with >2000 counts | High rate bins dominated by noise | Noise dominated (total time) | Noise dominated (detector-on time) | Marked lightcurve |
|---|---|---|---|---|---|---|---|
| A | 4715 | 3412 | 0 | 0 | 0.00% | 0.00% | 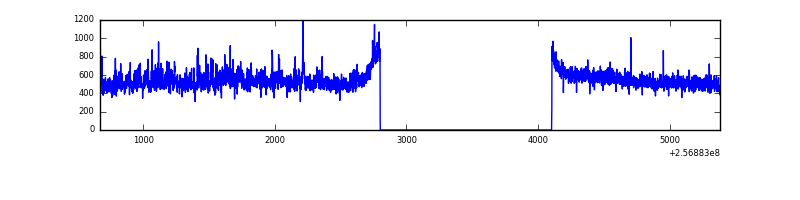 |
| B | 4715 | 3412 | 107 | 107 | 2.27% | 3.14% | 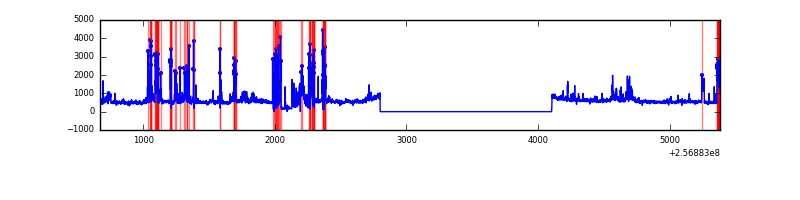 |
| C | 4715 | 3411 | 0 | 0 | 0.00% | 0.00% | 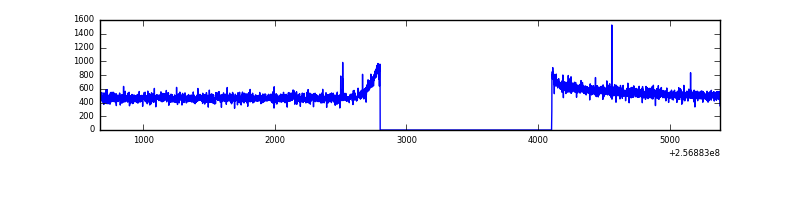 |
| D | 4715 | 3411 | 110 | 110 | 2.33% | 3.22% | 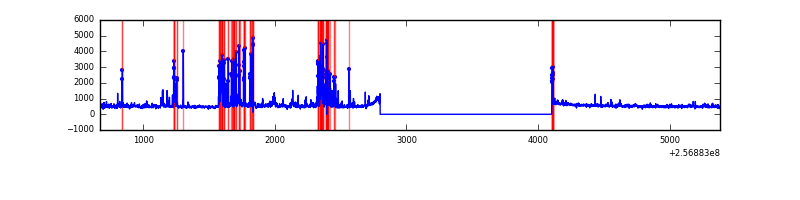 |
Top three noisy pixels from each quadrant. If the there are fewer than three noisy pixels in the level2.evt file, extra rows are filled as -1
| Pixel properties | Quadrant properties | ||||||
|---|---|---|---|---|---|---|---|
| Quadrant | DetID | PixID | Counts | Sigma | Mean | Median | Sigma |
| A | 12 | 189 | 88717 | 971.23 | 446 | 438 | 90.9 |
| A | 8 | 15 | 29154 | 315.93 | 446 | 438 | 90.9 |
| A | 1 | 162 | 14601 | 155.82 | 446 | 438 | 90.9 |
| B | 4 | 239 | 465538 | 6081.07 | 406 | 397 | 76.5 |
| B | 0 | 85 | 178698 | 2331.04 | 406 | 397 | 76.5 |
| B | 3 | 64 | 60014 | 779.41 | 406 | 397 | 76.5 |
| C | 13 | 61 | 3211 | 27.08 | 442 | 444 | 102.2 |
| C | 12 | 4 | 2166 | 16.86 | 442 | 444 | 102.2 |
| C | 3 | 202 | 1143 | 6.84 | 442 | 444 | 102.2 |
| D | 1 | 52 | 509972 | 4929.74 | 429 | 419 | 103.4 |
| D | 8 | 195 | 73783 | 709.77 | 429 | 419 | 103.4 |
| D | 13 | 122 | 16602 | 156.56 | 429 | 419 | 103.4 |
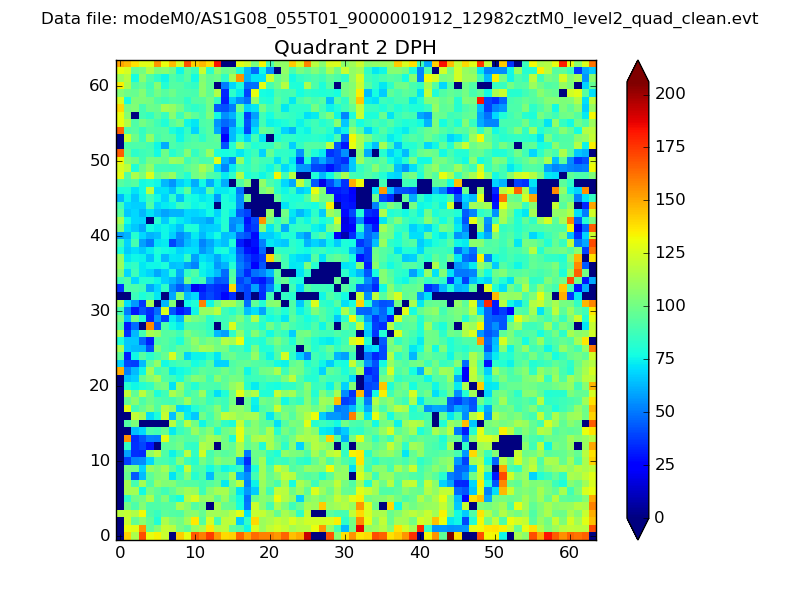
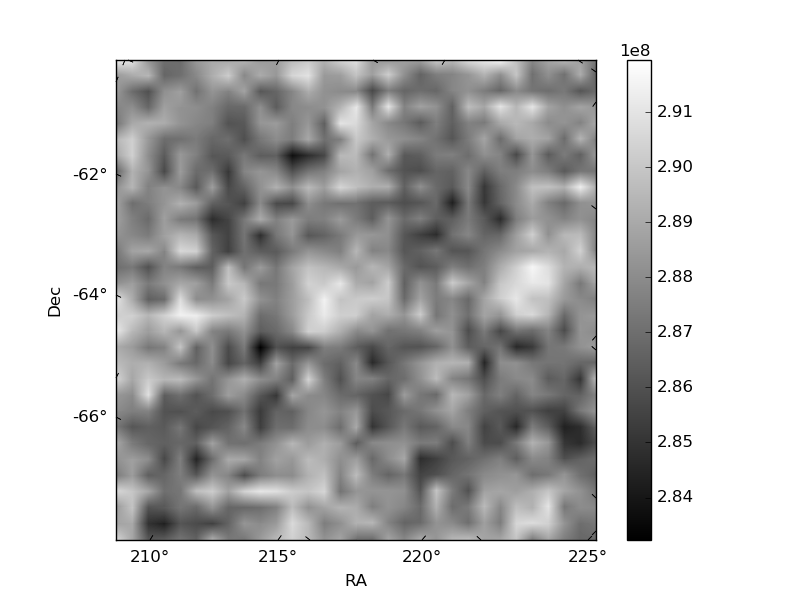
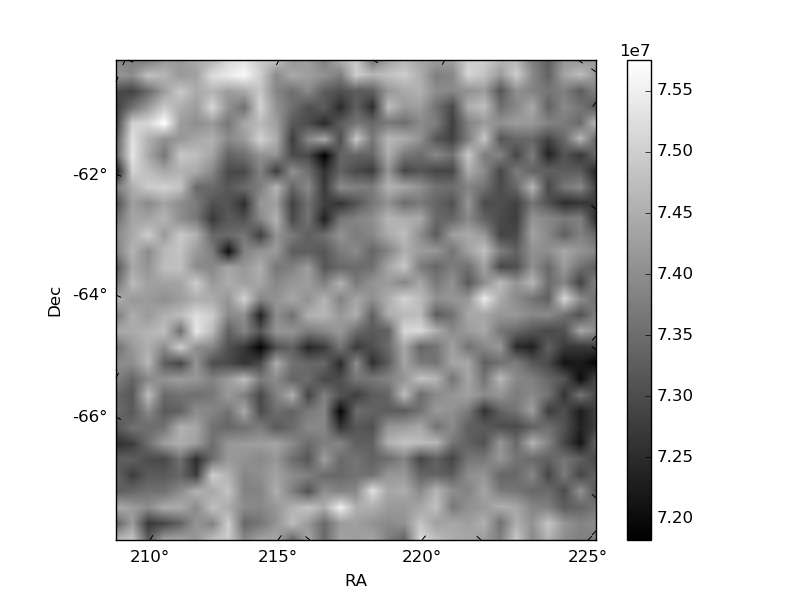
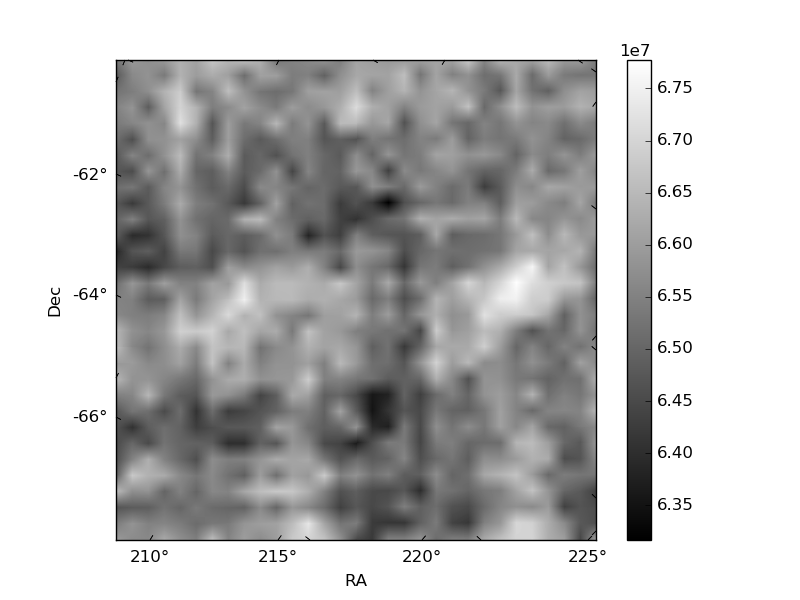
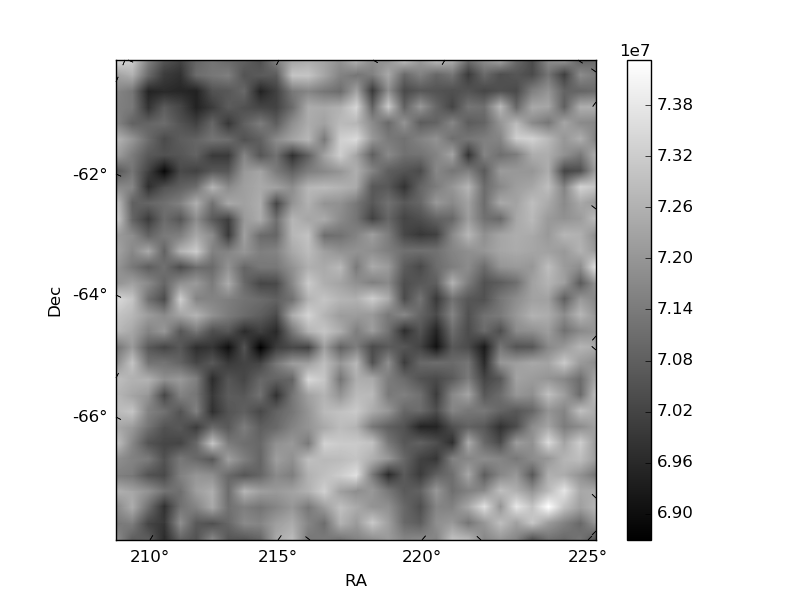
Histogram calculated using DETX and DETY for each event in the final _common_clean file
| Quadrant A | 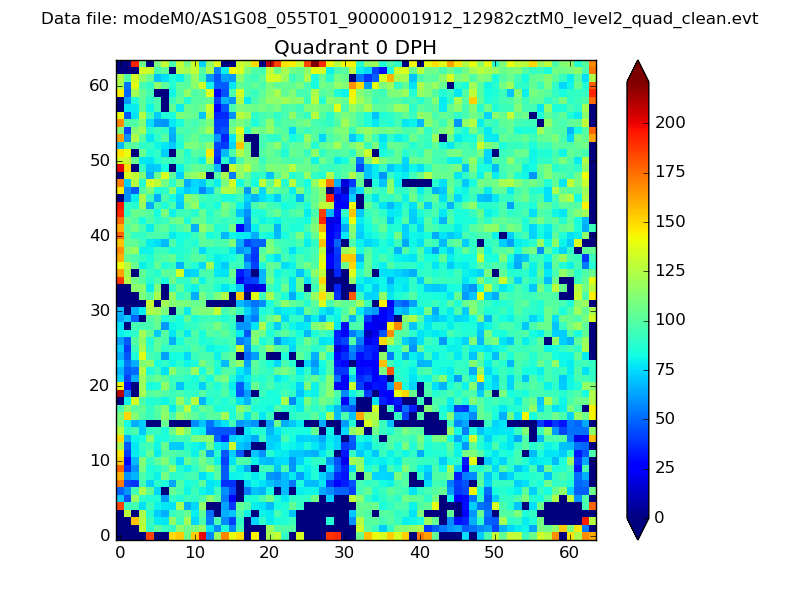 |
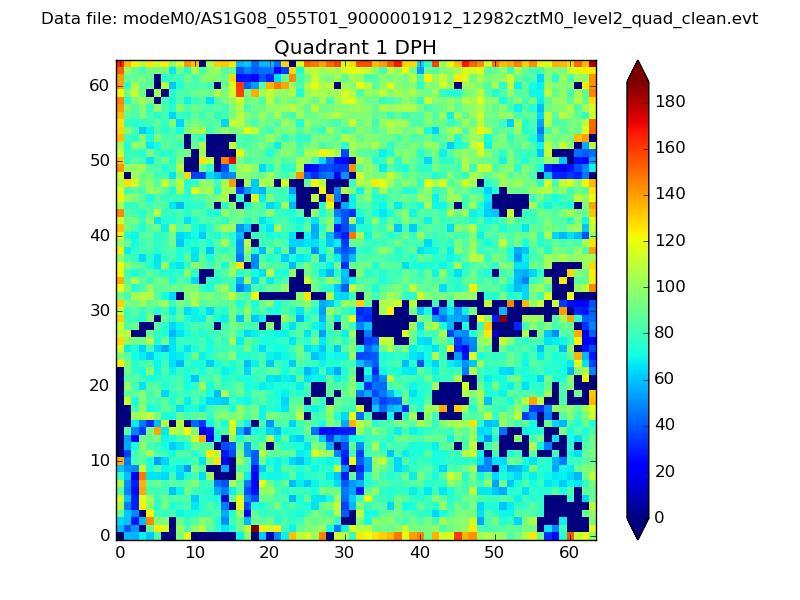 |
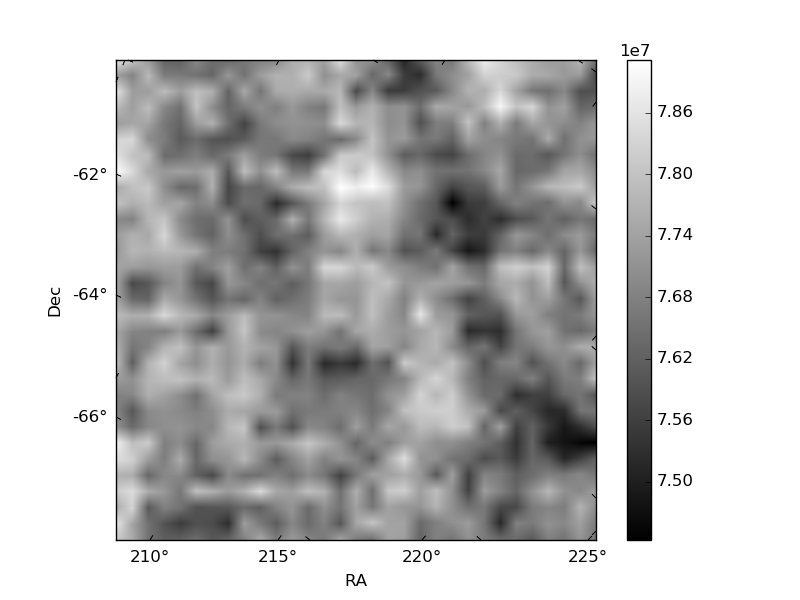
Quadrant B |
|---|---|---|---|
| Quadrant D | 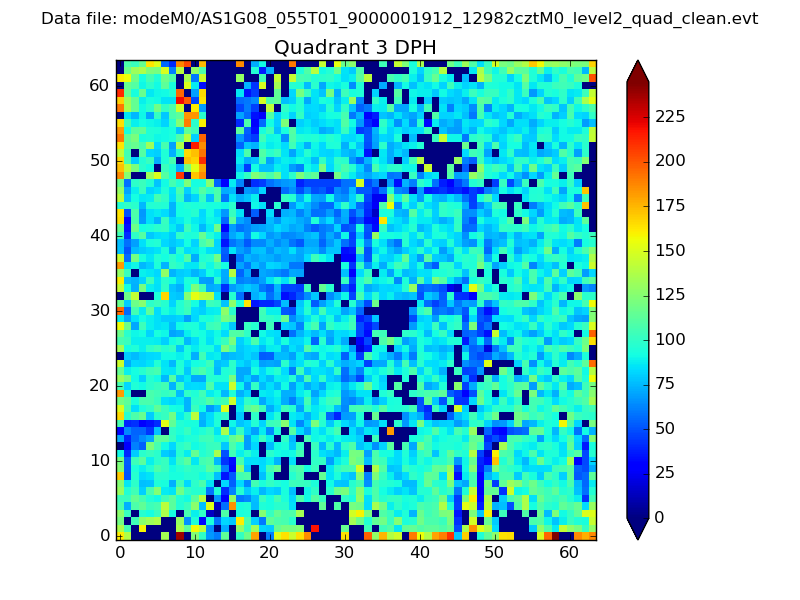 |
 |
Quadrant C |
| Plot type | Count rate plots | Images |
|---|---|---|
| Comparison with Poisson distribution Blue bars denote a histogram of data divided into 1 sec bins. Red curve is a Poisson curve with rate = median count rate of data. |
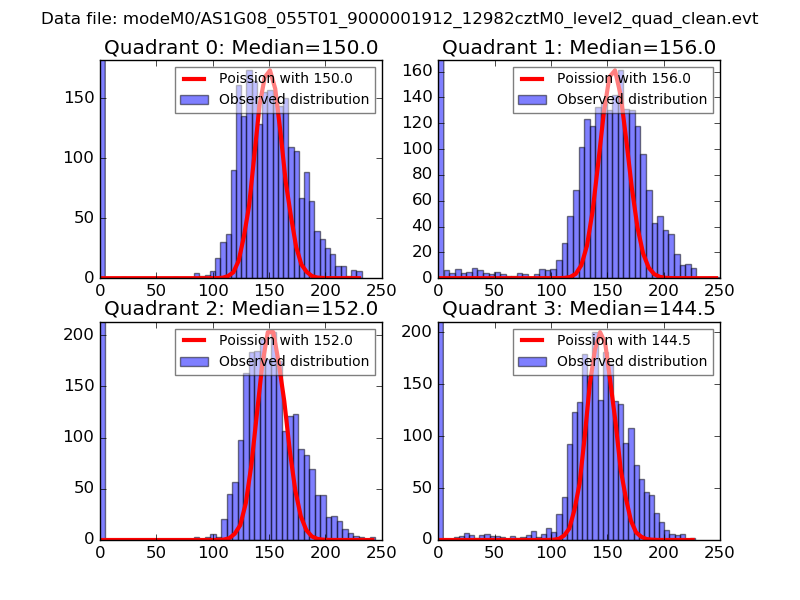 |
 |
| Quadrant-wise count rates Data is divided into 100 sec bins |
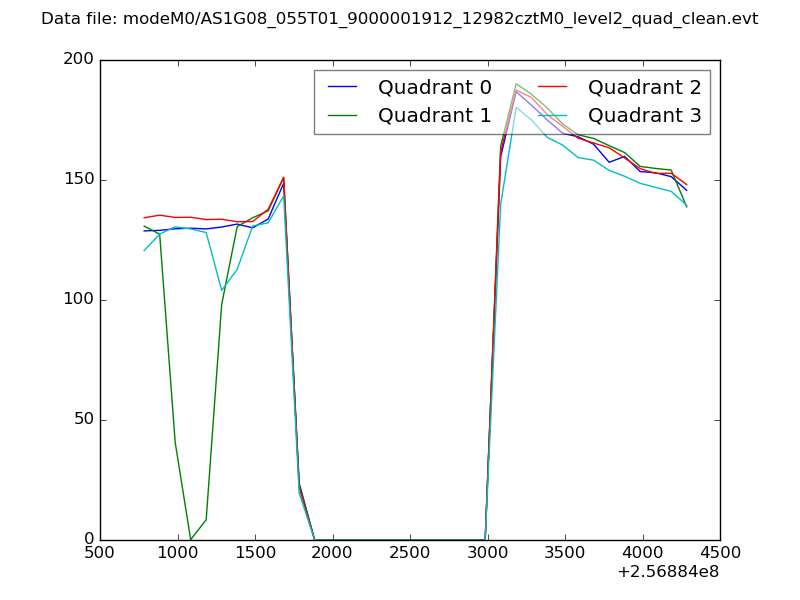 |
|
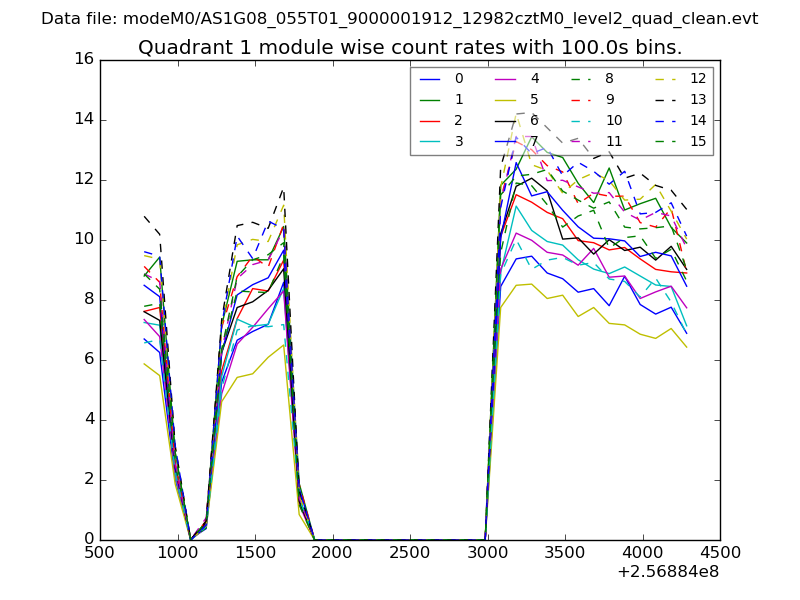
| Module-wise count rates for Quadrant A Data is divided into 100 sec bins |
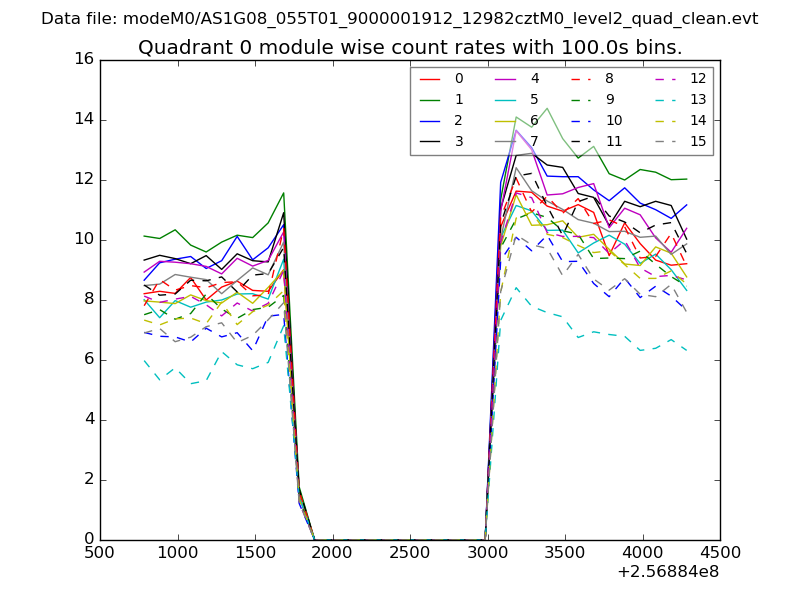 |
 |
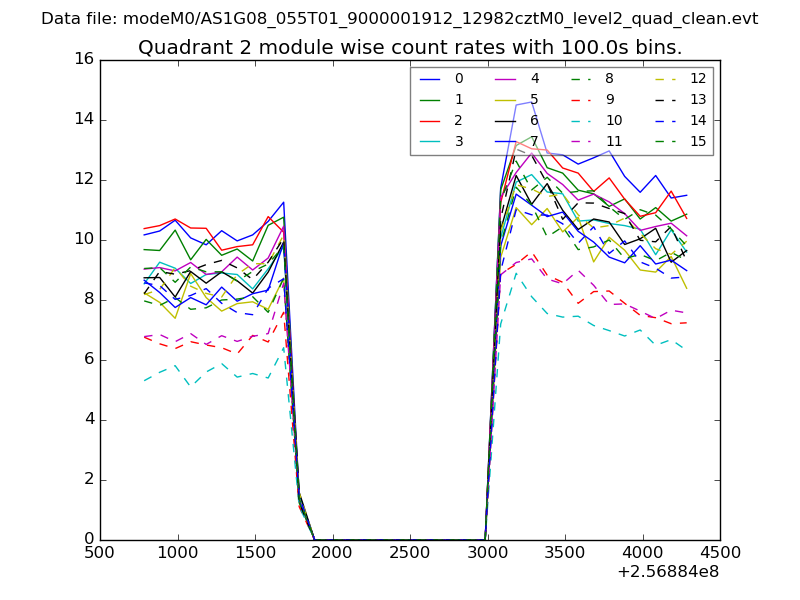
| Module-wise count rates for Quadrant B Data is divided into 100 sec bins |
 |
 |
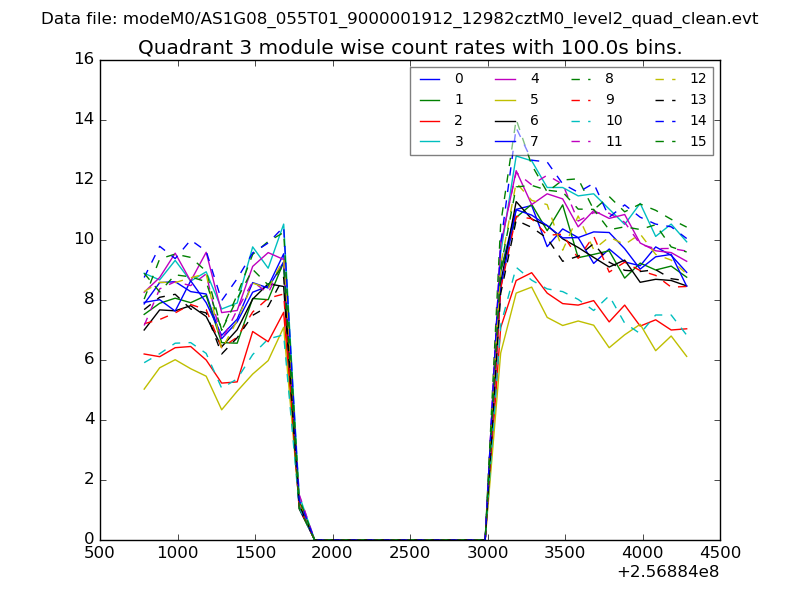
| Module-wise count rates for Quadrant C Data is divided into 100 sec bins |
 |
 |
| Module-wise count rates for Quadrant D Data is divided into 100 sec bins |
 |
 |
| Parameter | Plot |
|---|---|
| CZT HV Monitor | 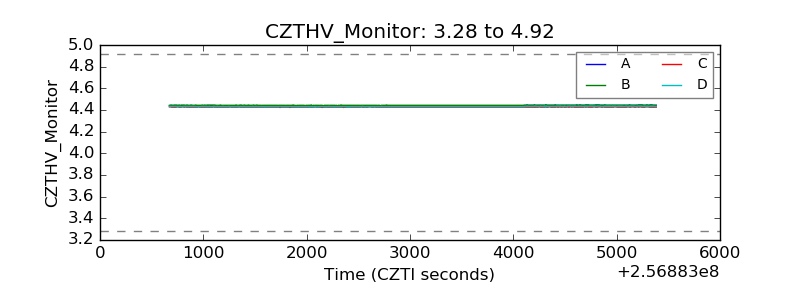 |
| D_VDD | 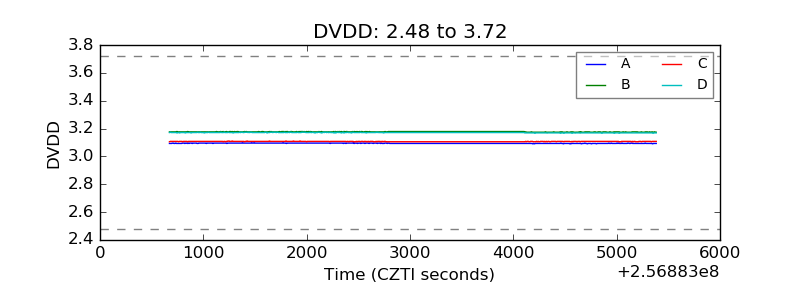 |
| Temperature 1 | 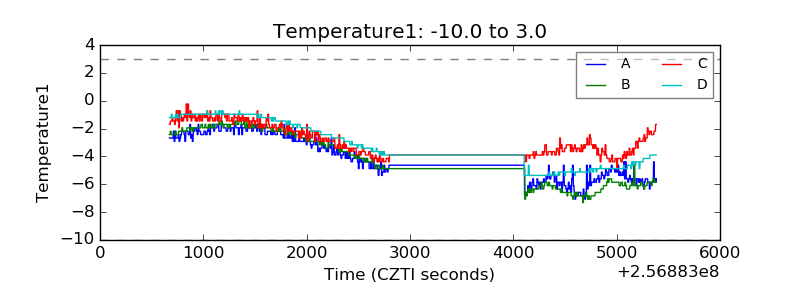 |
| Veto HV Monitor |  |
| Veto LLD | 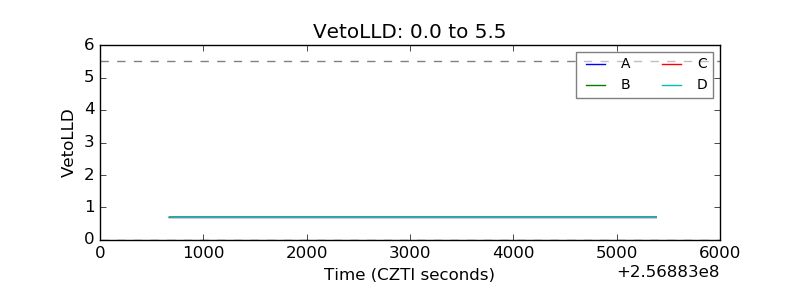 |
| Alpha Counter | 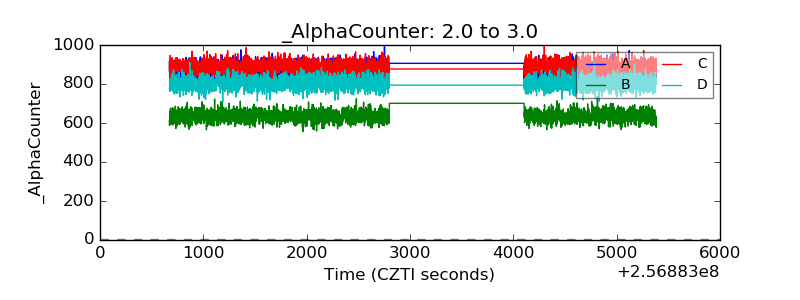 |
| _CPM_Rate | 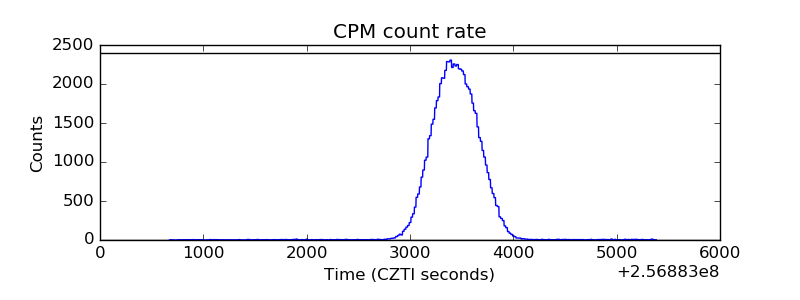 |
| CZT Counter | 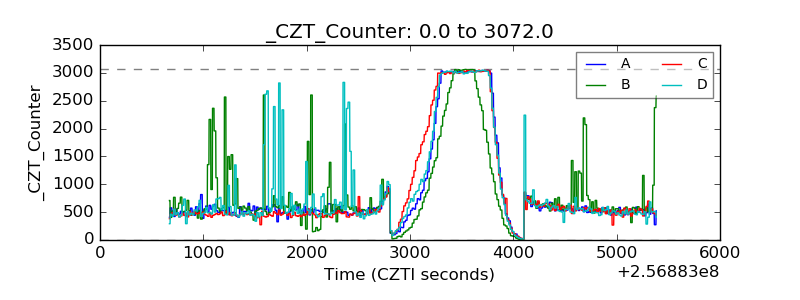 |
| +2.5 Volts monitor |  |
| +5 Volts monitor |  |
| _ROLL_ROT | 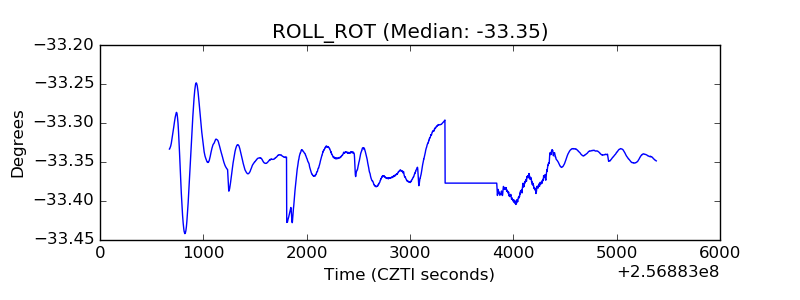 |
| _Roll_DEC | 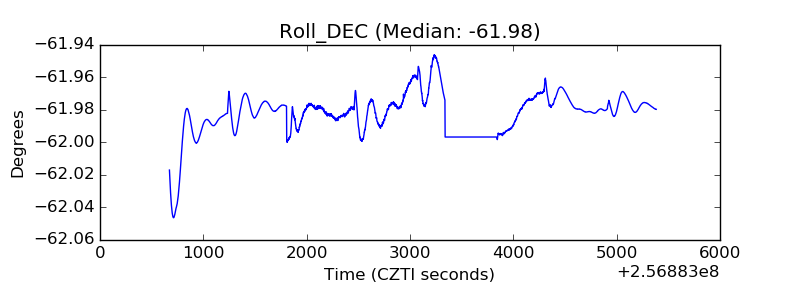 |
| _Roll_RA | 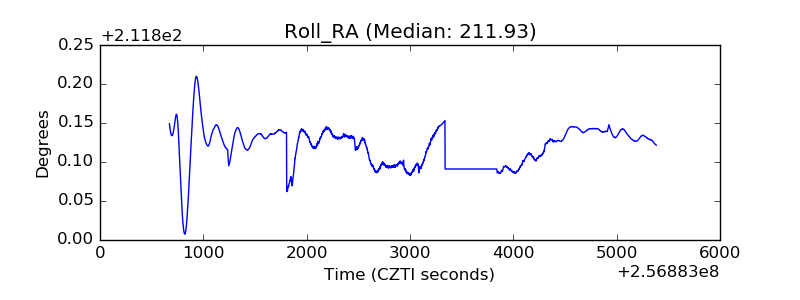 |
| Veto Counter | 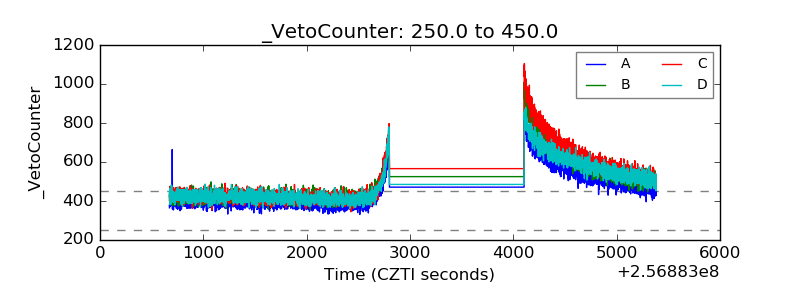 |