| Param | Original file | Final file |
|---|---|---|
| Filename | modeM0/AS1G08_055T01_9000001912_12983cztM0_level2.evt | modeM0/AS1G08_055T01_9000001912_12983cztM0_level2_quad_clean.evt |
| Size (bytes) | 512,242,560 | 102,758,400 |
| Size | 488.5 MB | 98.0 MB |
| Events in quadrant A | 3,279,857 | 687,008 |
| Events in quadrant B | 5,078,218 | 645,499 |
| Events in quadrant C | 3,125,159 | 695,970 |
| Events in quadrant D | 3,612,653 | 653,998 |
| Mode M9 | |||
|---|---|---|---|
| Quadrant | BADHDUFLAG | Total packets | Discarded packets |
| A | 0 | 16 | 0 |
| B | 0 | 16 | 0 |
| C | 0 | 16 | 0 |
| D | 0 | 17 | 0 |
| Mode SS | |||
|---|---|---|---|
| Quadrant | BADHDUFLAG | Total packets | Discarded packets |
| A | 0 | 124 | 0 |
| B | 0 | 124 | 0 |
| C | 0 | 124 | 0 |
| D | 0 | 124 | 0 |
| Mode M0 | |||
|---|---|---|---|
| Quadrant | BADHDUFLAG | Total packets | Discarded packets |
| A | 0 | 13417 | 3 |
| B | 0 | 19142 | 2 |
| C | 0 | 12984 | 2 |
| D | 0 | 14512 | 2 |
| Quadrant | Total seconds | Saturated seconds | Saturation percentage |
|---|---|---|---|
| A | 6155 | 22 | 0.357433% |
| B | 6155 | 917 | 14.898457% |
| C | 6155 | 16 | 0.259951% |
| D | 6155 | 70 | 1.137287% |
Noise dominated data is calculated using 1-second bins in cleaned event files. If a bin has >2000 counts, and if more than 50% of those come from <1% of pixels, then it is considered to be noise-dominated and hence unusable.
| Quadrant | # 1 sec bins | Bins with >0 counts | Bins with >2000 counts | High rate bins dominated by noise | Noise dominated (total time) | Noise dominated (detector-on time) | Marked lightcurve |
|---|---|---|---|---|---|---|---|
| A | 7521 | 6157 | 0 | 0 | 0.00% | 0.00% | 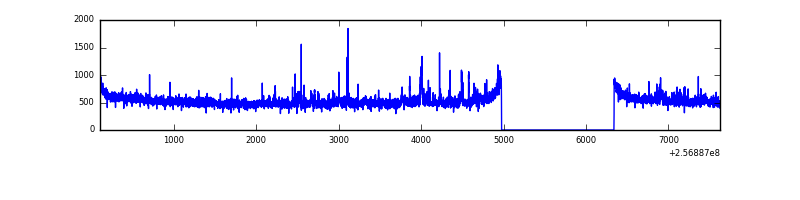 |
| B | 7521 | 6157 | 345 | 345 | 4.59% | 5.60% | 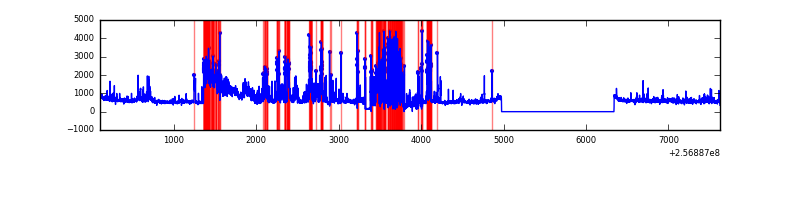 |
| C | 7521 | 6157 | 0 | 0 | 0.00% | 0.00% | 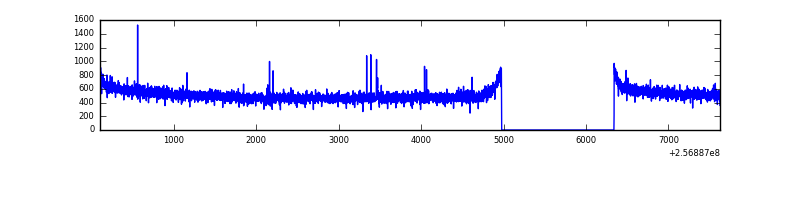 |
| D | 7521 | 6157 | 66 | 66 | 0.88% | 1.07% | 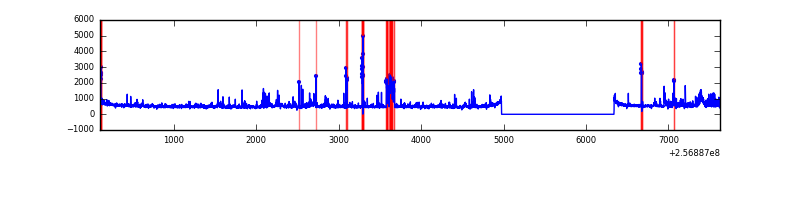 |
Top three noisy pixels from each quadrant. If the there are fewer than three noisy pixels in the level2.evt file, extra rows are filled as -1
| Pixel properties | Quadrant properties | ||||||
|---|---|---|---|---|---|---|---|
| Quadrant | DetID | PixID | Counts | Sigma | Mean | Median | Sigma |
| A | 12 | 189 | 118727 | 740.4 | 800 | 785 | 159.3 |
| A | 1 | 162 | 23086 | 140.0 | 800 | 785 | 159.3 |
| A | 8 | 15 | 19154 | 115.32 | 800 | 785 | 159.3 |
| B | 0 | 85 | 1078178 | 8173.7 | 722 | 706 | 131.8 |
| B | 4 | 239 | 995036 | 7542.98 | 722 | 706 | 131.8 |
| B | 3 | 64 | 52819 | 395.33 | 722 | 706 | 131.8 |
| C | 13 | 61 | 5804 | 27.36 | 799 | 805 | 182.7 |
| C | 0 | 207 | 4916 | 22.5 | 799 | 805 | 182.7 |
| C | 14 | 234 | 4679 | 21.2 | 799 | 805 | 182.7 |
| D | 1 | 52 | 386001 | 2097.68 | 784 | 766 | 183.6 |
| D | 13 | 104 | 159500 | 864.34 | 784 | 766 | 183.6 |
| D | 8 | 195 | 74973 | 404.07 | 784 | 766 | 183.6 |
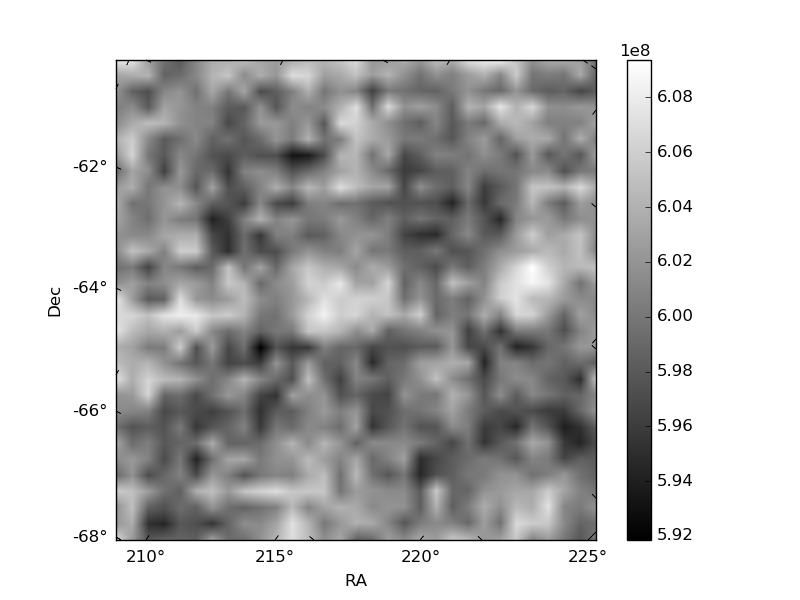
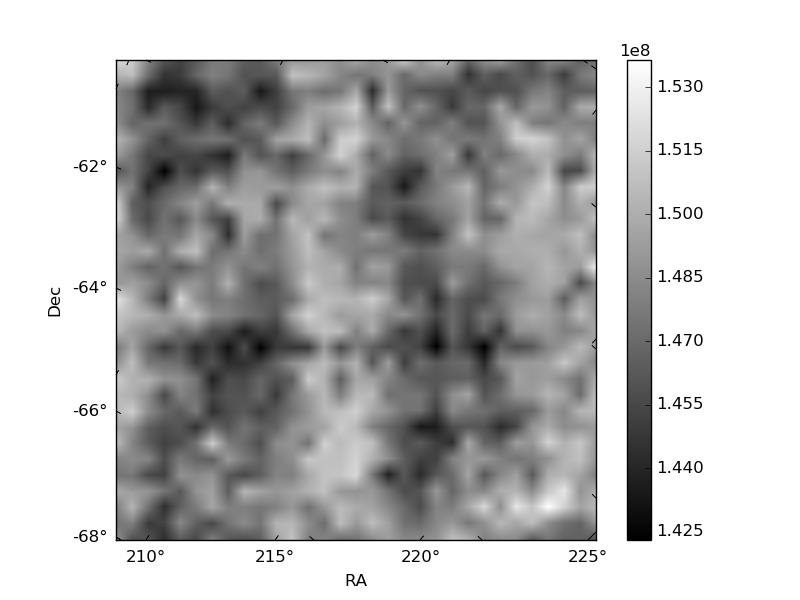
Histogram calculated using DETX and DETY for each event in the final _common_clean file
| Quadrant A | 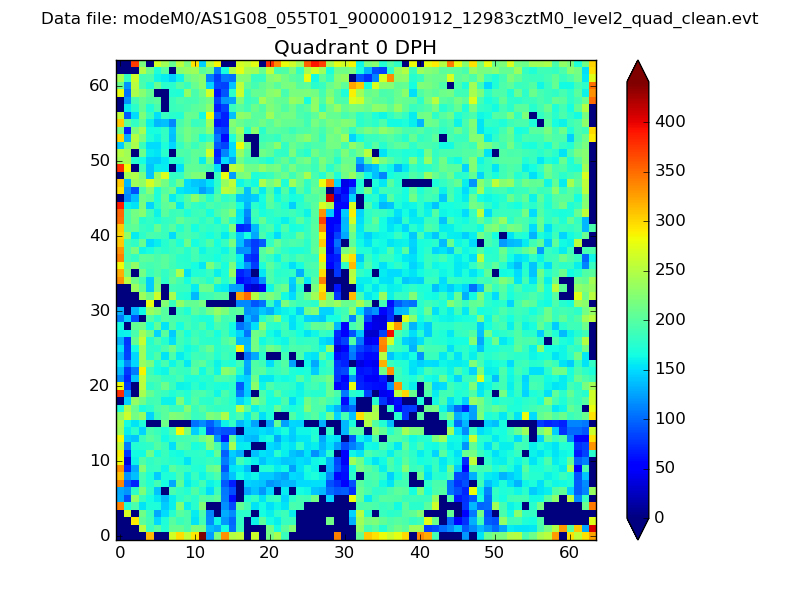 |
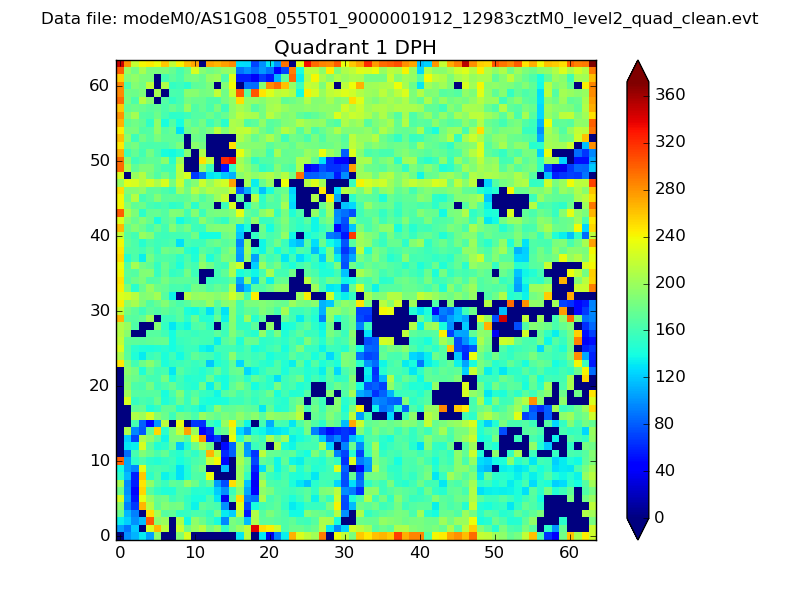 |
Quadrant B |
|---|---|---|---|
| Quadrant D | 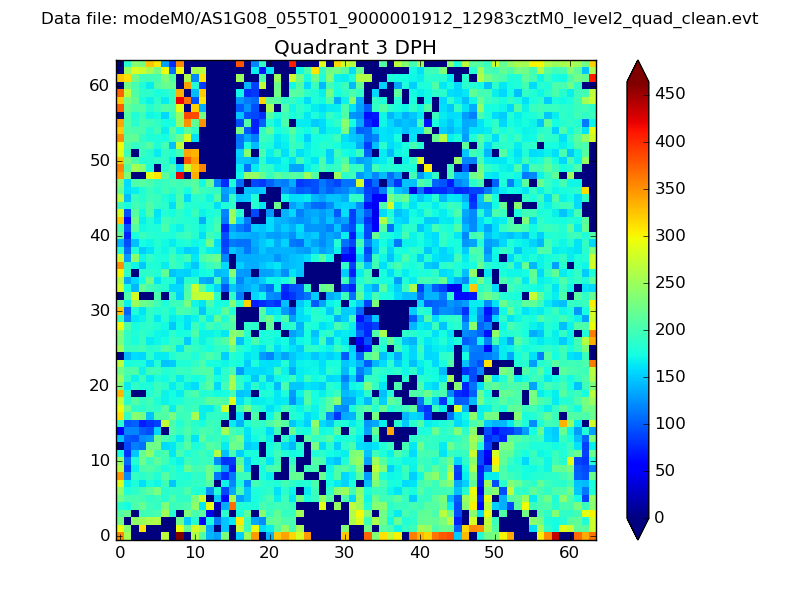 |
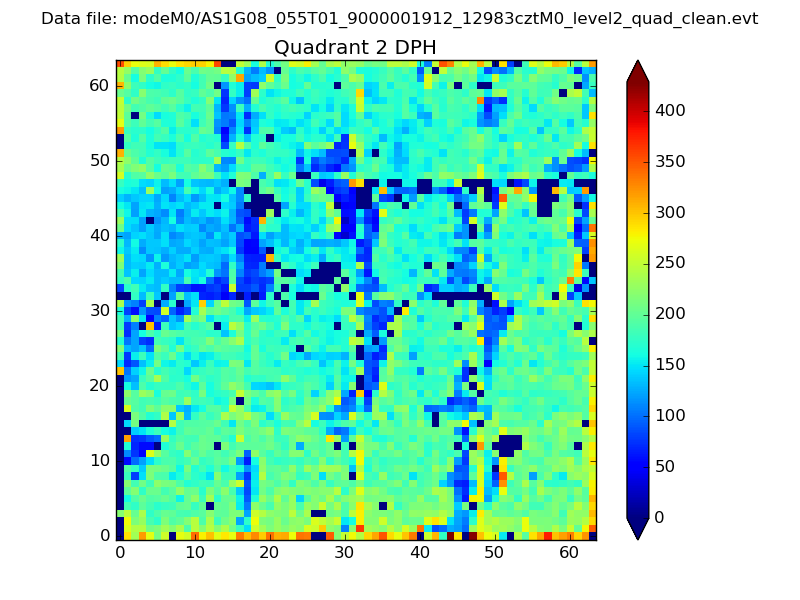 |
Quadrant C |
| Plot type | Count rate plots | Images |
|---|---|---|
| Comparison with Poisson distribution Blue bars denote a histogram of data divided into 1 sec bins. Red curve is a Poisson curve with rate = median count rate of data. |
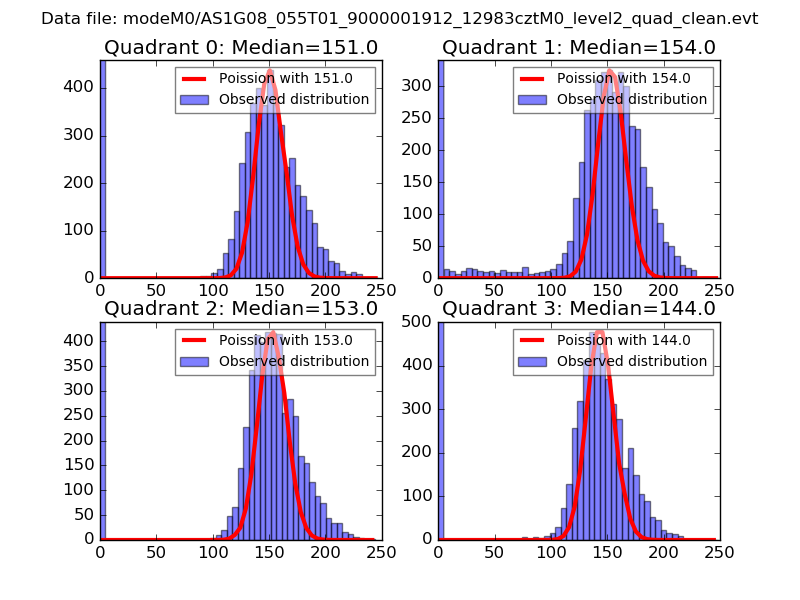 |
 |
| Quadrant-wise count rates Data is divided into 100 sec bins |
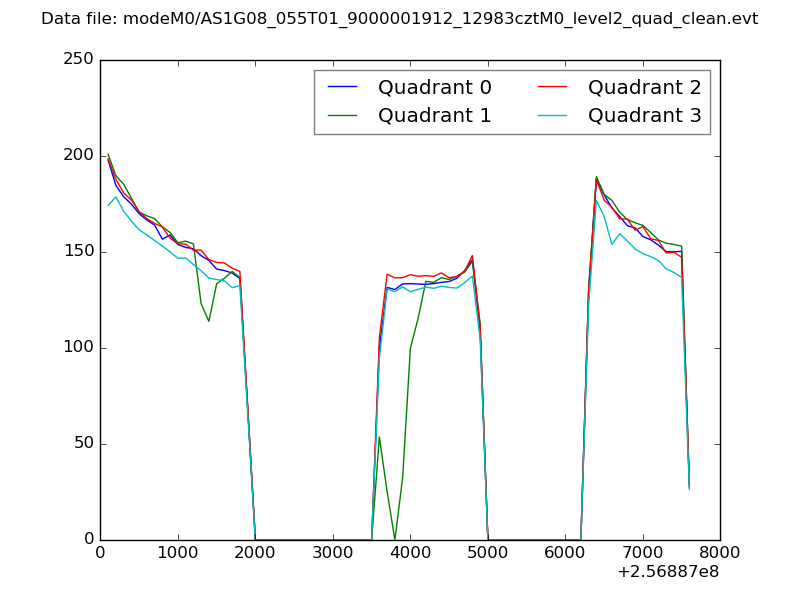 |
|
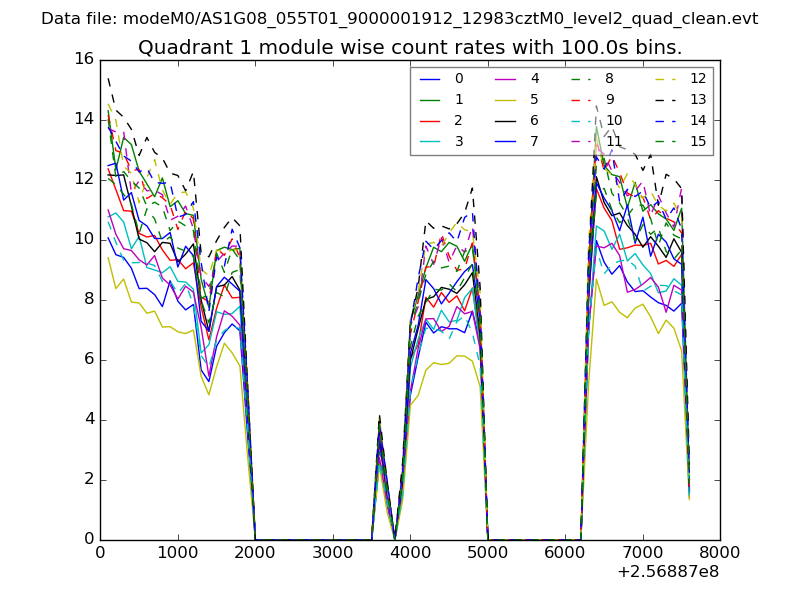
| Module-wise count rates for Quadrant A Data is divided into 100 sec bins |
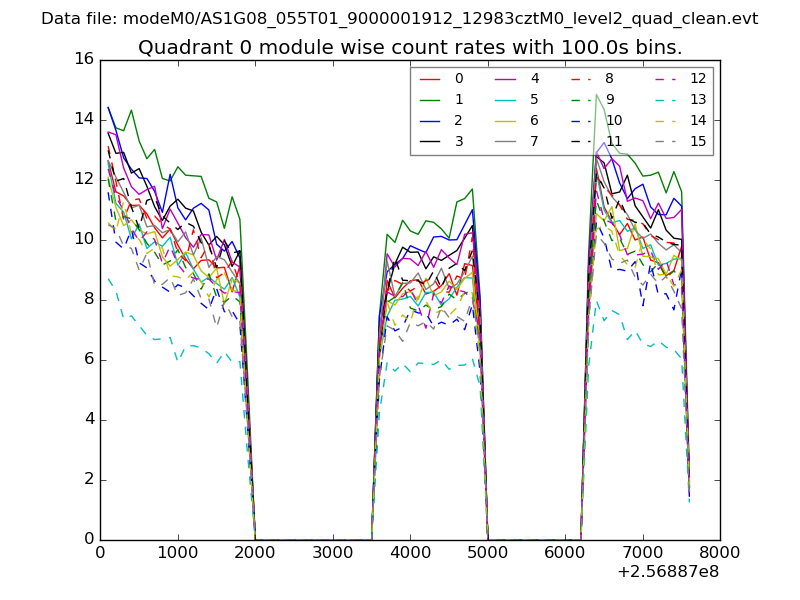 |
 |
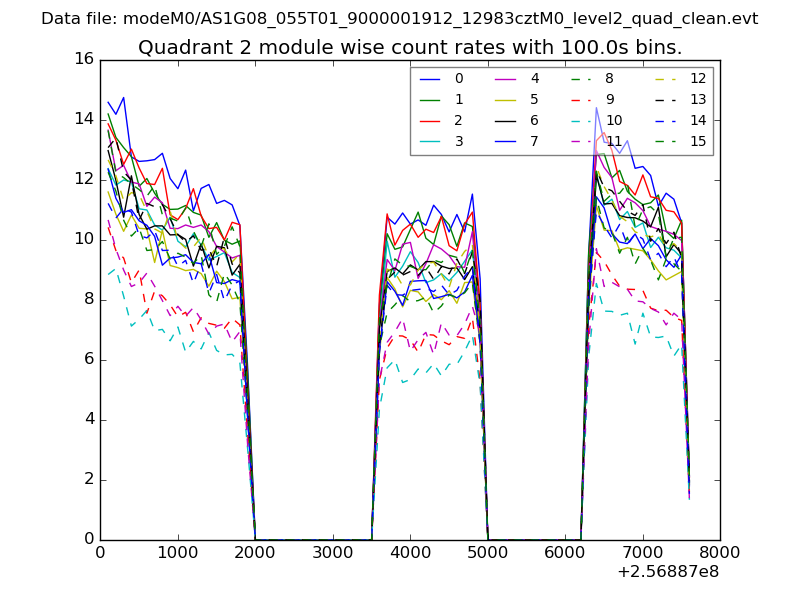
| Module-wise count rates for Quadrant B Data is divided into 100 sec bins |
 |
 |
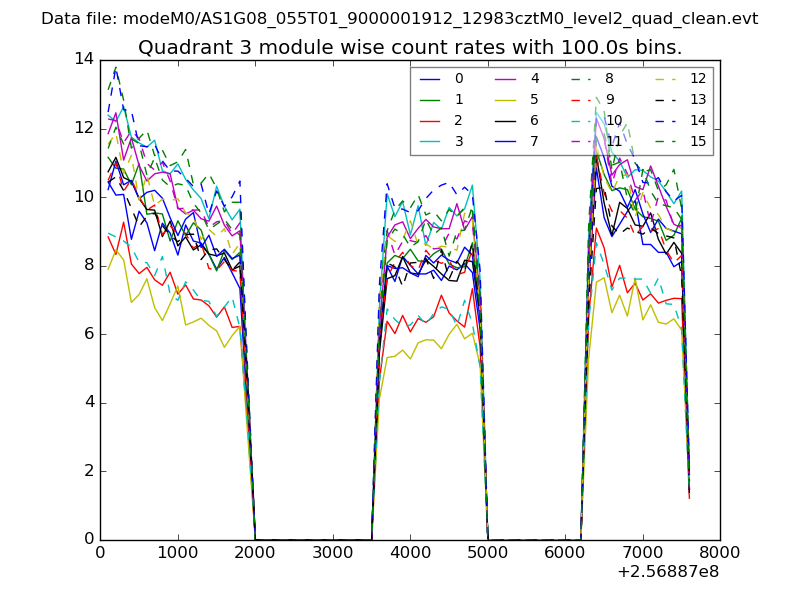
| Module-wise count rates for Quadrant C Data is divided into 100 sec bins |
 |
 |
| Module-wise count rates for Quadrant D Data is divided into 100 sec bins |
 |
 |
| Parameter | Plot |
|---|---|
| CZT HV Monitor | 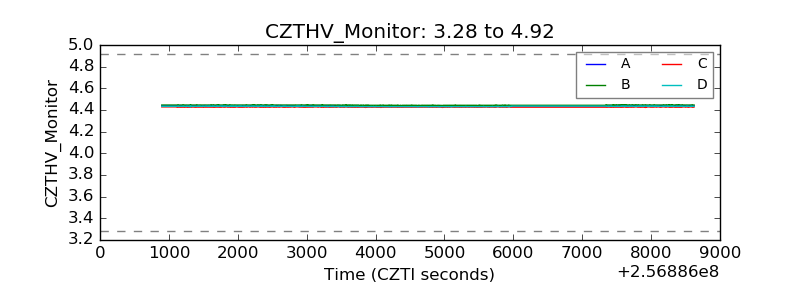 |
| D_VDD | 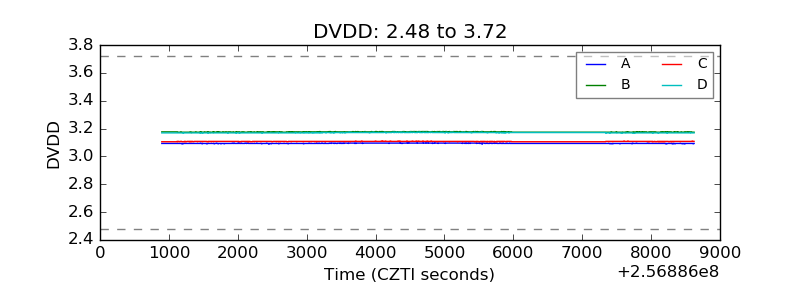 |
| Temperature 1 | 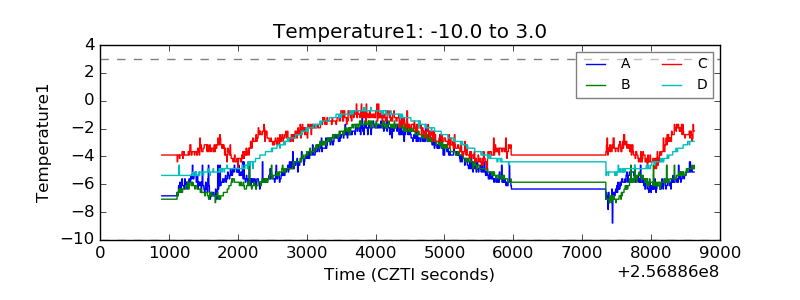 |
| Veto HV Monitor | 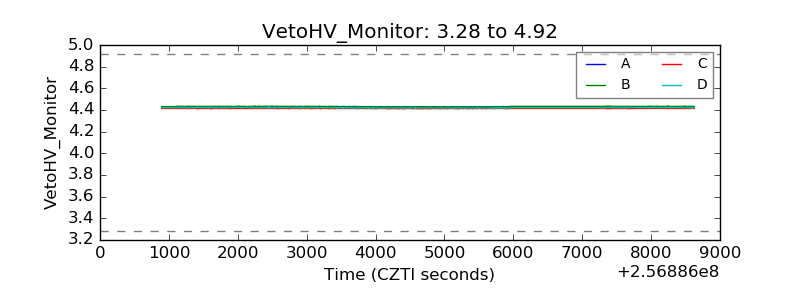 |
| Veto LLD | 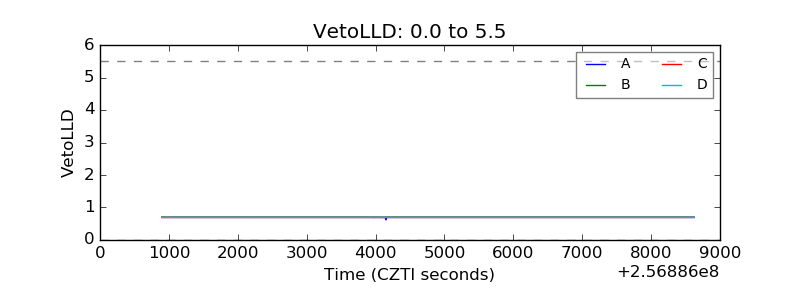 |
| Alpha Counter | 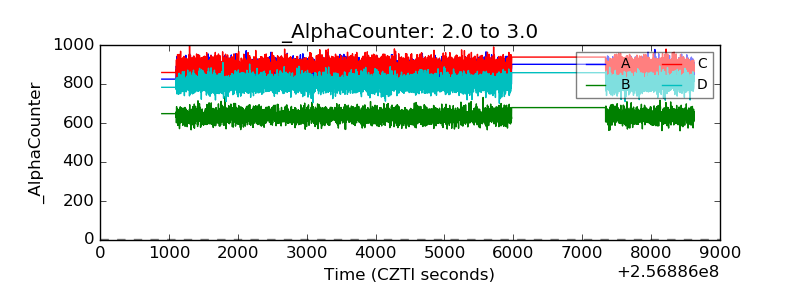 |
| _CPM_Rate | 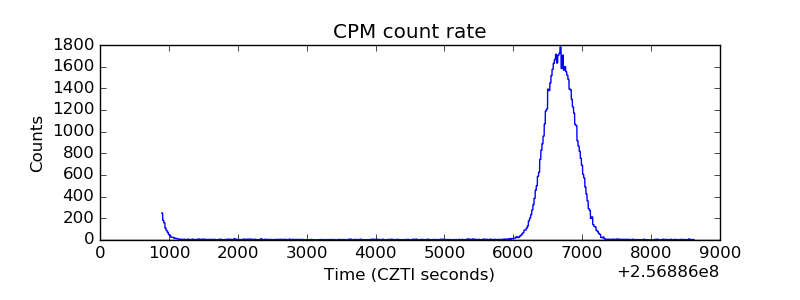 |
| CZT Counter | 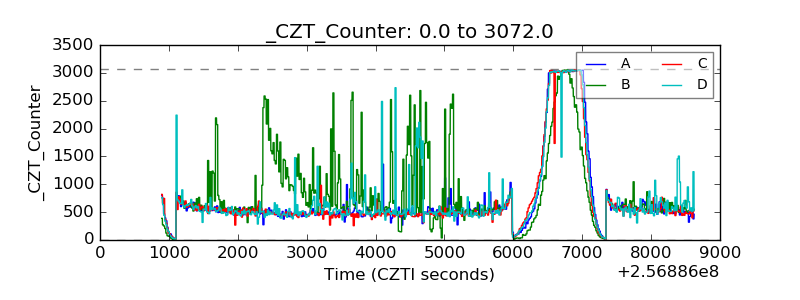 |
| +2.5 Volts monitor |  |
| +5 Volts monitor |  |
| _ROLL_ROT | 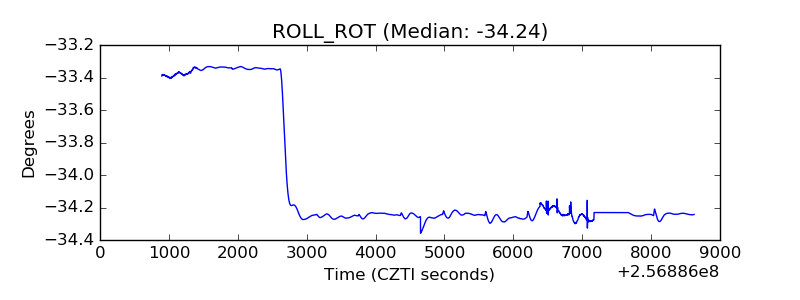 |
| _Roll_DEC |  |
| _Roll_RA | 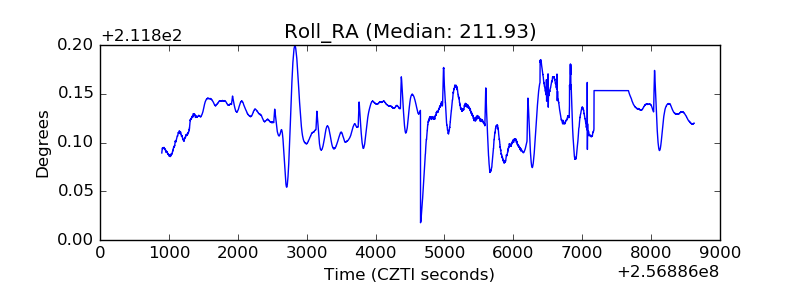 |
| Veto Counter | 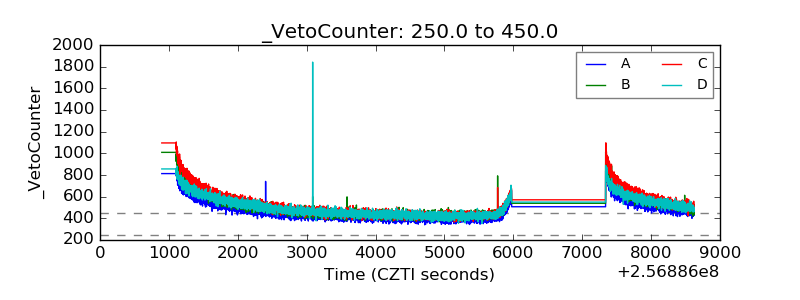 |