| Param | Original file | Final file |
|---|---|---|
| Filename | modeM0/AS1G08_055T01_9000001912_12985cztM0_level2.evt | modeM0/AS1G08_055T01_9000001912_12985cztM0_level2_quad_clean.evt |
| Size (bytes) | 666,210,240 | 88,971,840 |
| Size | 635.3 MB | 84.9 MB |
| Events in quadrant A | 3,714,226 | 574,983 |
| Events in quadrant B | 6,842,190 | 552,593 |
| Events in quadrant C | 3,111,762 | 578,489 |
| Events in quadrant D | 6,069,731 | 535,827 |
| Mode M9 | |||
|---|---|---|---|
| Quadrant | BADHDUFLAG | Total packets | Discarded packets |
| A | 0 | 11 | 0 |
| B | 0 | 11 | 0 |
| C | 0 | 11 | 0 |
| D | 0 | 11 | 0 |
| Mode SS | |||
|---|---|---|---|
| Quadrant | BADHDUFLAG | Total packets | Discarded packets |
| A | 0 | 132 | 0 |
| B | 0 | 132 | 0 |
| C | 0 | 132 | 0 |
| D | 0 | 132 | 0 |
| Mode M0 | |||
|---|---|---|---|
| Quadrant | BADHDUFLAG | Total packets | Discarded packets |
| A | 0 | 15082 | 3 |
| B | 0 | 24643 | 2 |
| C | 0 | 13387 | 2 |
| D | 0 | 22410 | 2 |
| Quadrant | Total seconds | Saturated seconds | Saturation percentage |
|---|---|---|---|
| A | 6481 | 135 | 2.083012% |
| B | 6481 | 1471 | 22.697115% |
| C | 6481 | 91 | 1.404104% |
| D | 6481 | 380 | 5.863293% |
Noise dominated data is calculated using 1-second bins in cleaned event files. If a bin has >2000 counts, and if more than 50% of those come from <1% of pixels, then it is considered to be noise-dominated and hence unusable.
| Quadrant | # 1 sec bins | Bins with >0 counts | Bins with >2000 counts | High rate bins dominated by noise | Noise dominated (total time) | Noise dominated (detector-on time) | Marked lightcurve |
|---|---|---|---|---|---|---|---|
| A | 7552 | 6483 | 3 | 3 | 0.04% | 0.05% | 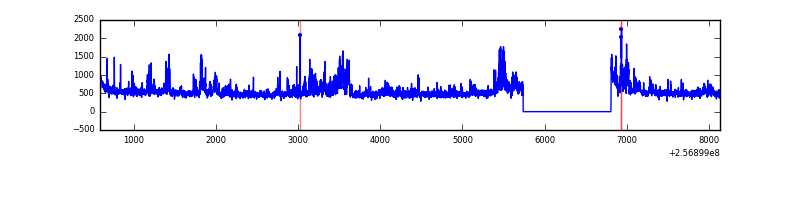 |
| B | 7552 | 6483 | 841 | 841 | 11.14% | 12.97% | 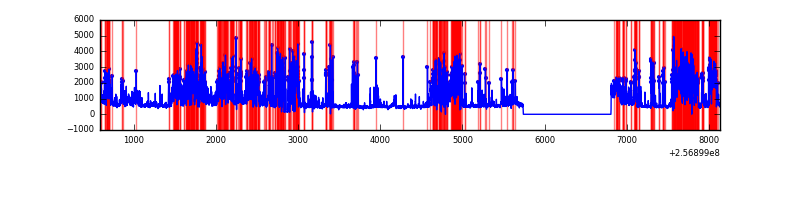 |
| C | 7552 | 6483 | 1 | 1 | 0.01% | 0.02% | 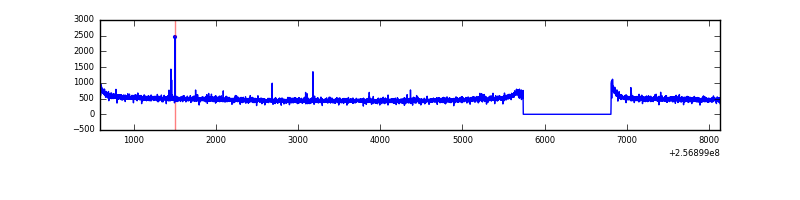 |
| D | 7552 | 6483 | 308 | 308 | 4.08% | 4.75% | 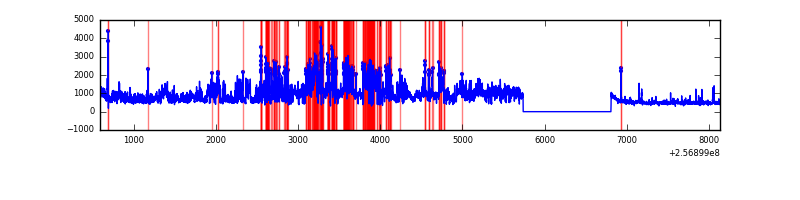 |
Top three noisy pixels from each quadrant. If the there are fewer than three noisy pixels in the level2.evt file, extra rows are filled as -1
| Pixel properties | Quadrant properties | ||||||
|---|---|---|---|---|---|---|---|
| Quadrant | DetID | PixID | Counts | Sigma | Mean | Median | Sigma |
| A | 8 | 15 | 439577 | 2708.66 | 809 | 794 | 162.0 |
| A | 12 | 189 | 120090 | 736.43 | 809 | 794 | 162.0 |
| A | 15 | 174 | 17842 | 105.24 | 809 | 794 | 162.0 |
| B | 0 | 85 | 2736305 | 20221.06 | 733 | 715 | 135.3 |
| B | 3 | 64 | 611025 | 4511.32 | 733 | 715 | 135.3 |
| B | 4 | 239 | 456475 | 3368.91 | 733 | 715 | 135.3 |
| C | 14 | 234 | 8899 | 44.49 | 794 | 799 | 182.1 |
| C | 13 | 61 | 5743 | 27.15 | 794 | 799 | 182.1 |
| C | 0 | 207 | 4794 | 21.94 | 794 | 799 | 182.1 |
| D | 1 | 52 | 3046509 | 16379.59 | 779 | 759 | 185.9 |
| D | 8 | 195 | 48233 | 255.31 | 779 | 759 | 185.9 |
| D | 2 | 234 | 31110 | 163.22 | 779 | 759 | 185.9 |
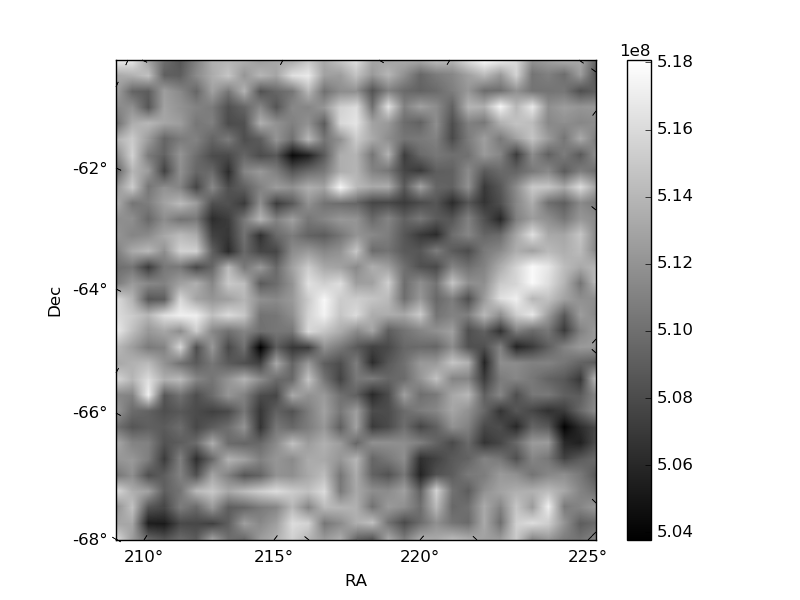
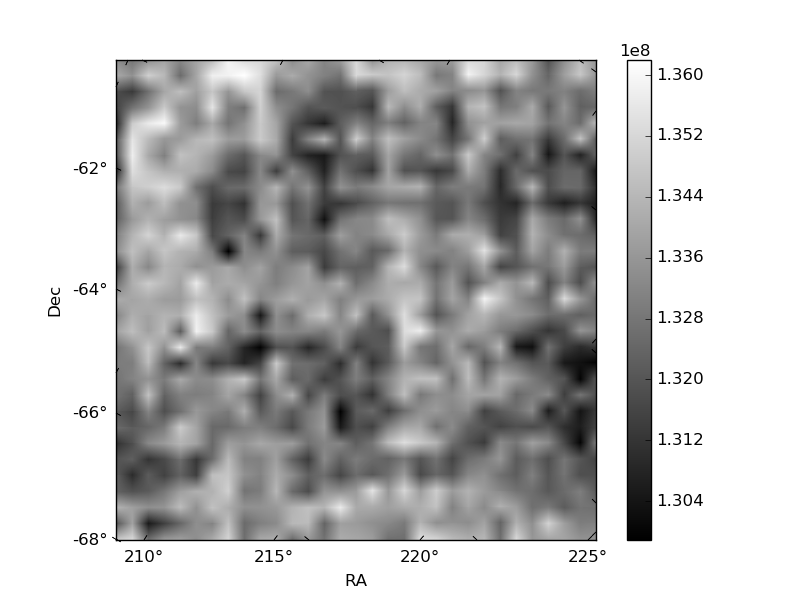
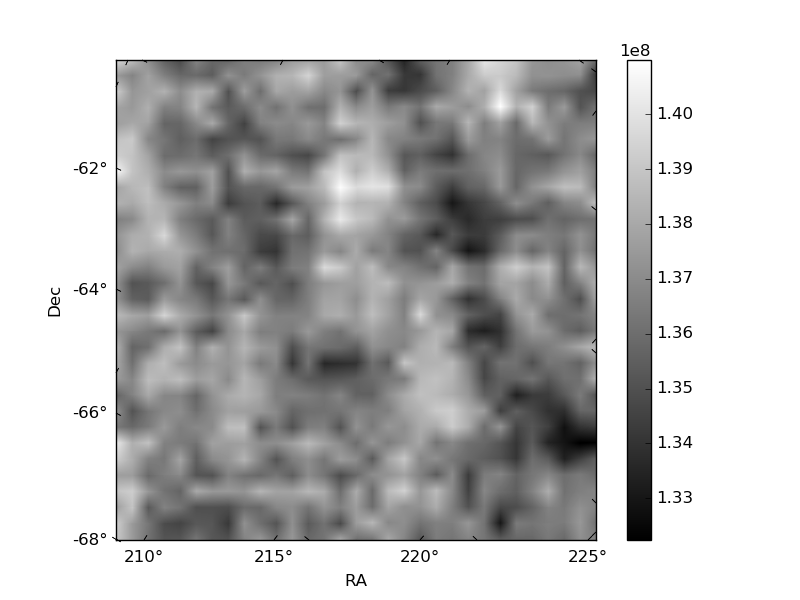
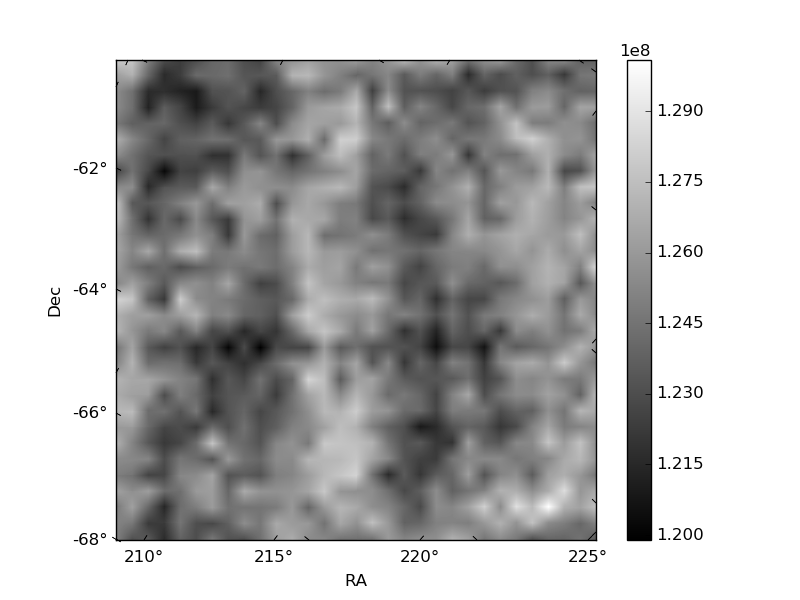
Histogram calculated using DETX and DETY for each event in the final _common_clean file
| Quadrant A | 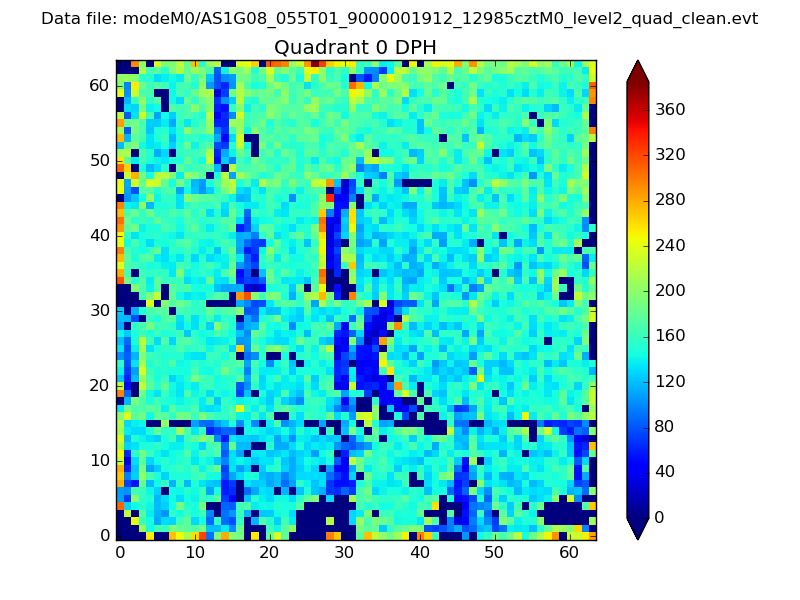 |
 |
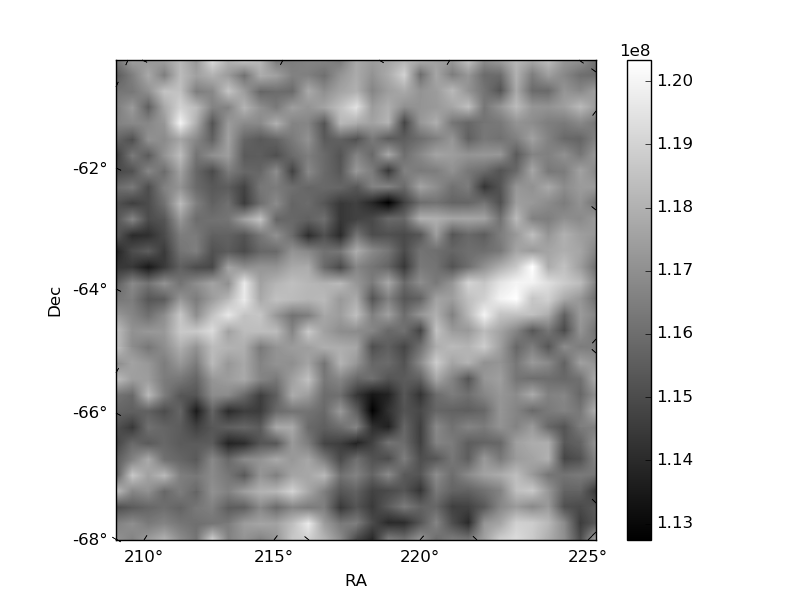
Quadrant B |
|---|---|---|---|
| Quadrant D | 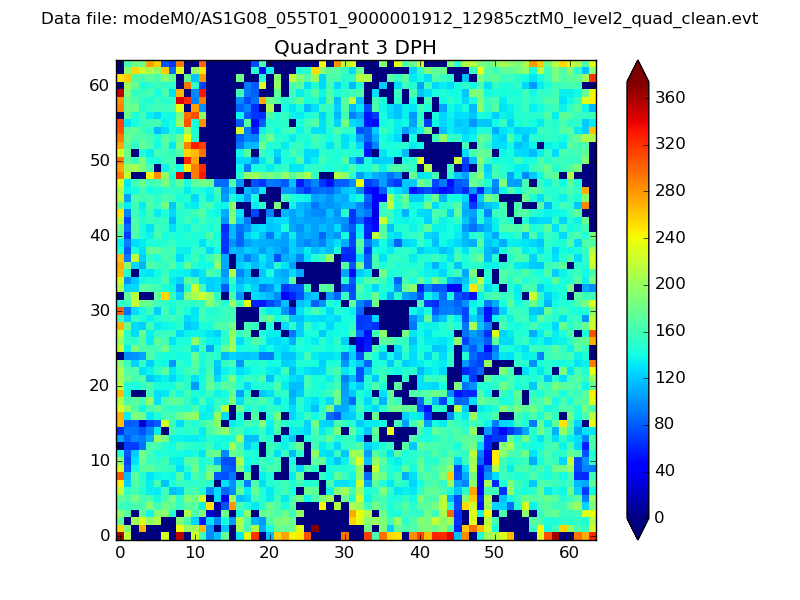 |
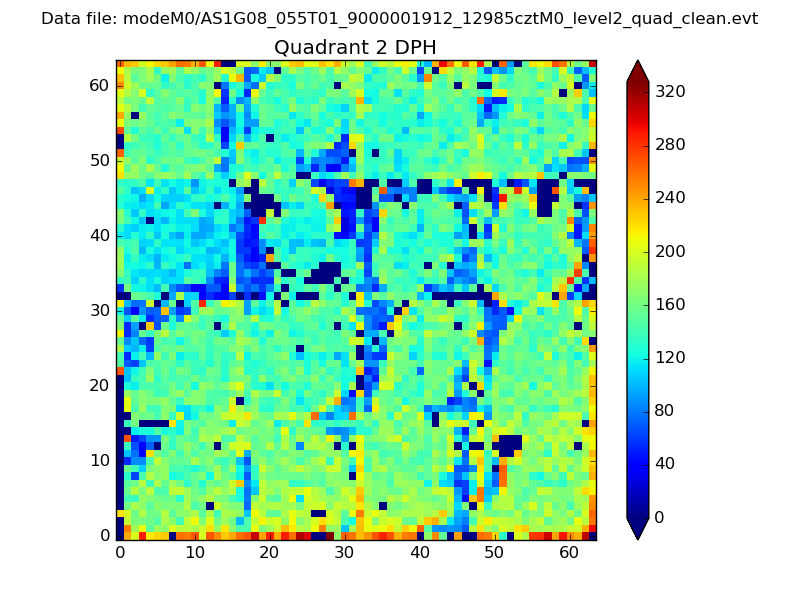 |
Quadrant C |
| Plot type | Count rate plots | Images |
|---|---|---|
| Comparison with Poisson distribution Blue bars denote a histogram of data divided into 1 sec bins. Red curve is a Poisson curve with rate = median count rate of data. |
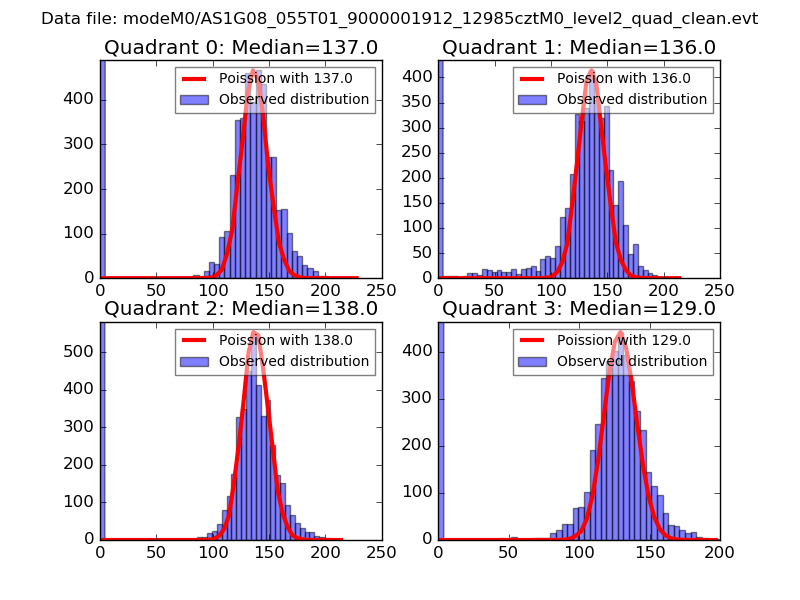 |
 |
| Quadrant-wise count rates Data is divided into 100 sec bins |
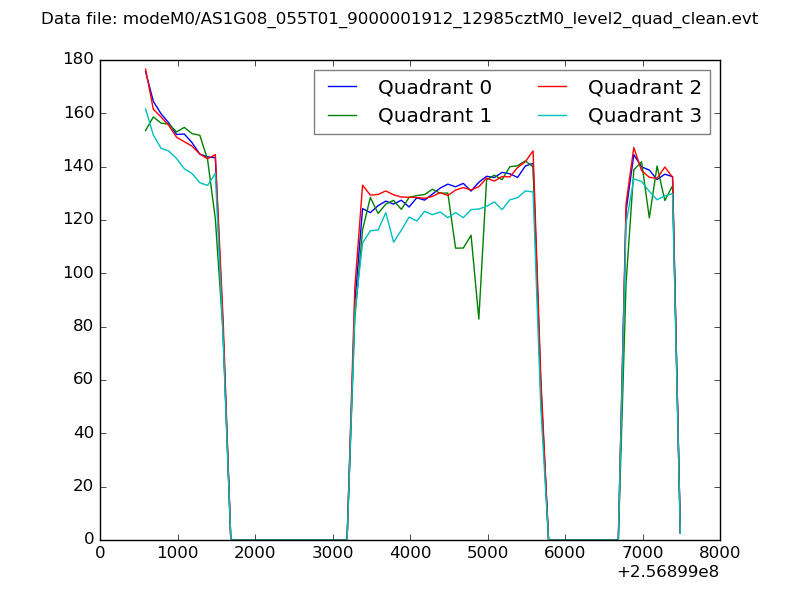 |
|
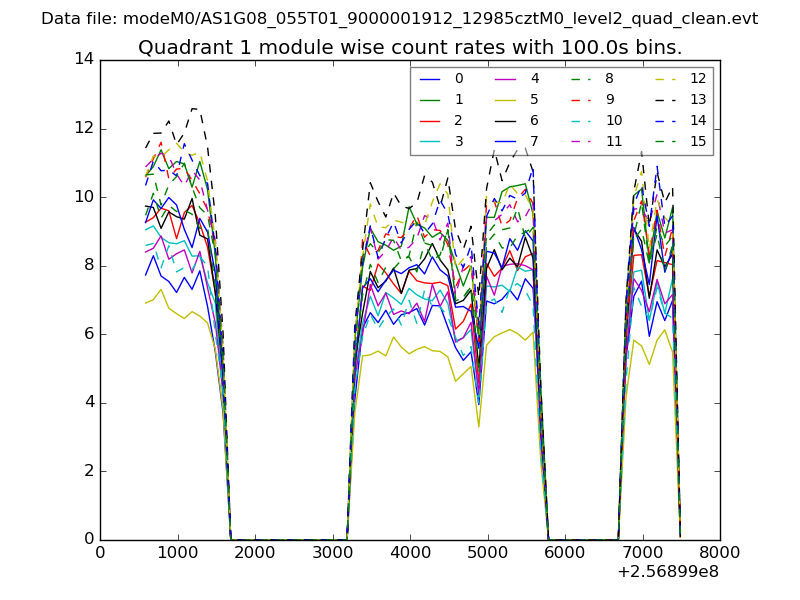
| Module-wise count rates for Quadrant A Data is divided into 100 sec bins |
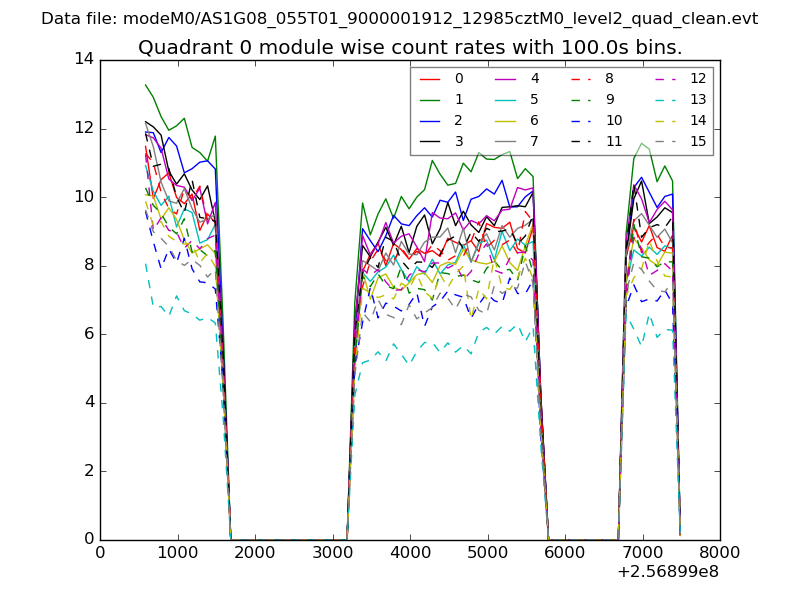 |
 |
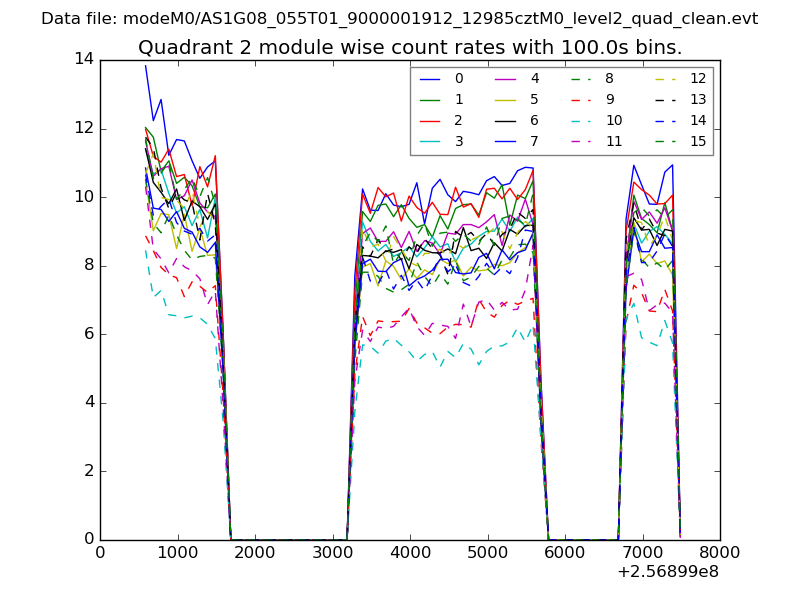
| Module-wise count rates for Quadrant B Data is divided into 100 sec bins |
 |
 |
| Module-wise count rates for Quadrant C Data is divided into 100 sec bins |
 |
 |
| Module-wise count rates for Quadrant D Data is divided into 100 sec bins |
 |
 |
| Parameter | Plot |
|---|---|
| CZT HV Monitor | 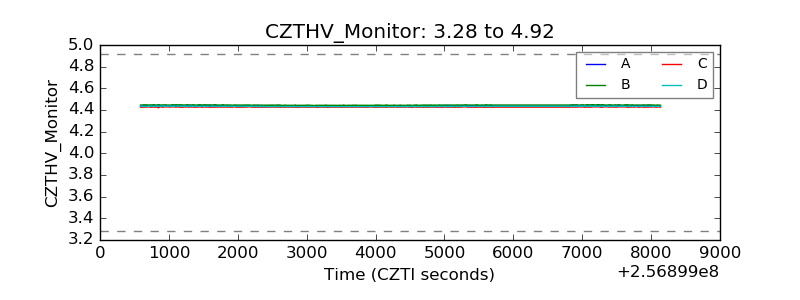 |
| D_VDD | 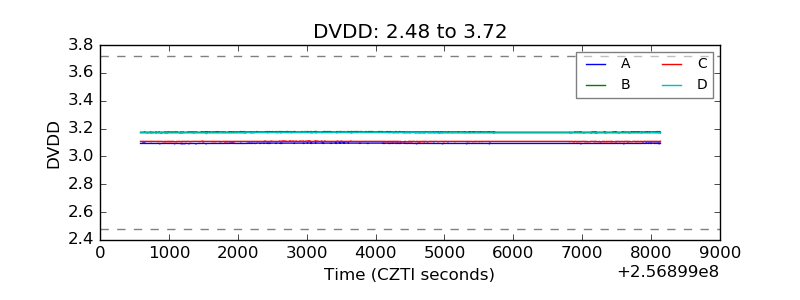 |
| Temperature 1 | 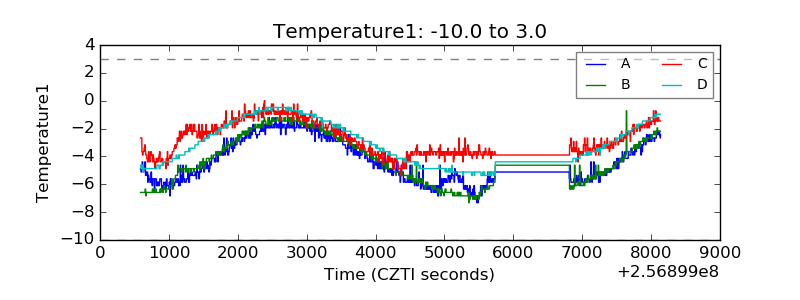 |
| Veto HV Monitor | 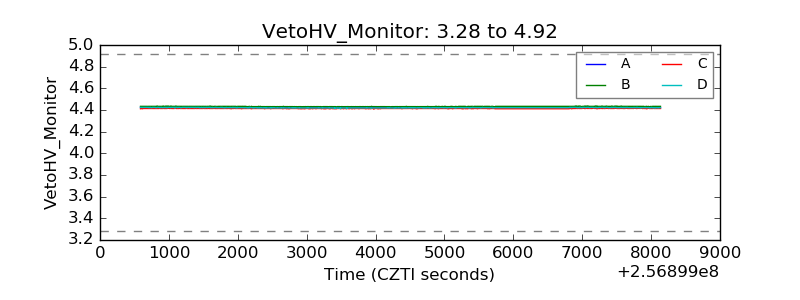 |
| Veto LLD |  |
| Alpha Counter | 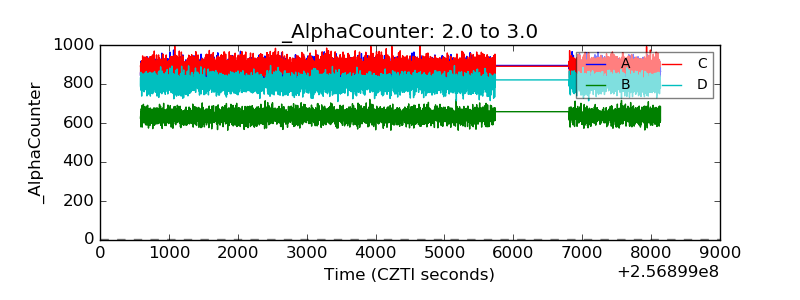 |
| _CPM_Rate | 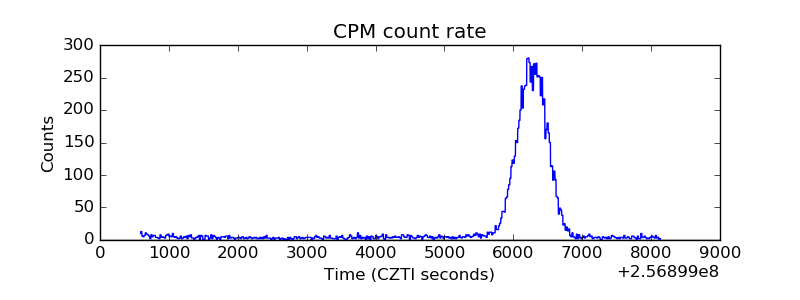 |
| CZT Counter | 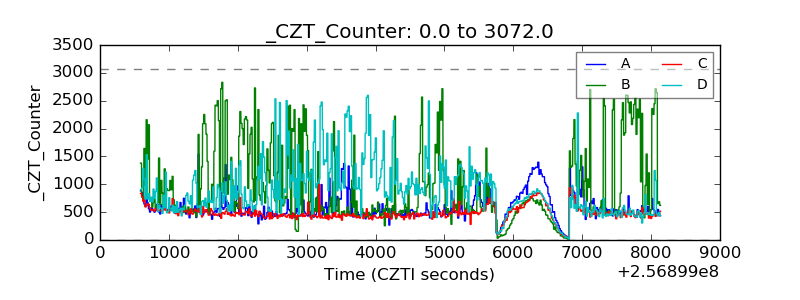 |
| +2.5 Volts monitor |  |
| +5 Volts monitor |  |
| _ROLL_ROT |  |
| _Roll_DEC | 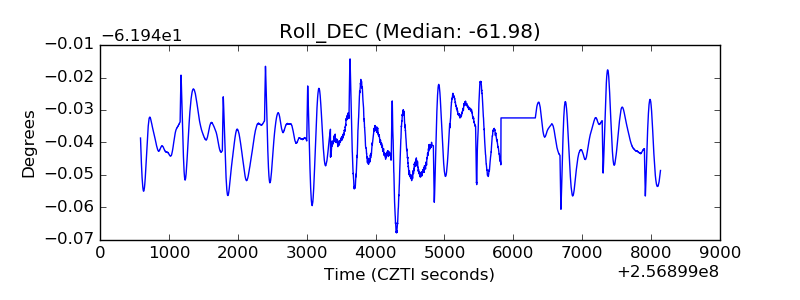 |
| _Roll_RA | 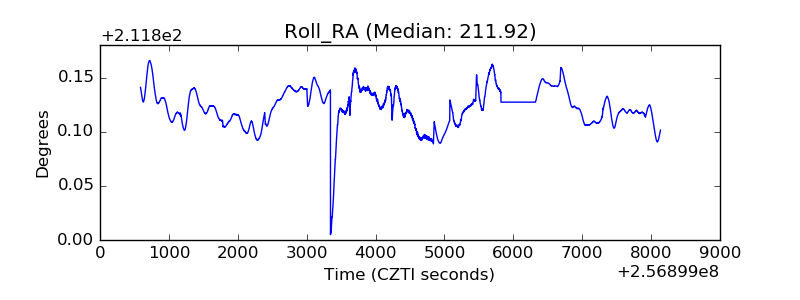 |
| Veto Counter |  |