| Param | Original file | Final file |
|---|---|---|
| Filename | modeM0/AS1G08_055T01_9000001912_12986cztM0_level2.evt | modeM0/AS1G08_055T01_9000001912_12986cztM0_level2_quad_clean.evt |
| Size (bytes) | 753,626,880 | 84,551,040 |
| Size | 718.7 MB | 80.6 MB |
| Events in quadrant A | 3,719,321 | 542,139 |
| Events in quadrant B | 9,537,963 | 460,383 |
| Events in quadrant C | 3,356,091 | 545,452 |
| Events in quadrant D | 5,723,519 | 510,597 |
| Mode M9 | |||
|---|---|---|---|
| Quadrant | BADHDUFLAG | Total packets | Discarded packets |
| A | 0 | 11 | 0 |
| B | 0 | 11 | 0 |
| C | 0 | 11 | 0 |
| D | 0 | 12 | 0 |
| Mode SS | |||
|---|---|---|---|
| Quadrant | BADHDUFLAG | Total packets | Discarded packets |
| A | 0 | 146 | 0 |
| B | 0 | 146 | 0 |
| C | 0 | 146 | 0 |
| D | 0 | 146 | 0 |
| Mode M0 | |||
|---|---|---|---|
| Quadrant | BADHDUFLAG | Total packets | Discarded packets |
| A | 0 | 15563 | 3 |
| B | 0 | 33234 | 2 |
| C | 0 | 14838 | 2 |
| D | 0 | 21871 | 2 |
| Quadrant | Total seconds | Saturated seconds | Saturation percentage |
|---|---|---|---|
| A | 7191 | 168 | 2.336254% |
| B | 7191 | 2486 | 34.570992% |
| C | 7191 | 110 | 1.529690% |
| D | 7191 | 564 | 7.843137% |
Noise dominated data is calculated using 1-second bins in cleaned event files. If a bin has >2000 counts, and if more than 50% of those come from <1% of pixels, then it is considered to be noise-dominated and hence unusable.
| Quadrant | # 1 sec bins | Bins with >0 counts | Bins with >2000 counts | High rate bins dominated by noise | Noise dominated (total time) | Noise dominated (detector-on time) | Marked lightcurve |
|---|---|---|---|---|---|---|---|
| A | 7897 | 7193 | 2 | 2 | 0.03% | 0.03% | 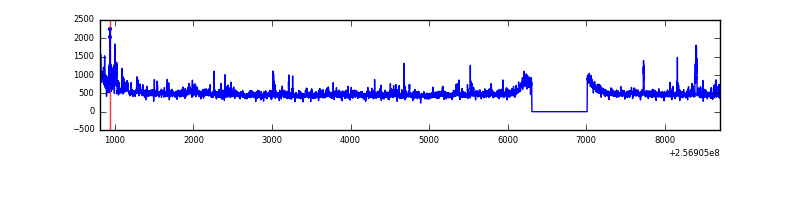 |
| B | 7897 | 7193 | 1678 | 1678 | 21.25% | 23.33% | 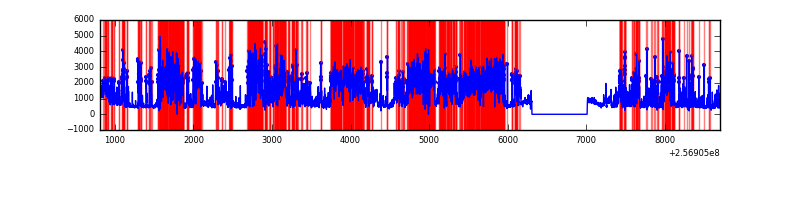 |
| C | 7897 | 7193 | 0 | 0 | 0.00% | 0.00% | 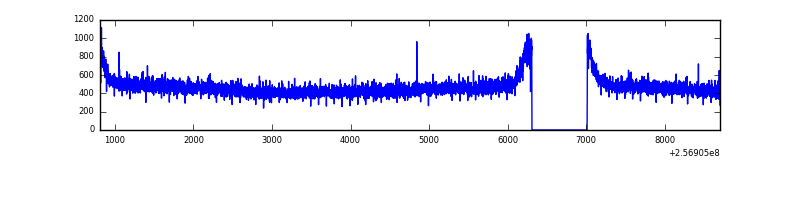 |
| D | 7897 | 7193 | 419 | 419 | 5.31% | 5.83% | 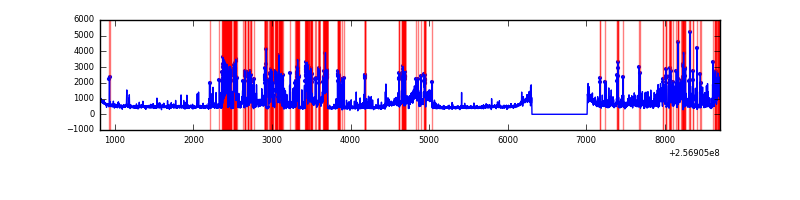 |
Top three noisy pixels from each quadrant. If the there are fewer than three noisy pixels in the level2.evt file, extra rows are filled as -1
| Pixel properties | Quadrant properties | ||||||
|---|---|---|---|---|---|---|---|
| Quadrant | DetID | PixID | Counts | Sigma | Mean | Median | Sigma |
| A | 12 | 189 | 159428 | 906.01 | 874 | 854 | 175.0 |
| A | 8 | 15 | 132405 | 751.61 | 874 | 854 | 175.0 |
| A | 1 | 162 | 35537 | 198.16 | 874 | 854 | 175.0 |
| B | 0 | 85 | 5596235 | 38758.27 | 765 | 744 | 144.4 |
| B | 3 | 64 | 525518 | 3634.95 | 765 | 744 | 144.4 |
| B | 4 | 239 | 283921 | 1961.48 | 765 | 744 | 144.4 |
| C | 13 | 61 | 6087 | 26.42 | 860 | 866 | 197.6 |
| C | 14 | 234 | 2995 | 10.77 | 860 | 866 | 197.6 |
| C | 12 | 4 | 2511 | 8.32 | 860 | 866 | 197.6 |
| D | 1 | 52 | 2519414 | 12644.68 | 838 | 815 | 199.2 |
| D | 2 | 234 | 30172 | 147.39 | 838 | 815 | 199.2 |
| D | 8 | 195 | 19669 | 94.66 | 838 | 815 | 199.2 |
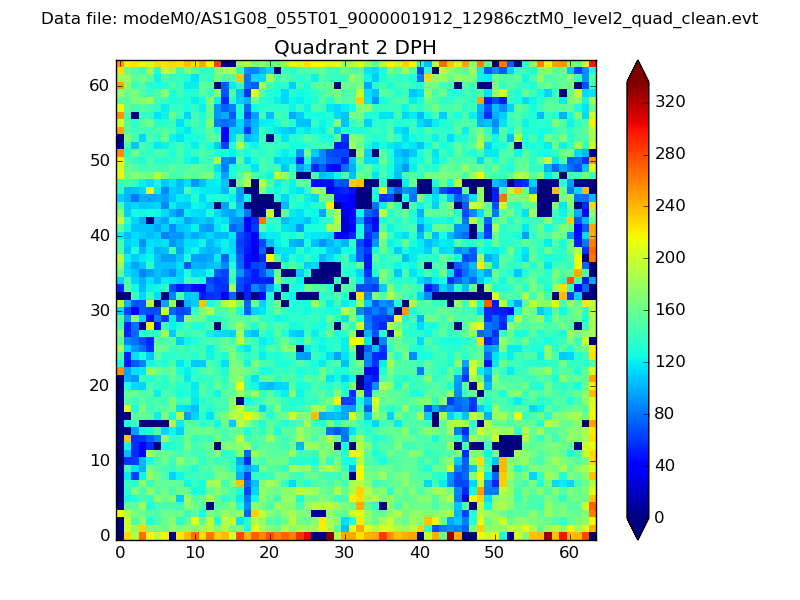
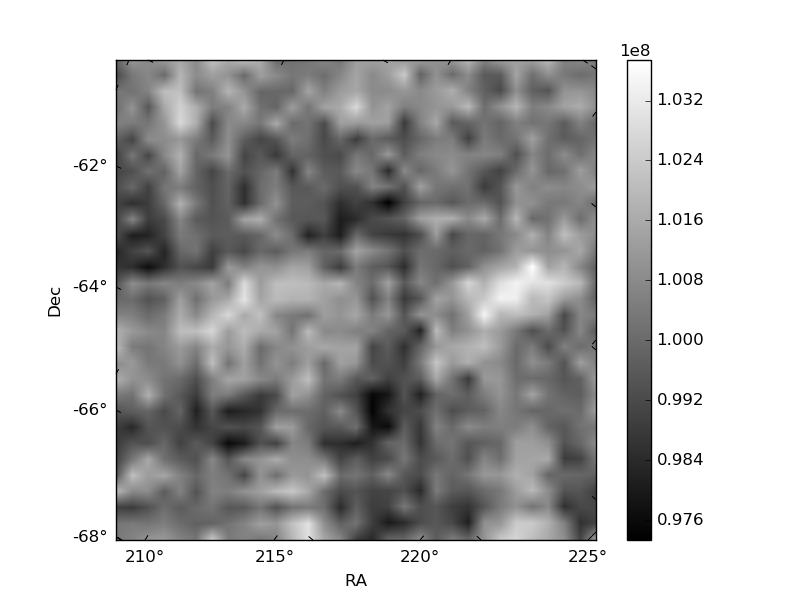
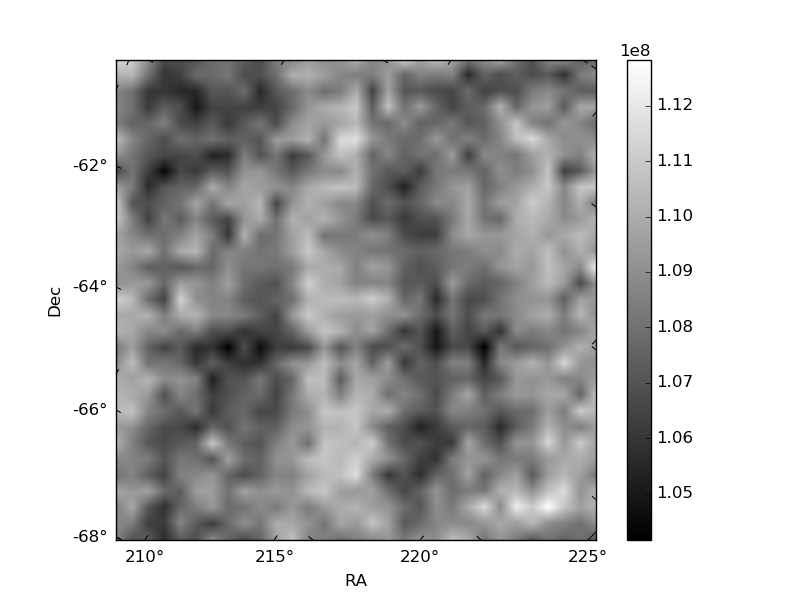
Histogram calculated using DETX and DETY for each event in the final _common_clean file
| Quadrant A |  |
 |
Quadrant B |
|---|---|---|---|
| Quadrant D | 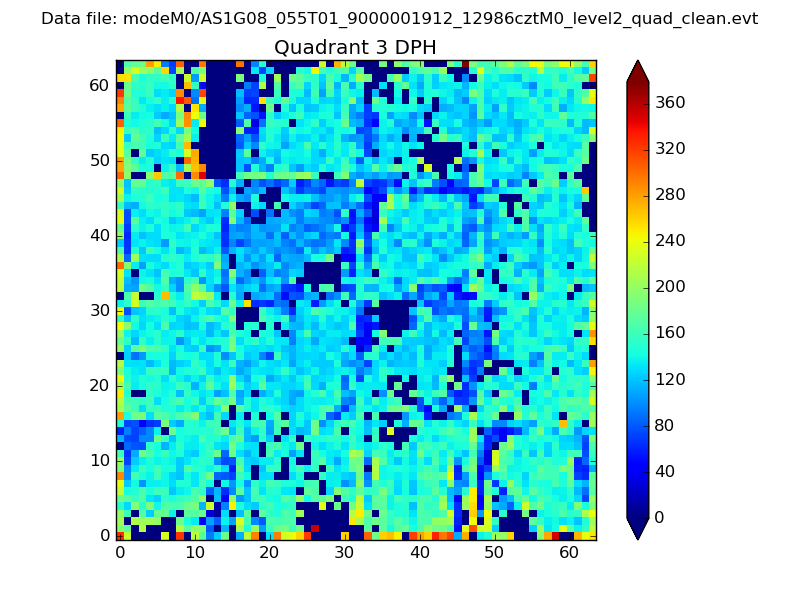 |
 |
Quadrant C |
| Plot type | Count rate plots | Images |
|---|---|---|
| Comparison with Poisson distribution Blue bars denote a histogram of data divided into 1 sec bins. Red curve is a Poisson curve with rate = median count rate of data. |
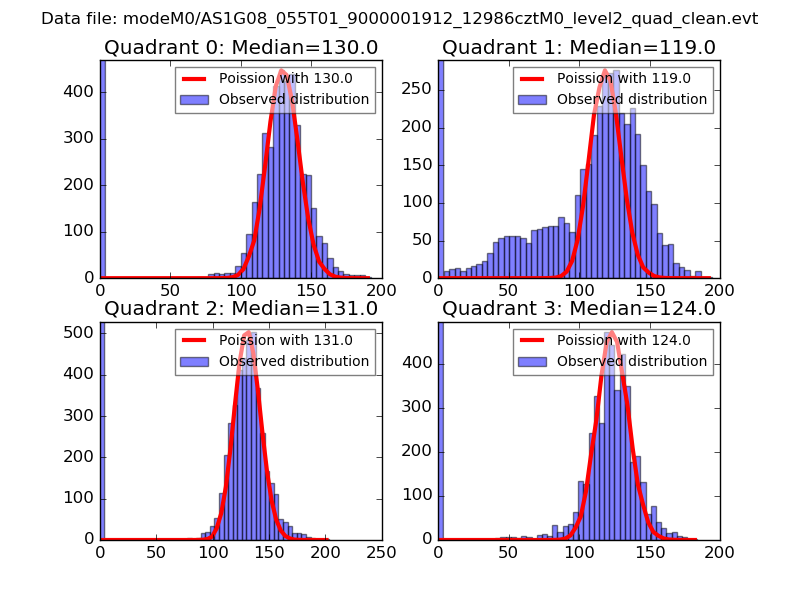 |
 |
| Quadrant-wise count rates Data is divided into 100 sec bins |
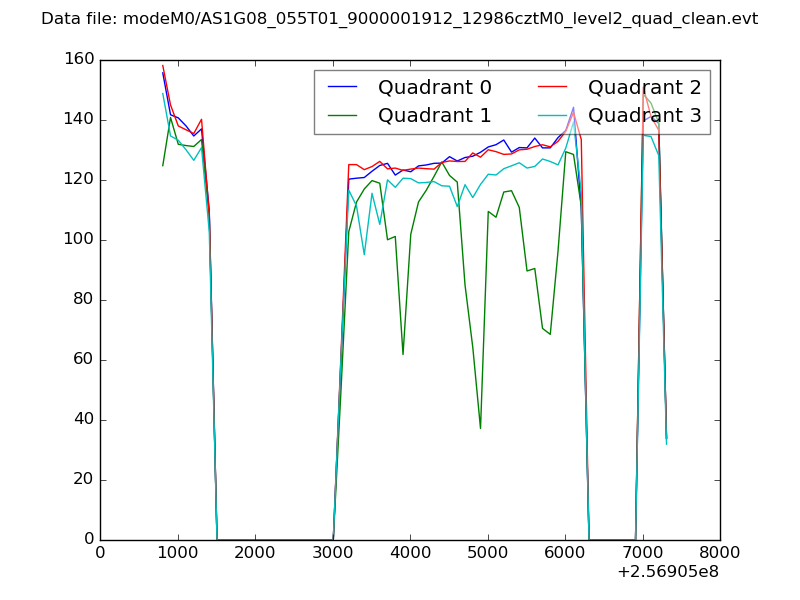 |
|
| Module-wise count rates for Quadrant A Data is divided into 100 sec bins |
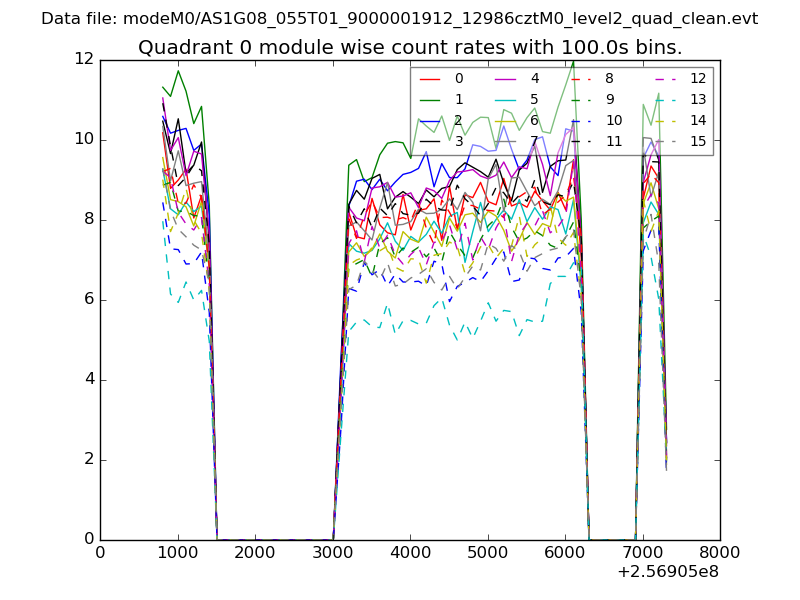 |
 |
| Module-wise count rates for Quadrant B Data is divided into 100 sec bins |
 |
 |
| Module-wise count rates for Quadrant C Data is divided into 100 sec bins |
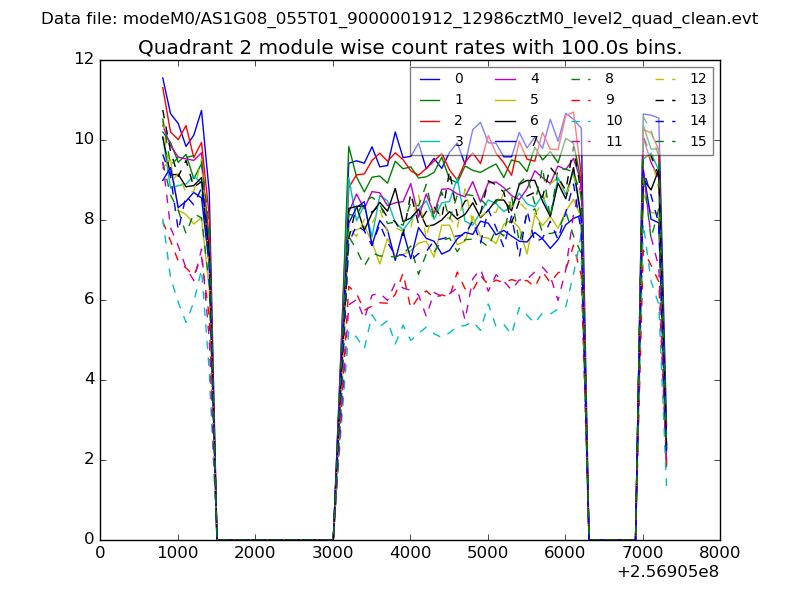 |
 |
| Module-wise count rates for Quadrant D Data is divided into 100 sec bins |
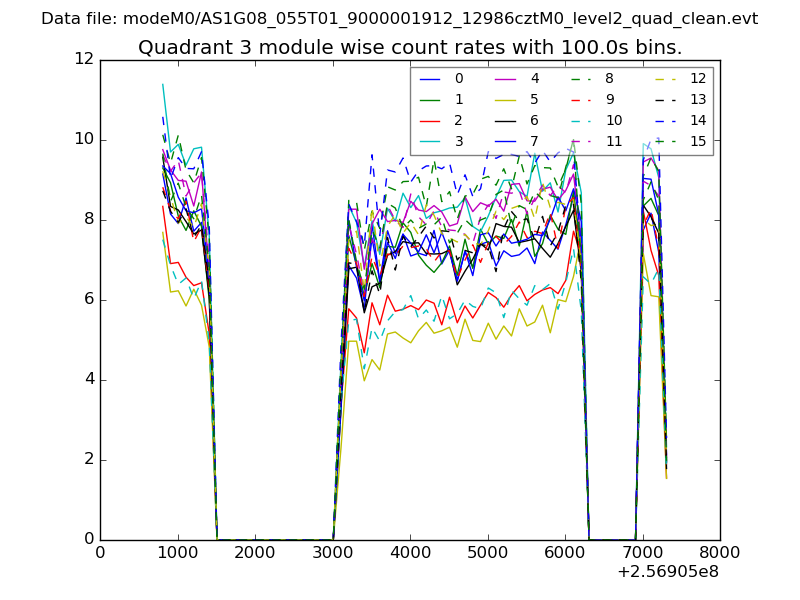 |
 |
| Parameter | Plot |
|---|---|
| CZT HV Monitor | 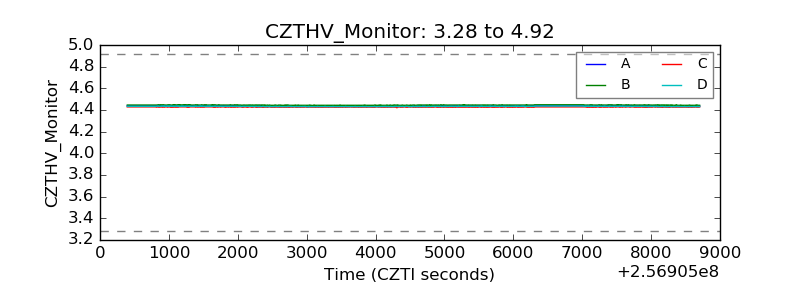 |
| D_VDD | 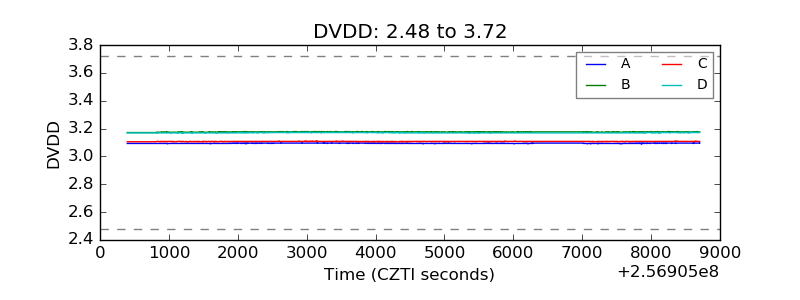 |
| Temperature 1 | 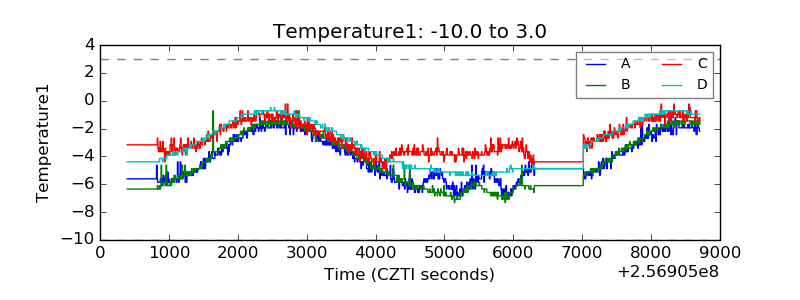 |
| Veto HV Monitor | 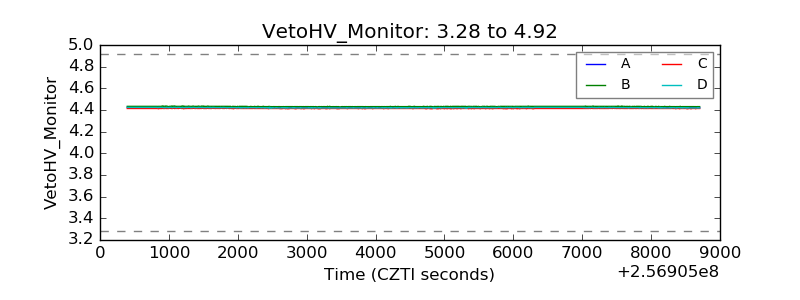 |
| Veto LLD | 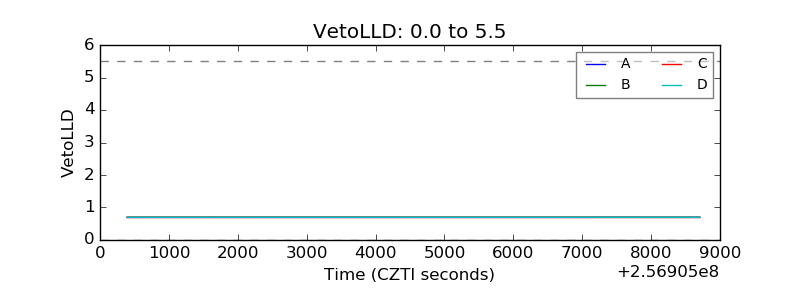 |
| Alpha Counter | 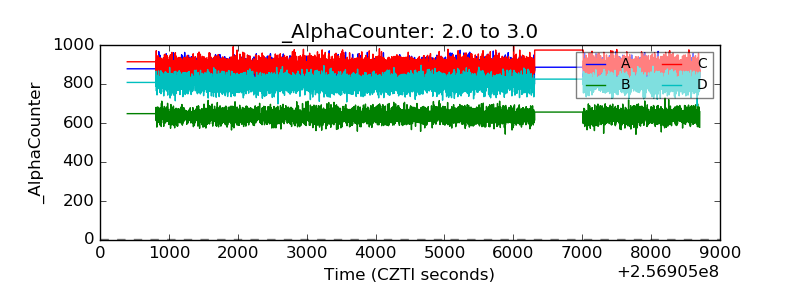 |
| _CPM_Rate | 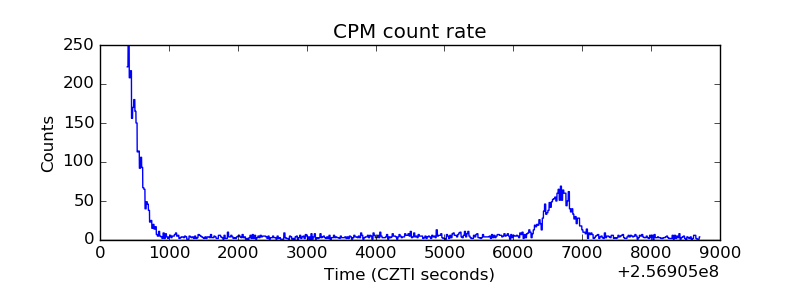 |
| CZT Counter | 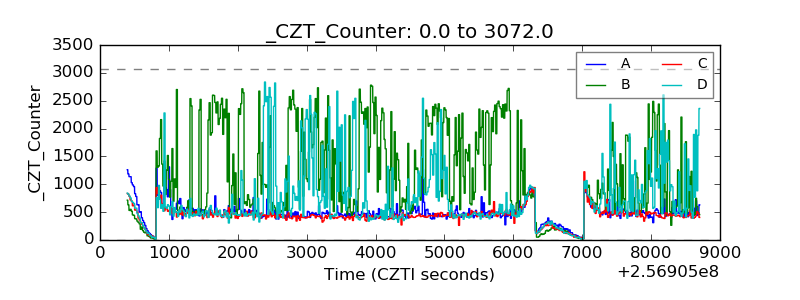 |
| +2.5 Volts monitor |  |
| +5 Volts monitor | 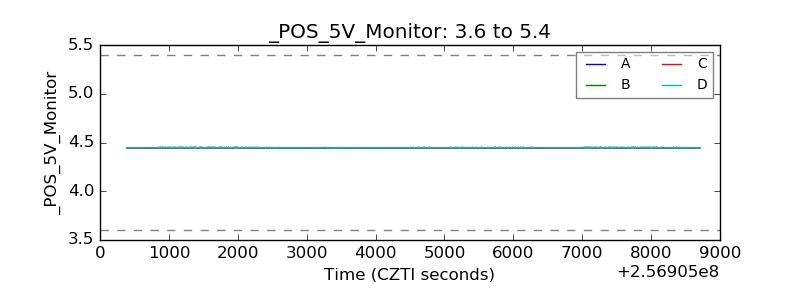 |
| _ROLL_ROT | 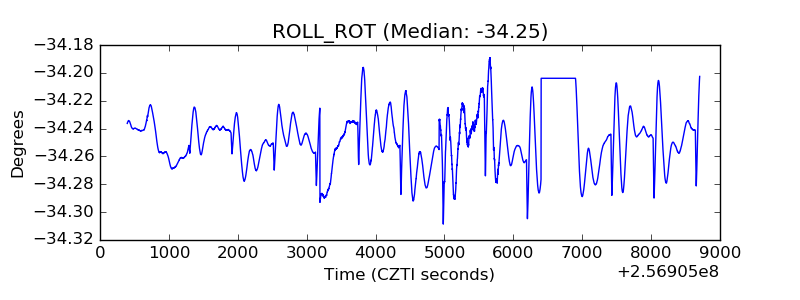 |
| _Roll_DEC | 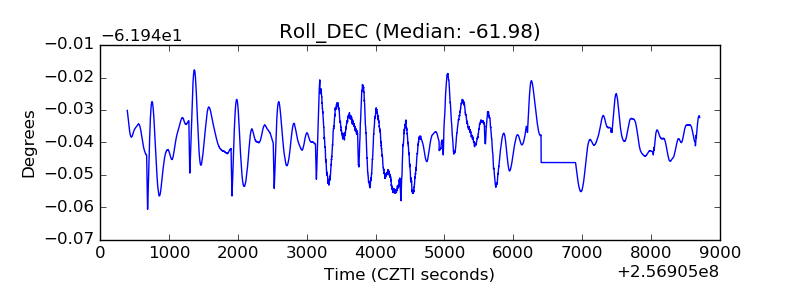 |
| _Roll_RA | 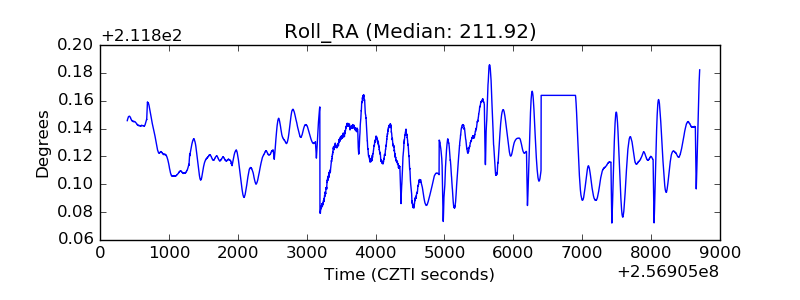 |
| Veto Counter | 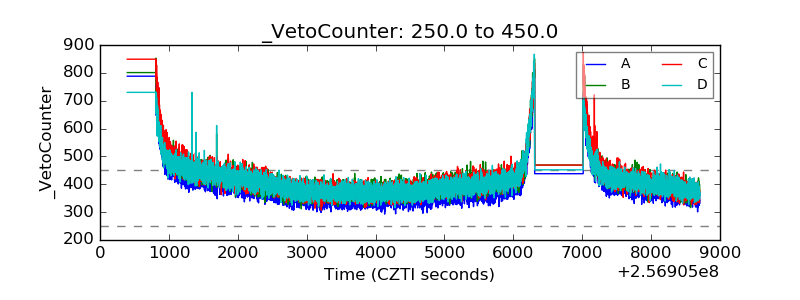 |