| Param | Original file | Final file |
|---|---|---|
| Filename | modeM0/AS1G08_055T01_9000001912_12987cztM0_level2.evt | modeM0/AS1G08_055T01_9000001912_12987cztM0_level2_quad_clean.evt |
| Size (bytes) | 651,360,960 | 87,341,760 |
| Size | 621.2 MB | 83.3 MB |
| Events in quadrant A | 3,984,833 | 541,522 |
| Events in quadrant B | 6,150,360 | 514,533 |
| Events in quadrant C | 3,550,342 | 545,008 |
| Events in quadrant D | 5,525,042 | 513,607 |
| Mode M9 | |||
|---|---|---|---|
| Quadrant | BADHDUFLAG | Total packets | Discarded packets |
| A | 0 | 3 | 0 |
| B | 0 | 3 | 0 |
| C | 0 | 3 | 0 |
| D | 0 | 4 | 0 |
| Mode SS | |||
|---|---|---|---|
| Quadrant | BADHDUFLAG | Total packets | Discarded packets |
| A | 0 | 154 | 0 |
| B | 0 | 154 | 0 |
| C | 0 | 154 | 0 |
| D | 0 | 154 | 0 |
| Mode M0 | |||
|---|---|---|---|
| Quadrant | BADHDUFLAG | Total packets | Discarded packets |
| A | 0 | 16685 | 3 |
| B | 0 | 23282 | 2 |
| C | 0 | 15864 | 2 |
| D | 0 | 21529 | 2 |
| Quadrant | Total seconds | Saturated seconds | Saturation percentage |
|---|---|---|---|
| A | 7617 | 204 | 2.678220% |
| B | 7617 | 930 | 12.209531% |
| C | 7617 | 128 | 1.680452% |
| D | 7617 | 379 | 4.975712% |
Noise dominated data is calculated using 1-second bins in cleaned event files. If a bin has >2000 counts, and if more than 50% of those come from <1% of pixels, then it is considered to be noise-dominated and hence unusable.
| Quadrant | # 1 sec bins | Bins with >0 counts | Bins with >2000 counts | High rate bins dominated by noise | Noise dominated (total time) | Noise dominated (detector-on time) | Marked lightcurve |
|---|---|---|---|---|---|---|---|
| A | 7918 | 7619 | 12 | 12 | 0.15% | 0.16% | 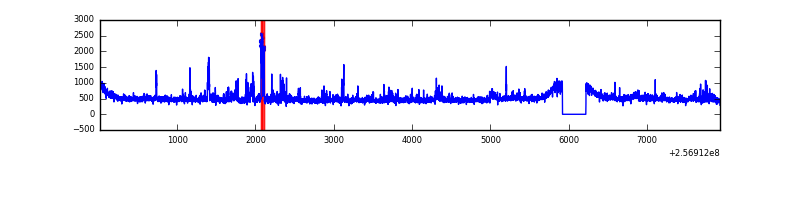 |
| B | 7918 | 7619 | 504 | 504 | 6.37% | 6.62% | 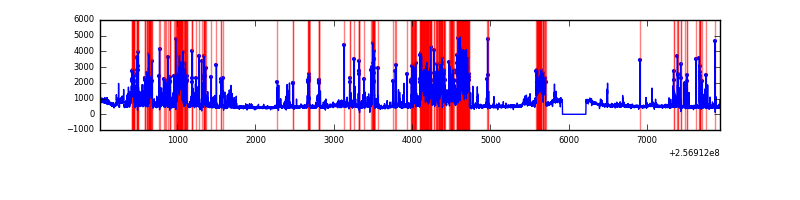 |
| C | 7918 | 7619 | 3 | 3 | 0.04% | 0.04% | 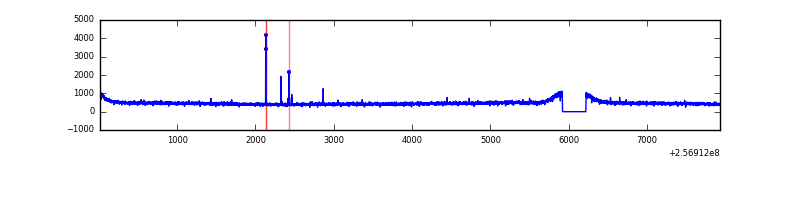 |
| D | 7918 | 7619 | 218 | 218 | 2.75% | 2.86% | 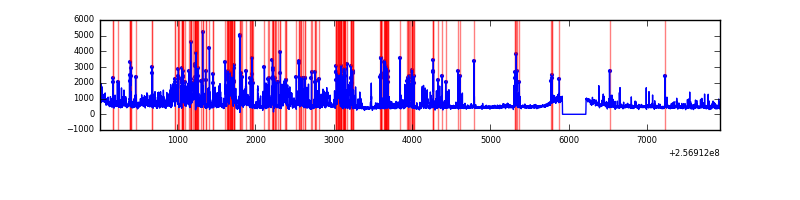 |
Top three noisy pixels from each quadrant. If the there are fewer than three noisy pixels in the level2.evt file, extra rows are filled as -1
| Pixel properties | Quadrant properties | ||||||
|---|---|---|---|---|---|---|---|
| Quadrant | DetID | PixID | Counts | Sigma | Mean | Median | Sigma |
| A | 12 | 189 | 237470 | 1271.2 | 921 | 900 | 186.1 |
| A | 9 | 143 | 91428 | 486.45 | 921 | 900 | 186.1 |
| A | 1 | 162 | 53236 | 281.22 | 921 | 900 | 186.1 |
| B | 0 | 85 | 1646687 | 9681.87 | 886 | 861 | 170.0 |
| B | 3 | 64 | 677666 | 3981.43 | 886 | 861 | 170.0 |
| B | 4 | 239 | 187606 | 1098.56 | 886 | 861 | 170.0 |
| C | 14 | 234 | 15656 | 70.31 | 905 | 910 | 209.7 |
| C | 13 | 61 | 6538 | 26.83 | 905 | 910 | 209.7 |
| C | 0 | 207 | 3039 | 10.15 | 905 | 910 | 209.7 |
| D | 1 | 52 | 2120680 | 9897.41 | 893 | 867 | 214.2 |
| D | 2 | 234 | 33432 | 152.05 | 893 | 867 | 214.2 |
| D | 1 | 0 | 10123 | 43.22 | 893 | 867 | 214.2 |
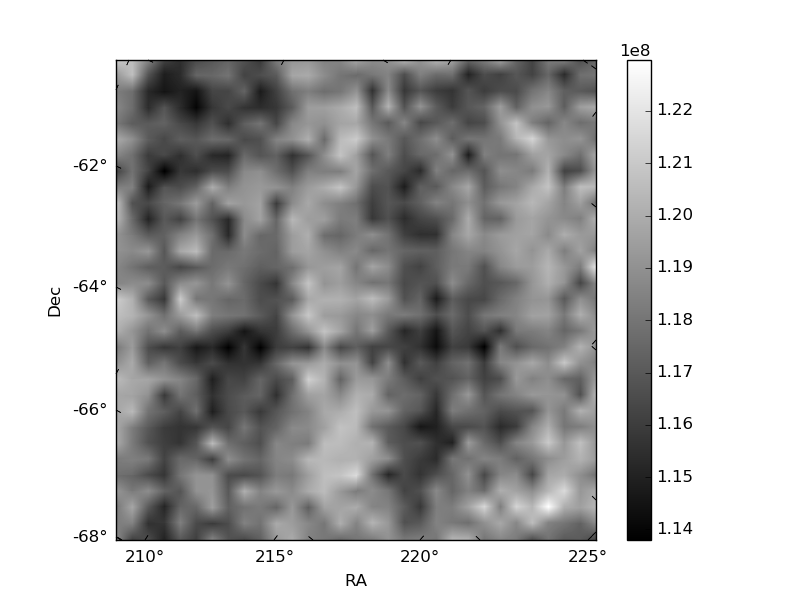
Histogram calculated using DETX and DETY for each event in the final _common_clean file
| Quadrant A | 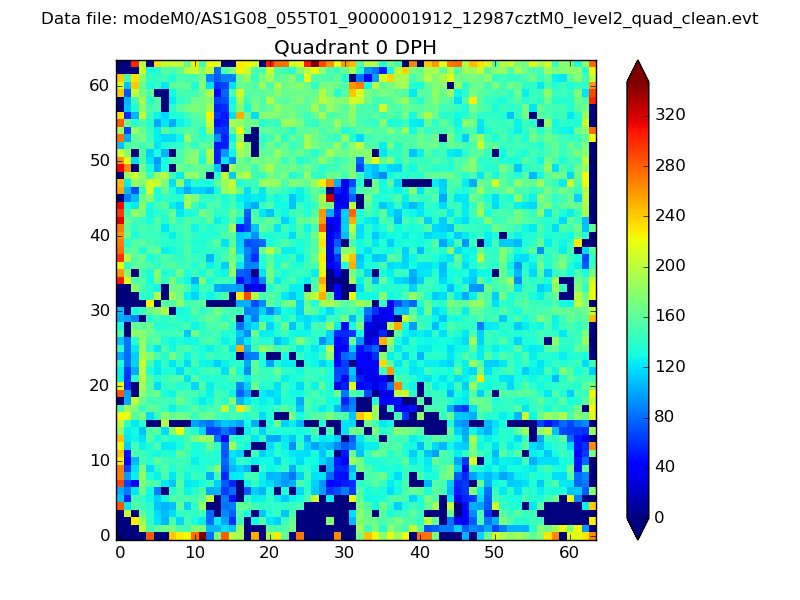 |
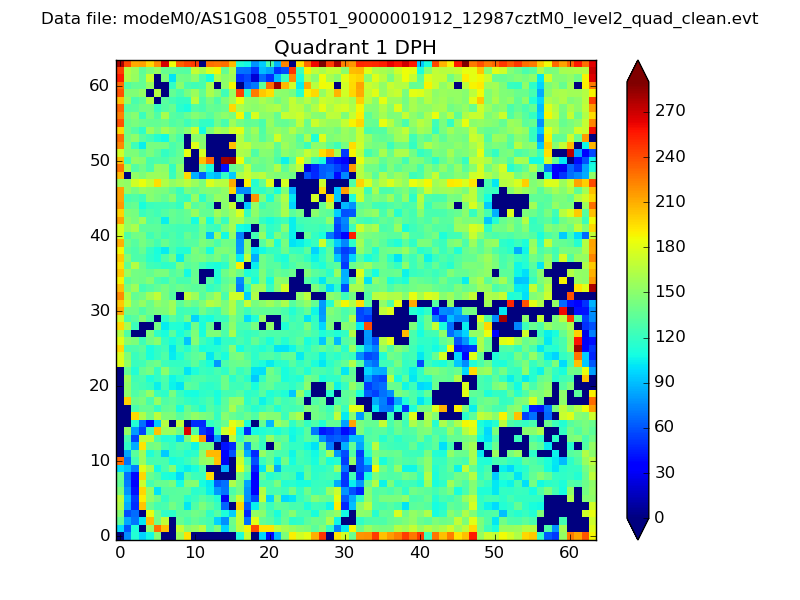 |
Quadrant B |
|---|---|---|---|
| Quadrant D | 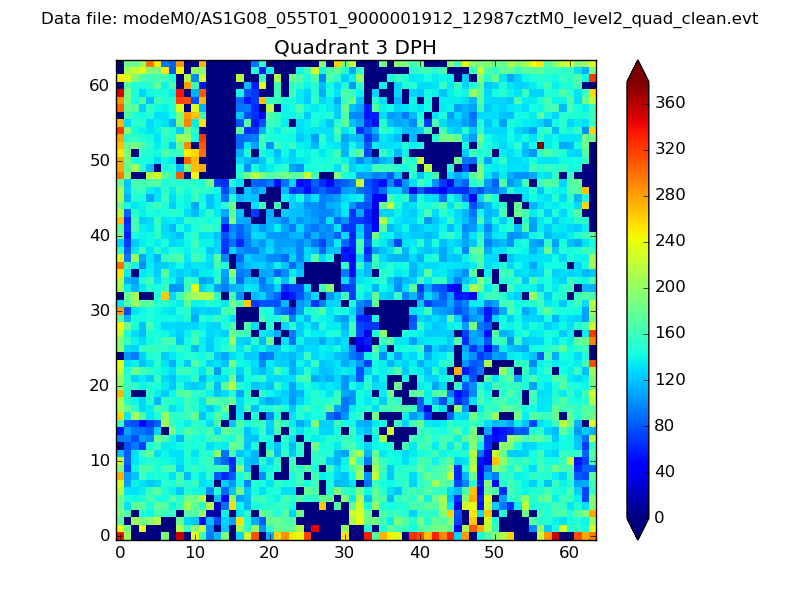 |
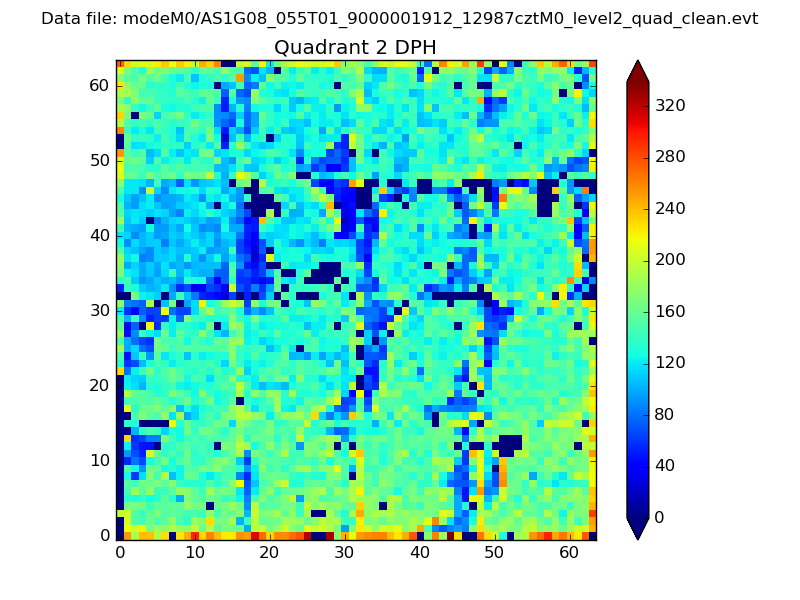 |
Quadrant C |
| Plot type | Count rate plots | Images |
|---|---|---|
| Comparison with Poisson distribution Blue bars denote a histogram of data divided into 1 sec bins. Red curve is a Poisson curve with rate = median count rate of data. |
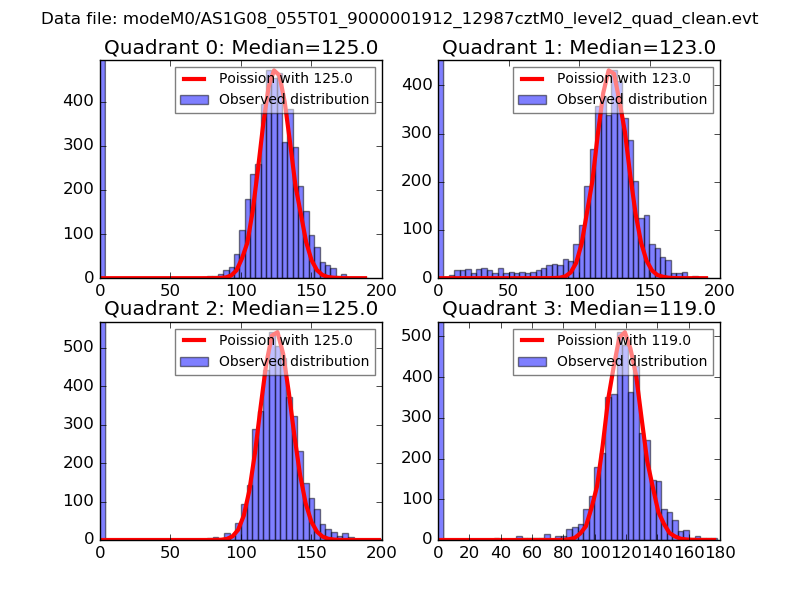 |
 |
| Quadrant-wise count rates Data is divided into 100 sec bins |
 |
|
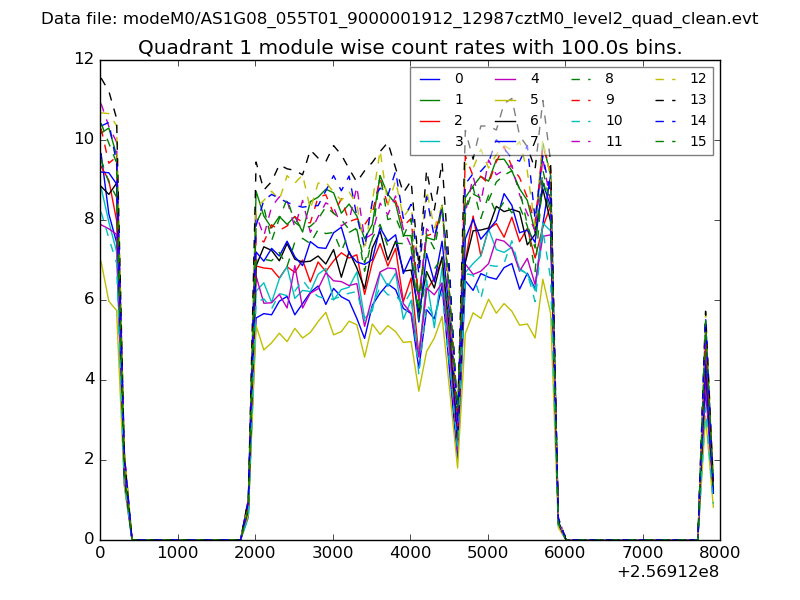
| Module-wise count rates for Quadrant A Data is divided into 100 sec bins |
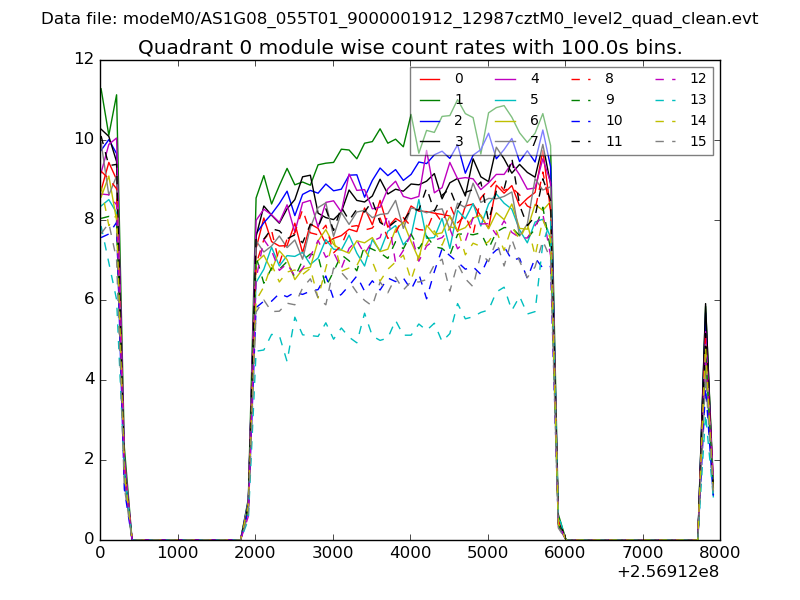 |
 |
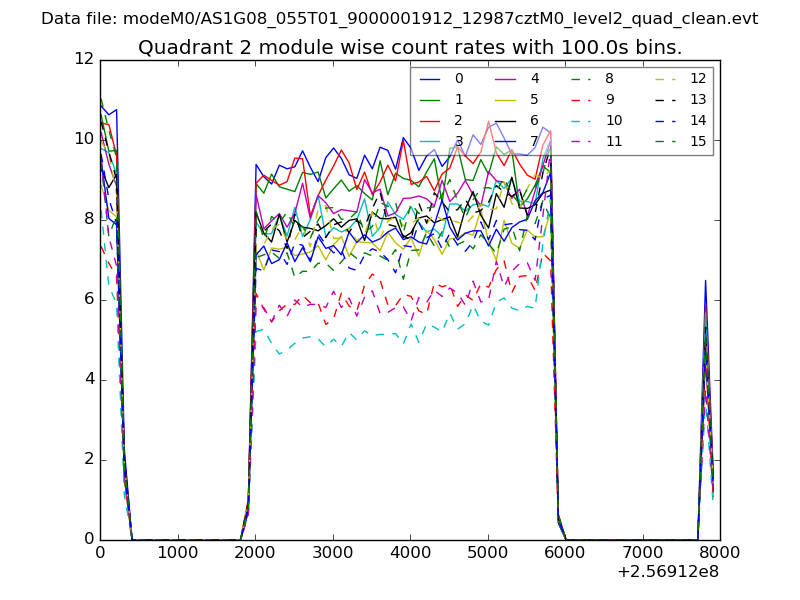
| Module-wise count rates for Quadrant B Data is divided into 100 sec bins |
 |
 |
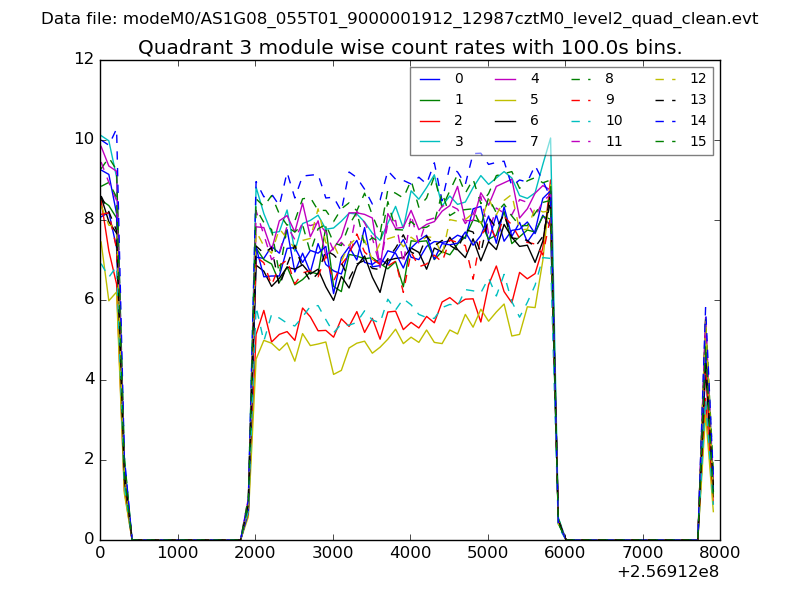
| Module-wise count rates for Quadrant C Data is divided into 100 sec bins |
 |
 |
| Module-wise count rates for Quadrant D Data is divided into 100 sec bins |
 |
 |
| Parameter | Plot |
|---|---|
| CZT HV Monitor | 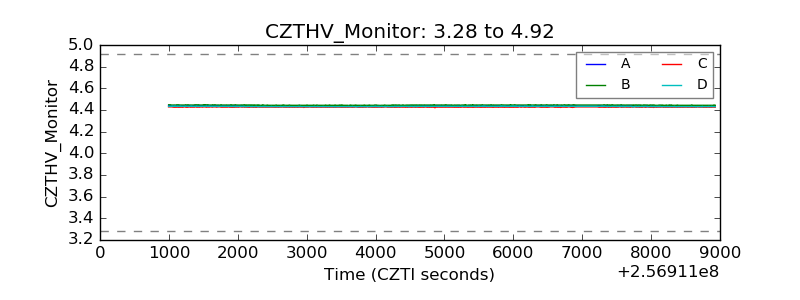 |
| D_VDD | 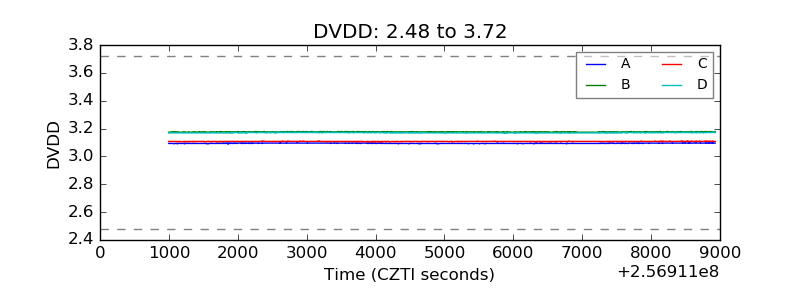 |
| Temperature 1 | 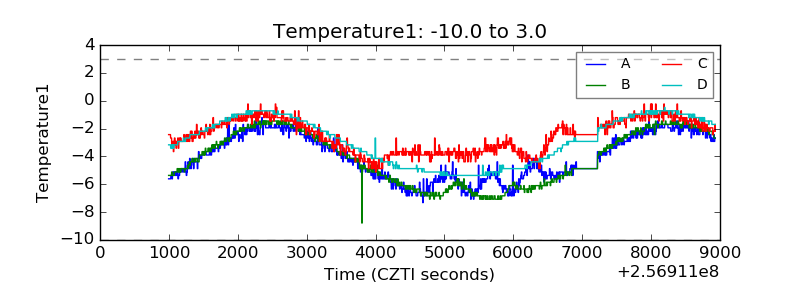 |
| Veto HV Monitor | 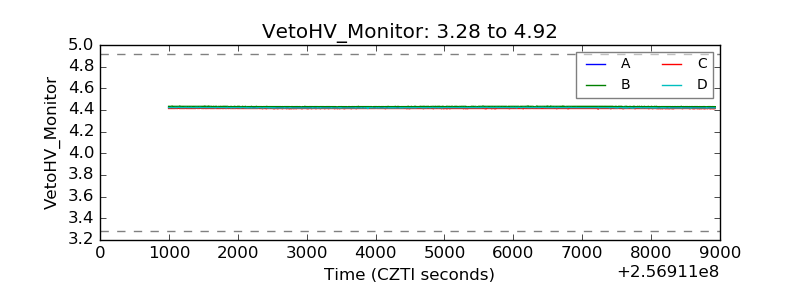 |
| Veto LLD | 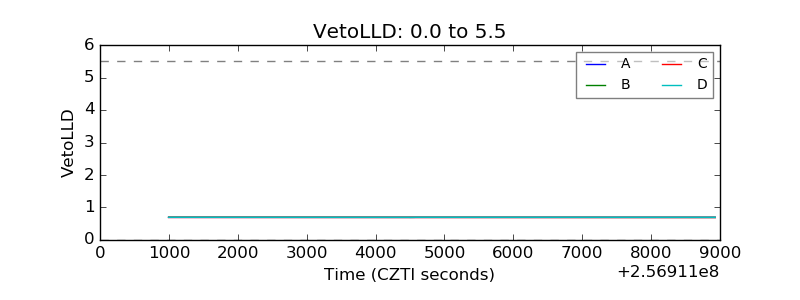 |
| Alpha Counter | 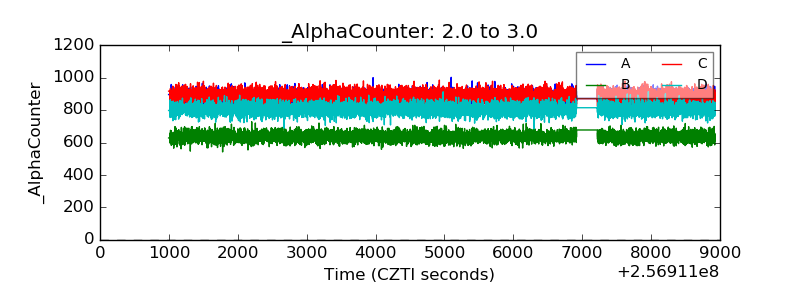 |
| _CPM_Rate | 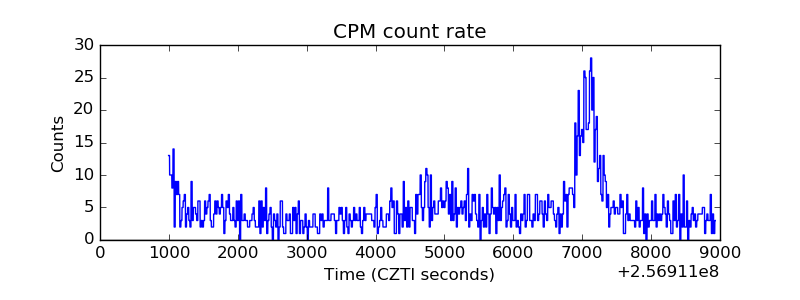 |
| CZT Counter | 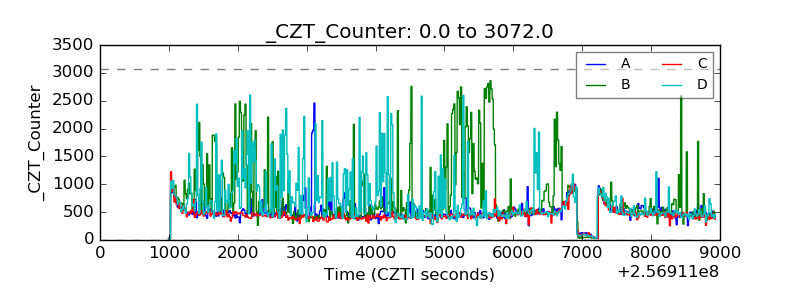 |
| +2.5 Volts monitor |  |
| +5 Volts monitor |  |
| _ROLL_ROT | 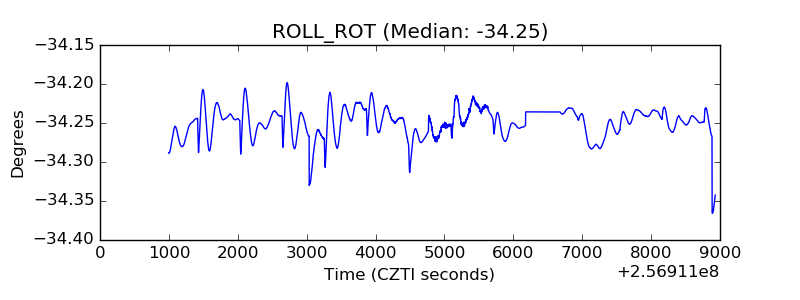 |
| _Roll_DEC | 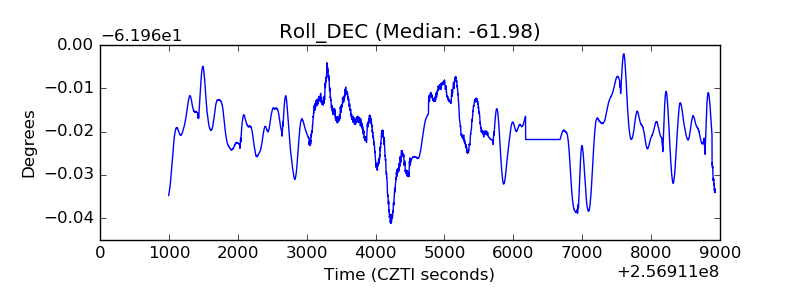 |
| _Roll_RA | 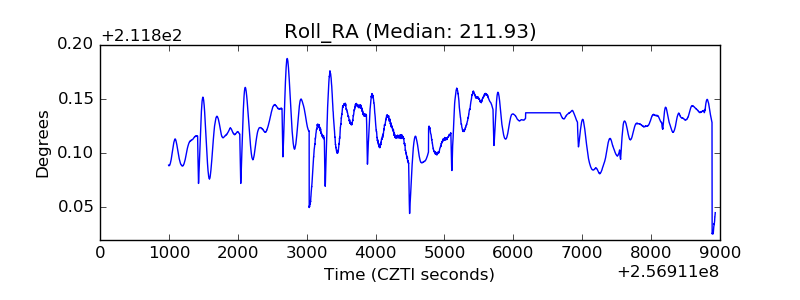 |
| Veto Counter | 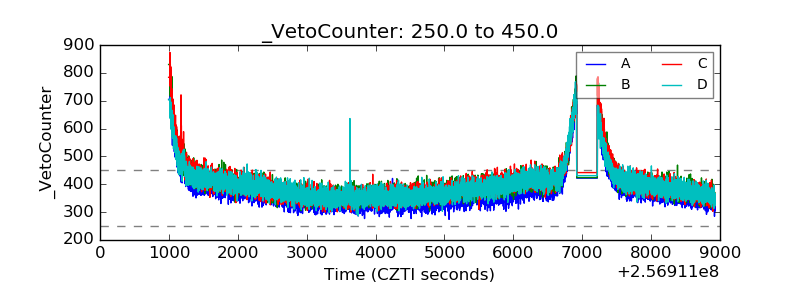 |