| Param | Original file | Final file |
|---|---|---|
| Filename | modeM0/AS1G08_055T01_9000001912_12991cztM0_level2.evt | modeM0/AS1G08_055T01_9000001912_12991cztM0_level2_quad_clean.evt |
| Size (bytes) | 1,010,131,200 | 184,193,280 |
| Size | 963.3 MB | 175.7 MB |
| Events in quadrant A | 6,730,262 | 1,195,556 |
| Events in quadrant B | 9,337,850 | 1,121,106 |
| Events in quadrant C | 6,103,179 | 1,189,037 |
| Events in quadrant D | 7,500,443 | 1,133,684 |
| Mode M9 | |||
|---|---|---|---|
| Quadrant | BADHDUFLAG | Total packets | Discarded packets |
| A | 0 | 16 | 0 |
| B | 0 | 16 | 0 |
| C | 0 | 16 | 0 |
| D | 0 | 16 | 0 |
| Mode SS | |||
|---|---|---|---|
| Quadrant | BADHDUFLAG | Total packets | Discarded packets |
| A | 0 | 276 | 0 |
| B | 0 | 276 | 0 |
| C | 0 | 276 | 0 |
| D | 0 | 276 | 0 |
| Mode M0 | |||
|---|---|---|---|
| Quadrant | BADHDUFLAG | Total packets | Discarded packets |
| A | 0 | 28867 | 3 |
| B | 0 | 36610 | 2 |
| C | 0 | 27619 | 2 |
| D | 0 | 31743 | 2 |
| Quadrant | Total seconds | Saturated seconds | Saturation percentage |
|---|---|---|---|
| A | 13592 | 120 | 0.882872% |
| B | 13592 | 1591 | 11.705415% |
| C | 13592 | 48 | 0.353149% |
| D | 13592 | 372 | 2.736904% |
Noise dominated data is calculated using 1-second bins in cleaned event files. If a bin has >2000 counts, and if more than 50% of those come from <1% of pixels, then it is considered to be noise-dominated and hence unusable.
| Quadrant | # 1 sec bins | Bins with >0 counts | Bins with >2000 counts | High rate bins dominated by noise | Noise dominated (total time) | Noise dominated (detector-on time) | Marked lightcurve |
|---|---|---|---|---|---|---|---|
| A | 15248 | 13596 | 4 | 4 | 0.03% | 0.03% | 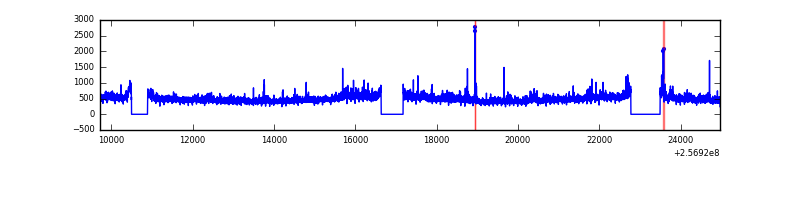 |
| B | 15248 | 13595 | 675 | 675 | 4.43% | 4.97% | 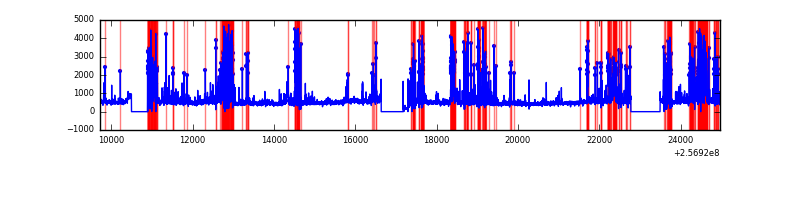 |
| C | 15248 | 13596 | 1 | 1 | 0.01% | 0.01% | 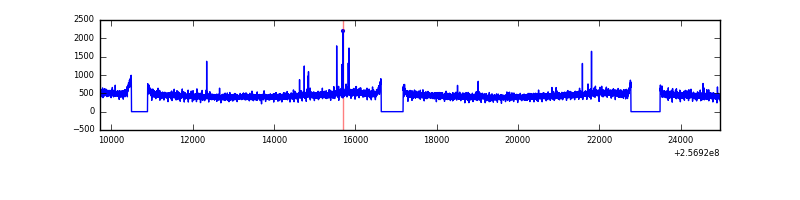 |
| D | 15248 | 13596 | 225 | 225 | 1.48% | 1.65% | 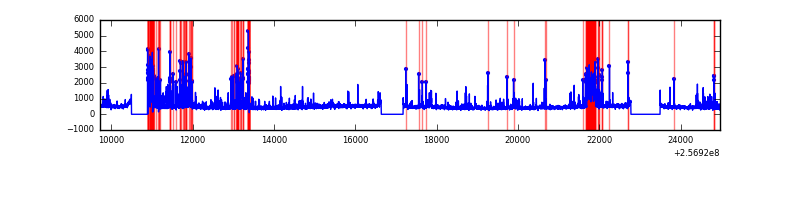 |
Top three noisy pixels from each quadrant. If the there are fewer than three noisy pixels in the level2.evt file, extra rows are filled as -1
| Pixel properties | Quadrant properties | ||||||
|---|---|---|---|---|---|---|---|
| Quadrant | DetID | PixID | Counts | Sigma | Mean | Median | Sigma |
| A | 12 | 189 | 297596 | 911.38 | 1600 | 1566 | 324.8 |
| A | 1 | 162 | 99517 | 301.56 | 1600 | 1566 | 324.8 |
| A | 13 | 248 | 70875 | 213.38 | 1600 | 1566 | 324.8 |
| B | 4 | 239 | 2004336 | 7130.39 | 1475 | 1435 | 280.9 |
| B | 3 | 64 | 615247 | 2185.19 | 1475 | 1435 | 280.9 |
| B | 10 | 245 | 303716 | 1076.13 | 1475 | 1435 | 280.9 |
| C | 14 | 234 | 17246 | 43.63 | 1557 | 1563 | 359.4 |
| C | 13 | 61 | 11224 | 26.88 | 1557 | 1563 | 359.4 |
| C | 12 | 4 | 10140 | 23.86 | 1557 | 1563 | 359.4 |
| D | 1 | 52 | 1457866 | 3954.05 | 1533 | 1489 | 368.3 |
| D | 8 | 195 | 106824 | 285.98 | 1533 | 1489 | 368.3 |
| D | 10 | 157 | 78585 | 209.31 | 1533 | 1489 | 368.3 |
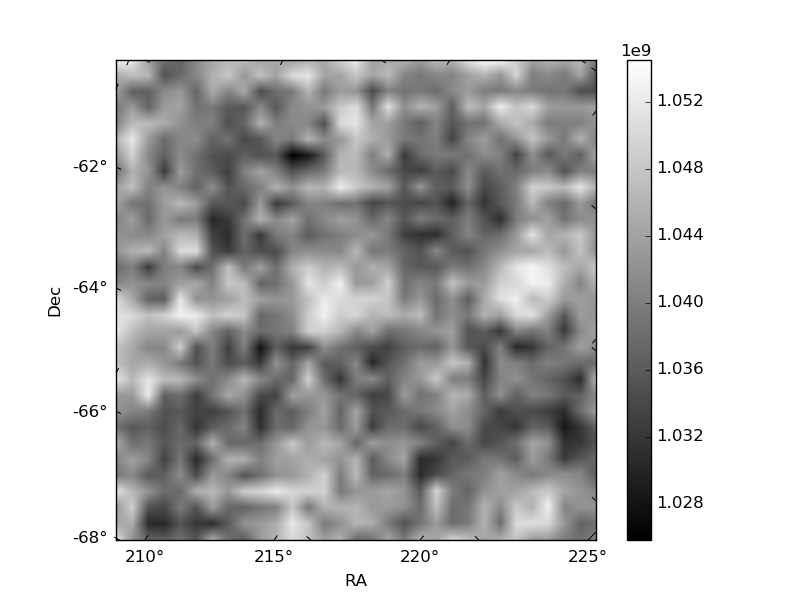
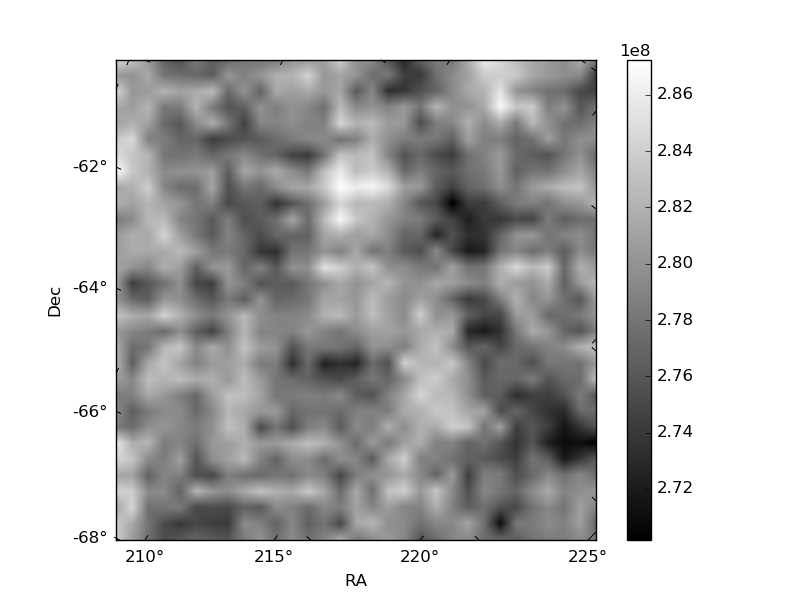
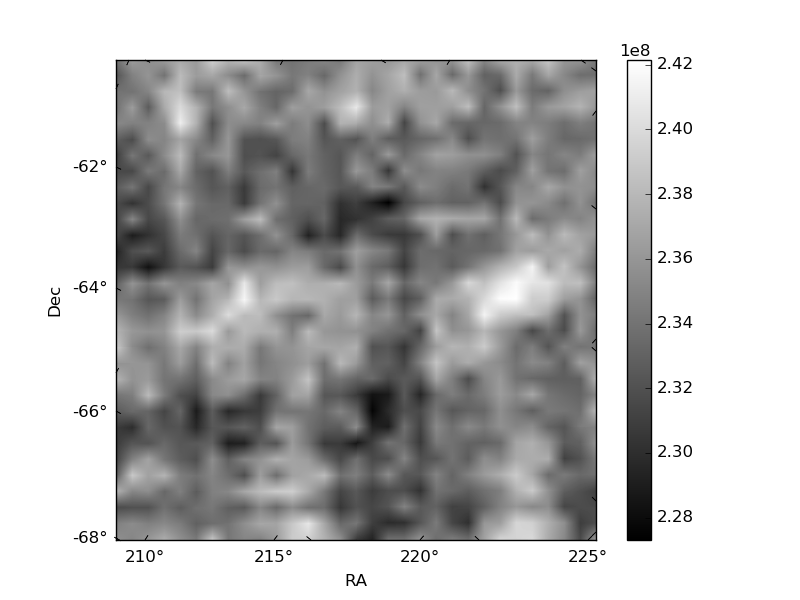
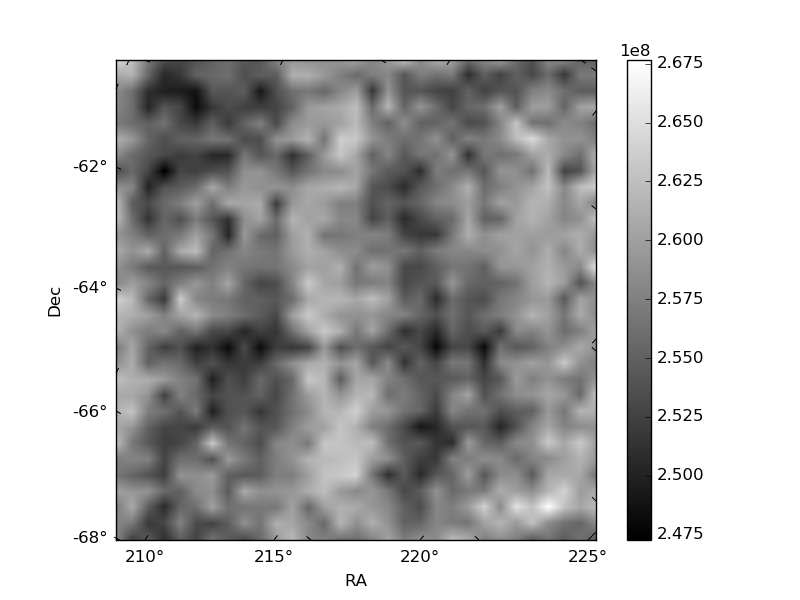
Histogram calculated using DETX and DETY for each event in the final _common_clean file
| Quadrant A | 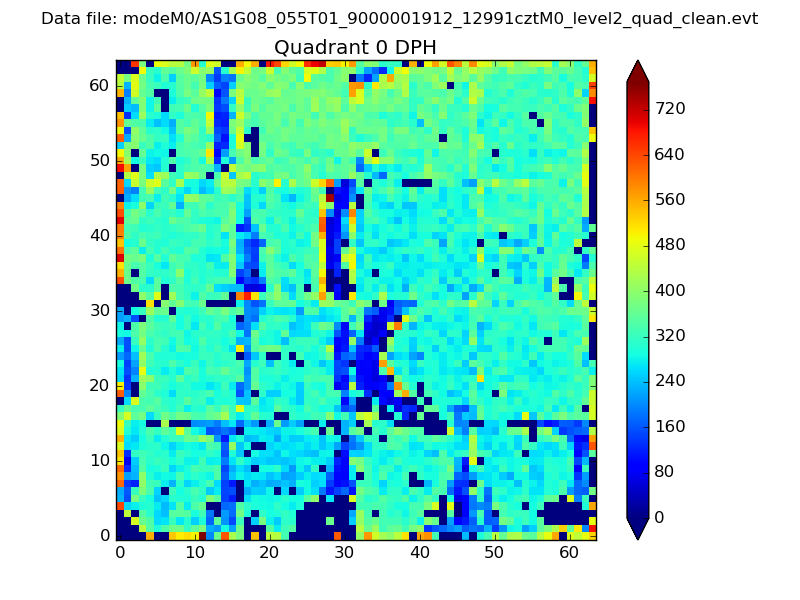 |
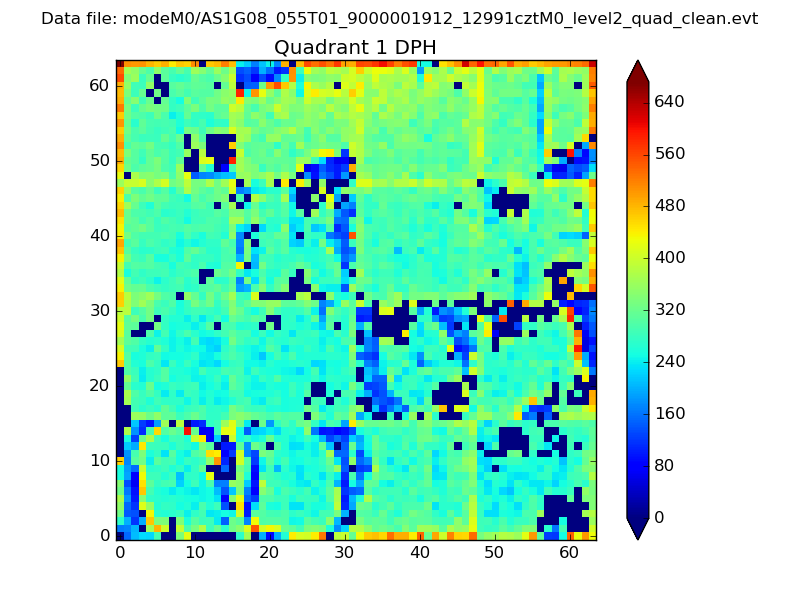 |
Quadrant B |
|---|---|---|---|
| Quadrant D | 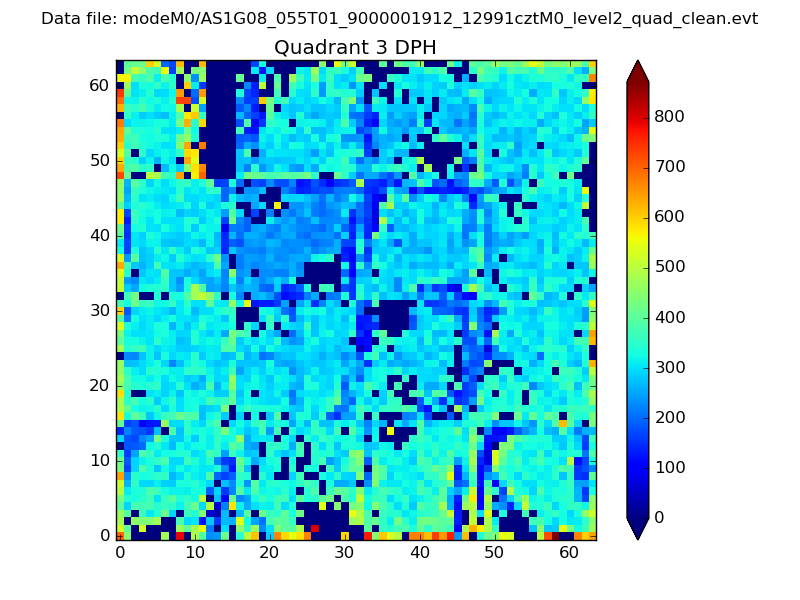 |
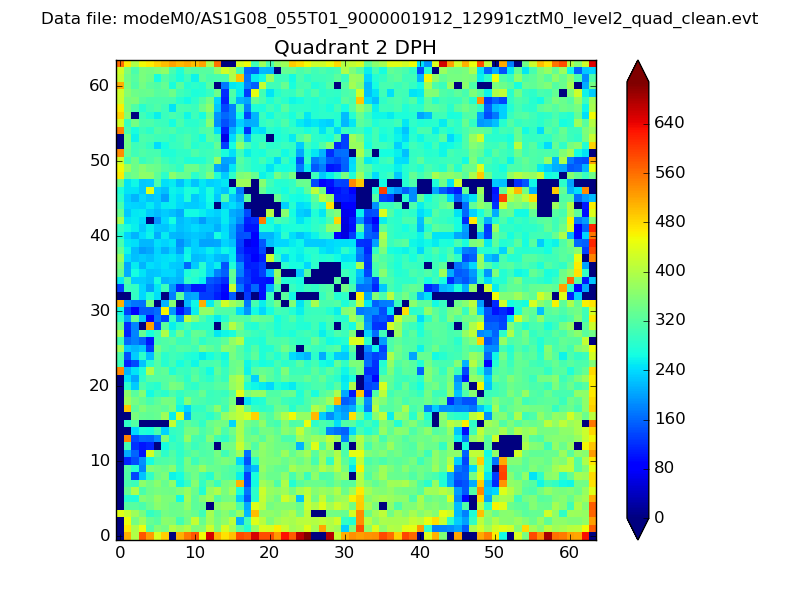 |
Quadrant C |
| Plot type | Count rate plots | Images |
|---|---|---|
| Comparison with Poisson distribution Blue bars denote a histogram of data divided into 1 sec bins. Red curve is a Poisson curve with rate = median count rate of data. |
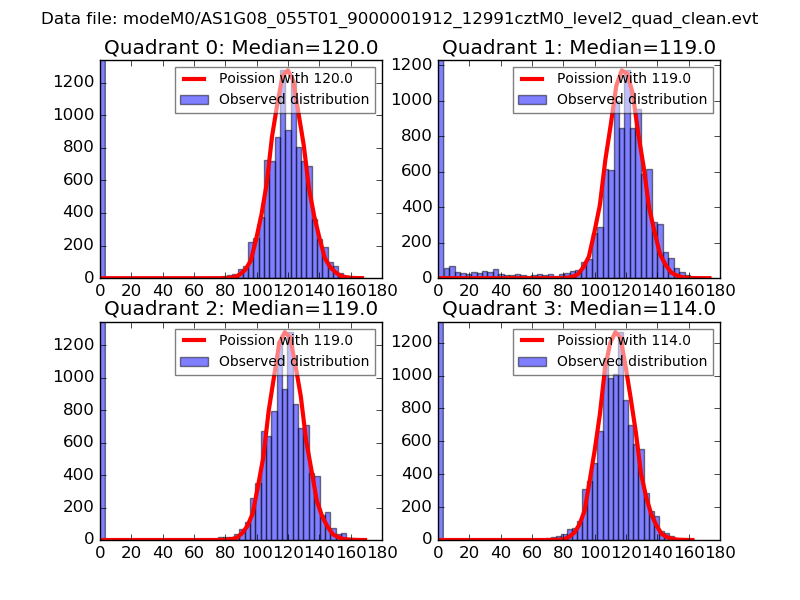 |
 |
| Quadrant-wise count rates Data is divided into 100 sec bins |
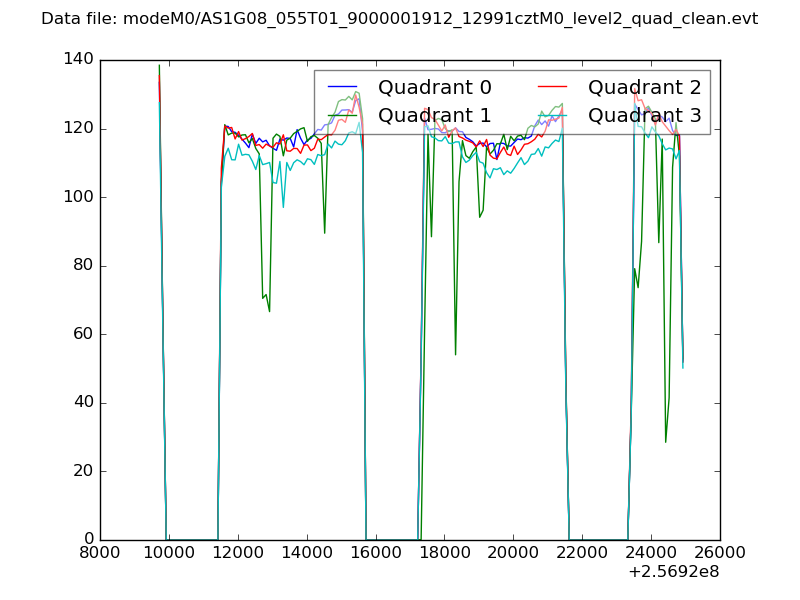 |
|
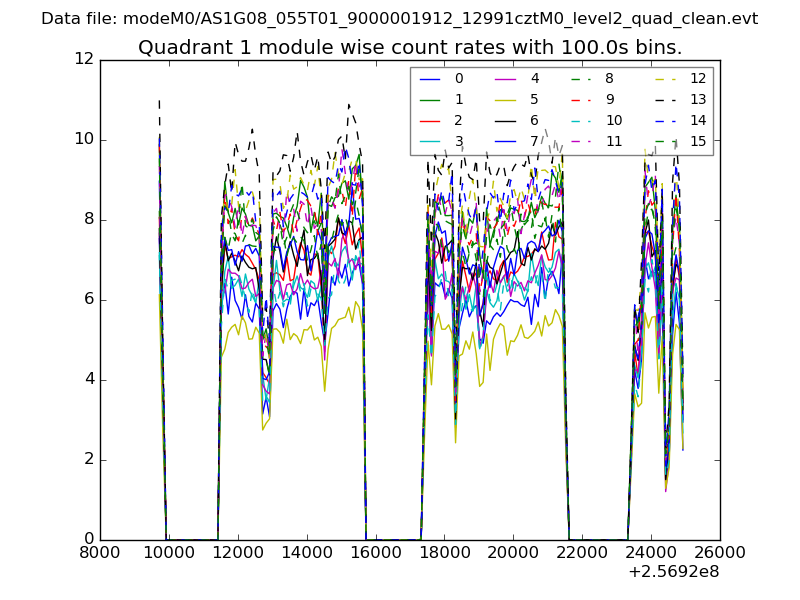
| Module-wise count rates for Quadrant A Data is divided into 100 sec bins |
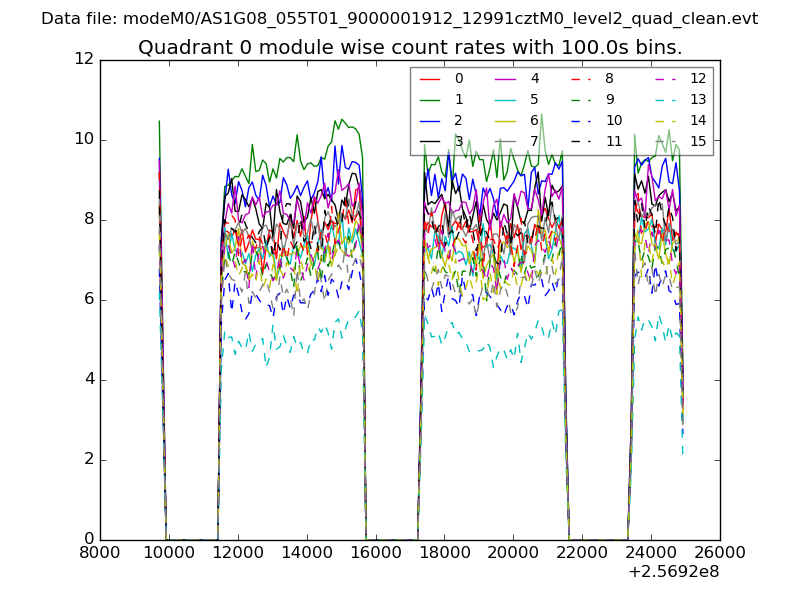 |
 |
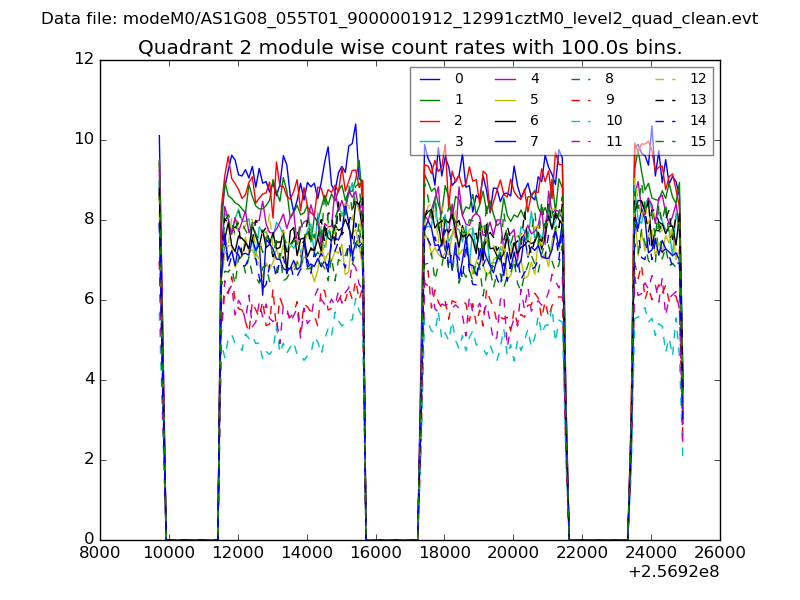
| Module-wise count rates for Quadrant B Data is divided into 100 sec bins |
 |
 |
| Module-wise count rates for Quadrant C Data is divided into 100 sec bins |
 |
 |
| Module-wise count rates for Quadrant D Data is divided into 100 sec bins |
 |
 |
| Parameter | Plot |
|---|---|
| CZT HV Monitor | 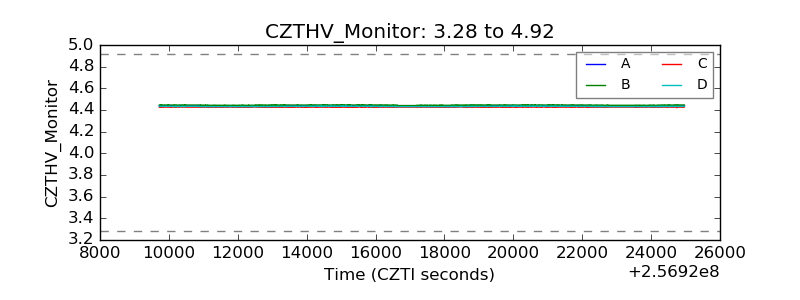 |
| D_VDD | 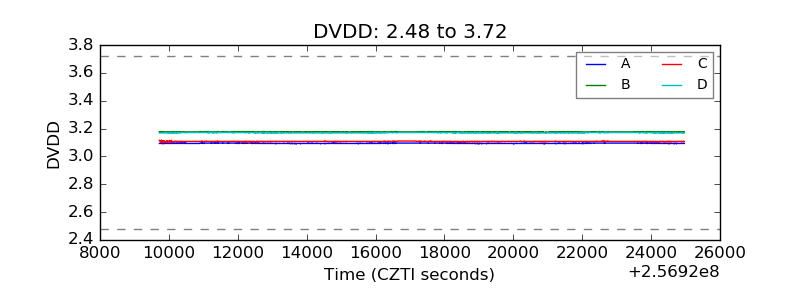 |
| Temperature 1 |  |
| Veto HV Monitor | 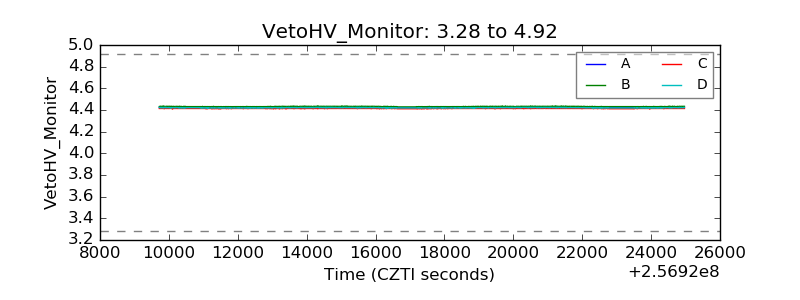 |
| Veto LLD | 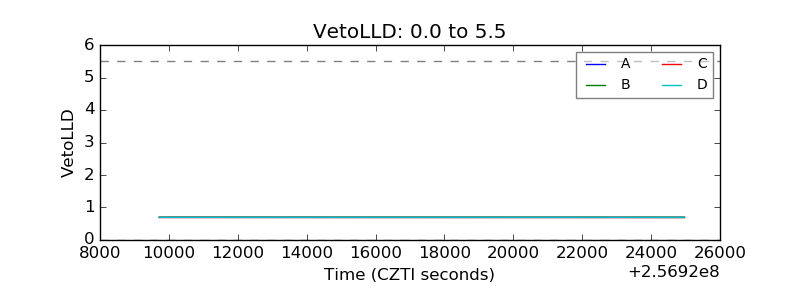 |
| Alpha Counter | 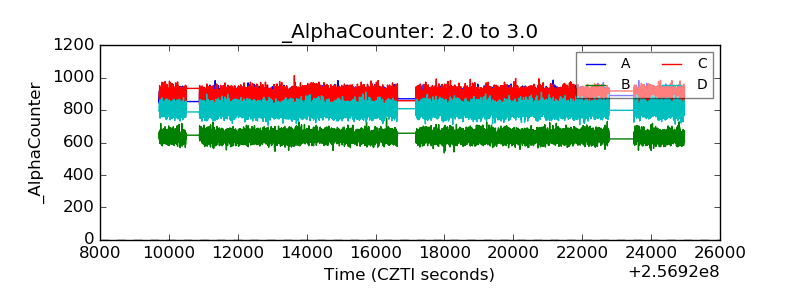 |
| _CPM_Rate | 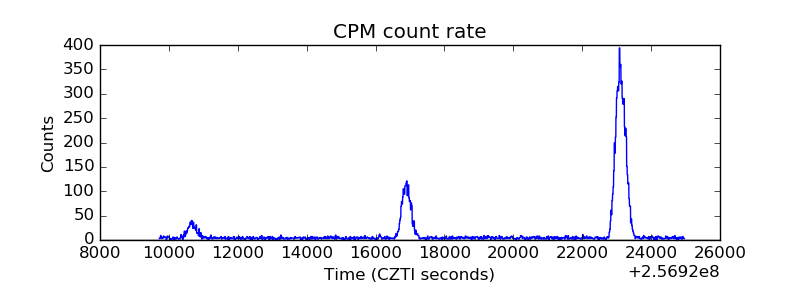 |
| CZT Counter | 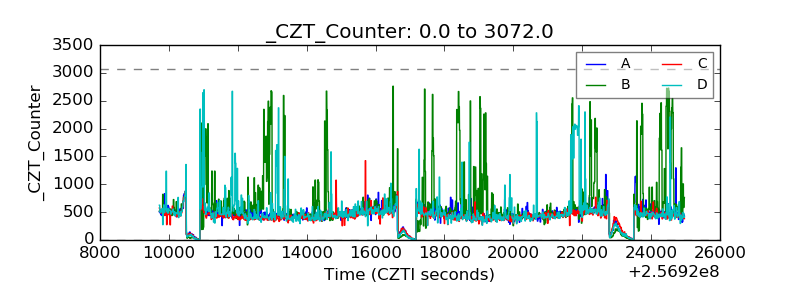 |
| +2.5 Volts monitor |  |
| +5 Volts monitor |  |
| _ROLL_ROT | 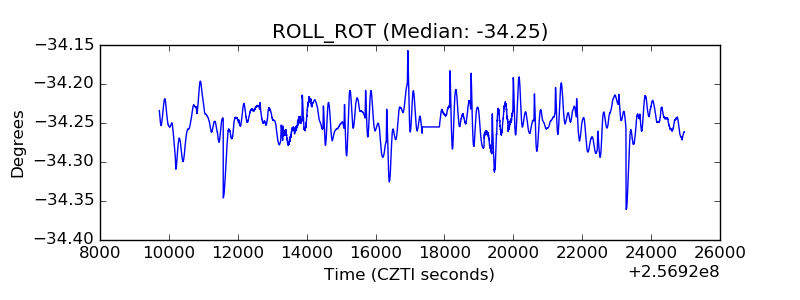 |
| _Roll_DEC | 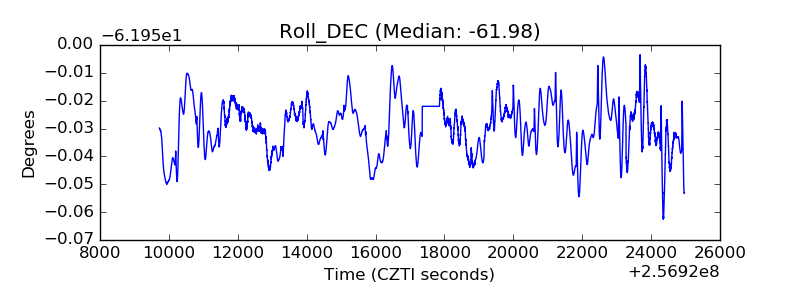 |
| _Roll_RA | 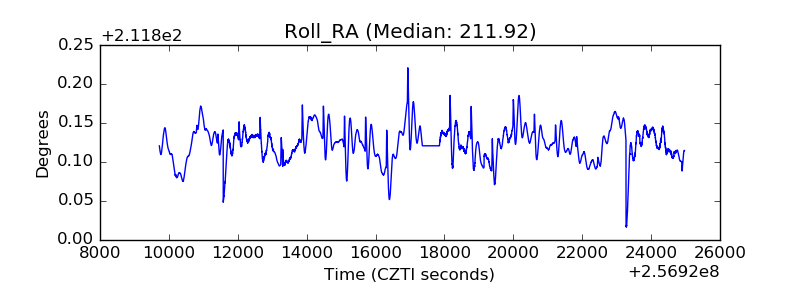 |
| Veto Counter |  |