| Param | Original file | Final file |
|---|---|---|
| Filename | modeM0/AS1G08_055T01_9000001912_12992cztM0_level2.evt | modeM0/AS1G08_055T01_9000001912_12992cztM0_level2_quad_clean.evt |
| Size (bytes) | 588,072,960 | 100,065,600 |
| Size | 560.8 MB | 95.4 MB |
| Events in quadrant A | 3,875,489 | 651,569 |
| Events in quadrant B | 6,094,052 | 582,382 |
| Events in quadrant C | 3,507,150 | 650,207 |
| Events in quadrant D | 3,817,936 | 617,792 |
| Mode M9 | |||
|---|---|---|---|
| Quadrant | BADHDUFLAG | Total packets | Discarded packets |
| A | 0 | 16 | 0 |
| B | 0 | 16 | 0 |
| C | 0 | 16 | 0 |
| D | 0 | 16 | 0 |
| Mode SS | |||
|---|---|---|---|
| Quadrant | BADHDUFLAG | Total packets | Discarded packets |
| A | 0 | 156 | 0 |
| B | 0 | 156 | 0 |
| C | 0 | 156 | 0 |
| D | 0 | 156 | 0 |
| Mode M0 | |||
|---|---|---|---|
| Quadrant | BADHDUFLAG | Total packets | Discarded packets |
| A | 0 | 16577 | 2 |
| B | 0 | 23185 | 1 |
| C | 0 | 15619 | 1 |
| D | 0 | 16729 | 1 |
| Quadrant | Total seconds | Saturated seconds | Saturation percentage |
|---|---|---|---|
| A | 7591 | 40 | 0.526940% |
| B | 7591 | 1173 | 15.452510% |
| C | 7591 | 32 | 0.421552% |
| D | 7591 | 81 | 1.067053% |
Noise dominated data is calculated using 1-second bins in cleaned event files. If a bin has >2000 counts, and if more than 50% of those come from <1% of pixels, then it is considered to be noise-dominated and hence unusable.
| Quadrant | # 1 sec bins | Bins with >0 counts | Bins with >2000 counts | High rate bins dominated by noise | Noise dominated (total time) | Noise dominated (detector-on time) | Marked lightcurve |
|---|---|---|---|---|---|---|---|
| A | 9192 | 7594 | 2 | 2 | 0.02% | 0.03% | 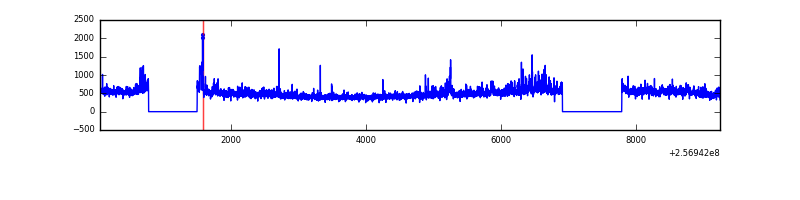 |
| B | 9192 | 7594 | 605 | 605 | 6.58% | 7.97% | 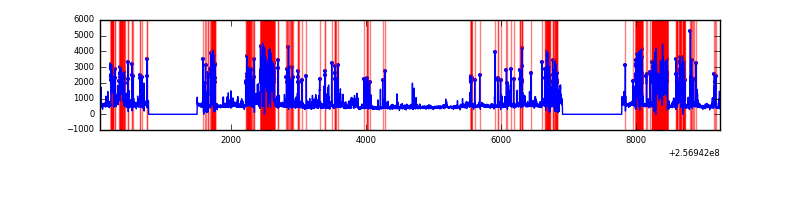 |
| C | 9192 | 7594 | 15 | 15 | 0.16% | 0.20% | 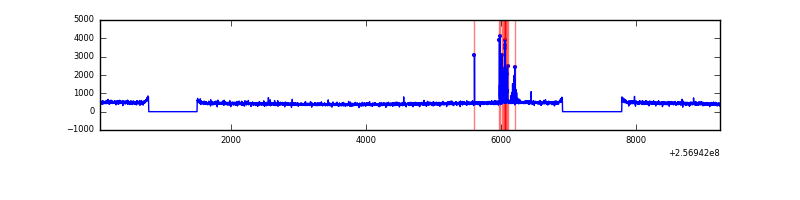 |
| D | 9192 | 7594 | 49 | 49 | 0.53% | 0.65% | 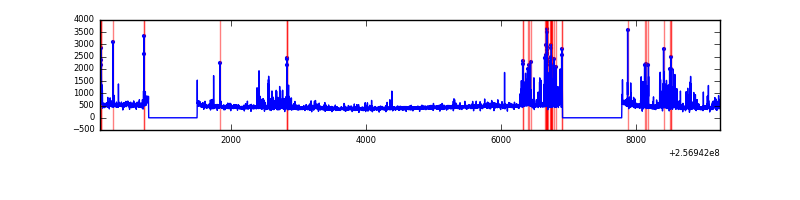 |
Top three noisy pixels from each quadrant. If the there are fewer than three noisy pixels in the level2.evt file, extra rows are filled as -1
| Pixel properties | Quadrant properties | ||||||
|---|---|---|---|---|---|---|---|
| Quadrant | DetID | PixID | Counts | Sigma | Mean | Median | Sigma |
| A | 12 | 189 | 246530 | 1341.22 | 898 | 877 | 183.2 |
| A | 13 | 248 | 76301 | 411.8 | 898 | 877 | 183.2 |
| A | 1 | 162 | 37112 | 197.84 | 898 | 877 | 183.2 |
| B | 4 | 239 | 1831418 | 11798.02 | 812 | 789 | 155.2 |
| B | 3 | 64 | 565625 | 3640.25 | 812 | 789 | 155.2 |
| B | 10 | 245 | 240529 | 1545.07 | 812 | 789 | 155.2 |
| C | 0 | 207 | 88174 | 428.96 | 874 | 876 | 203.5 |
| C | 13 | 61 | 6313 | 26.72 | 874 | 876 | 203.5 |
| C | 14 | 234 | 4631 | 18.45 | 874 | 876 | 203.5 |
| D | 10 | 157 | 428918 | 2074.73 | 863 | 839 | 206.3 |
| D | 1 | 52 | 36846 | 174.51 | 863 | 839 | 206.3 |
| D | 13 | 122 | 34946 | 165.3 | 863 | 839 | 206.3 |
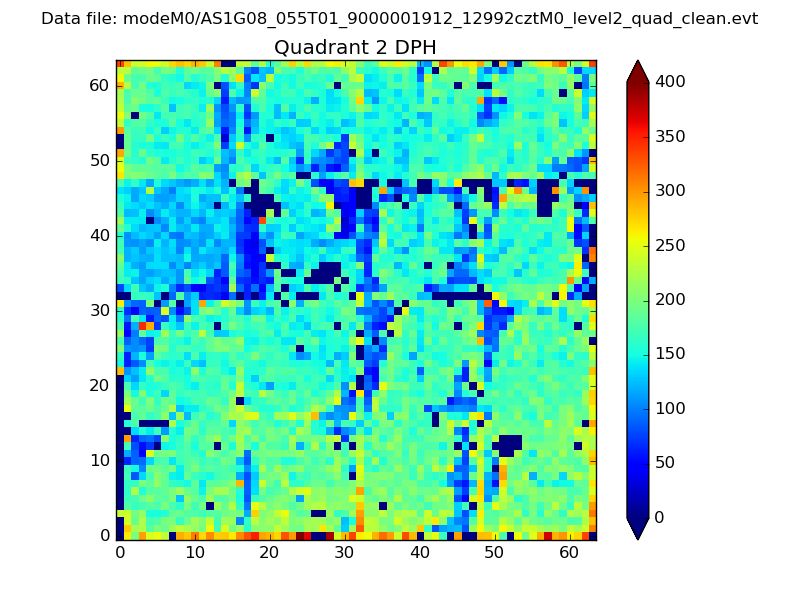
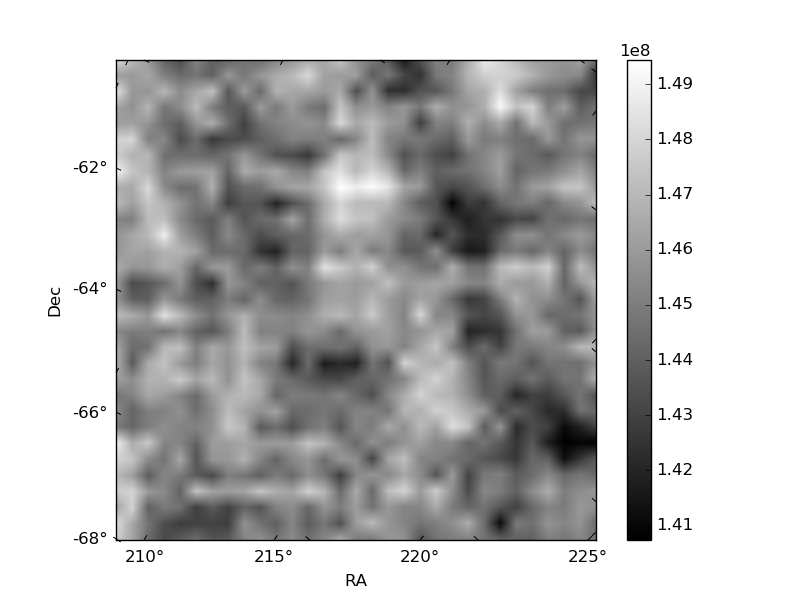
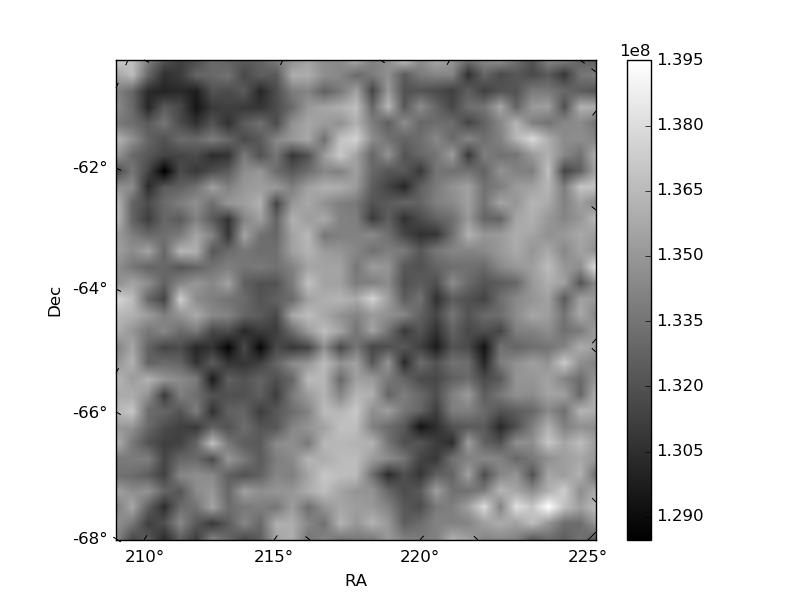
Histogram calculated using DETX and DETY for each event in the final _common_clean file
| Quadrant A | 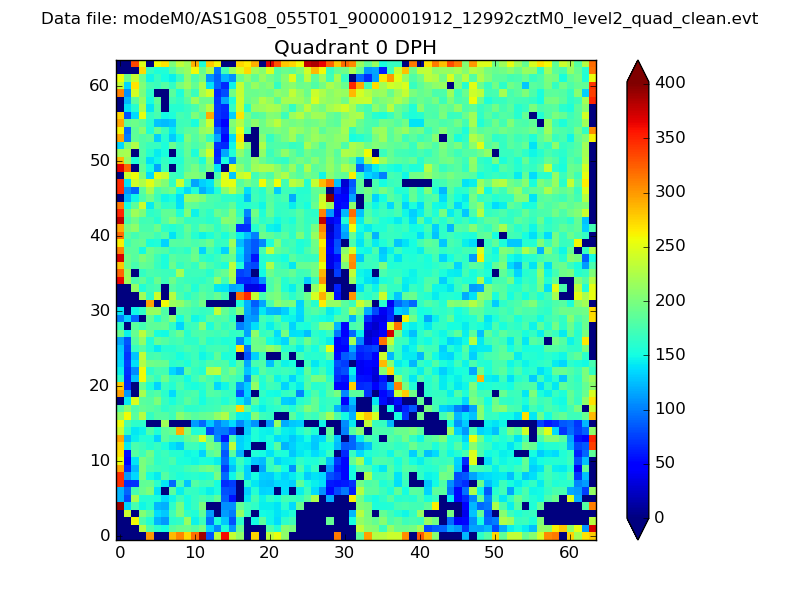 |
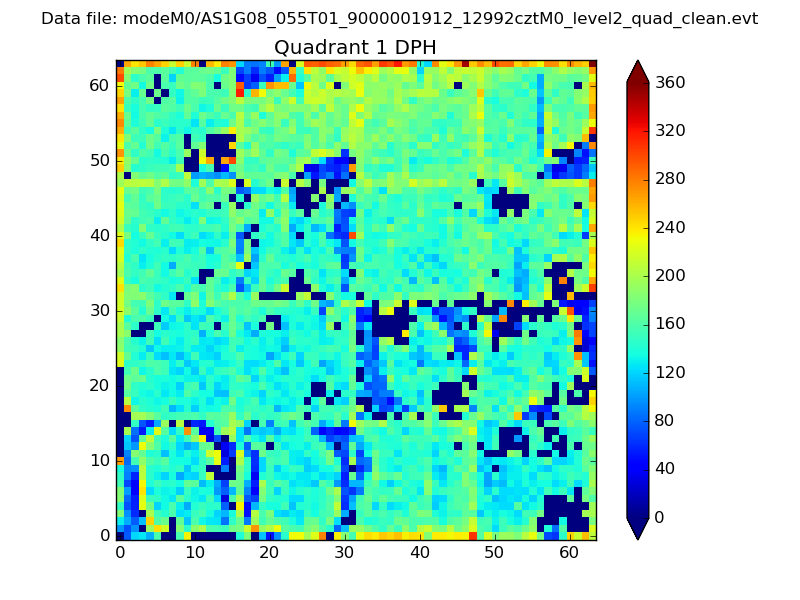 |
Quadrant B |
|---|---|---|---|
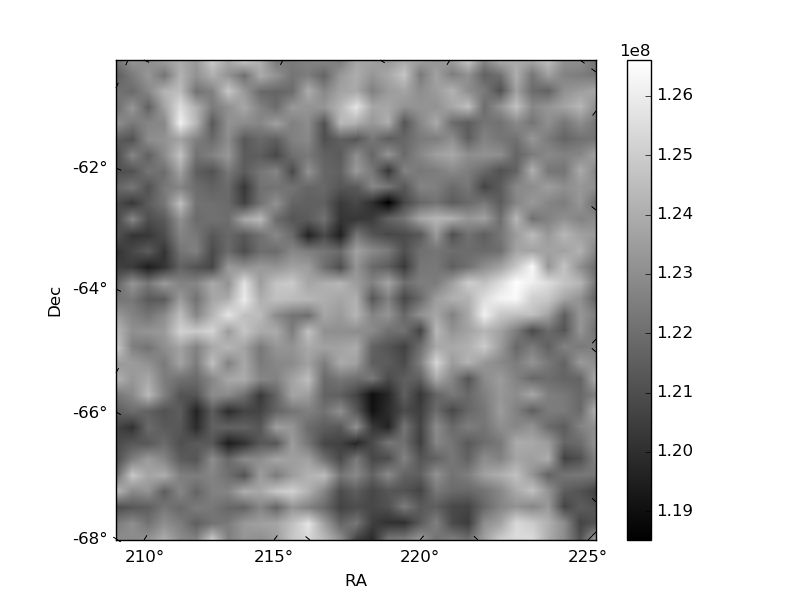
| Quadrant D | 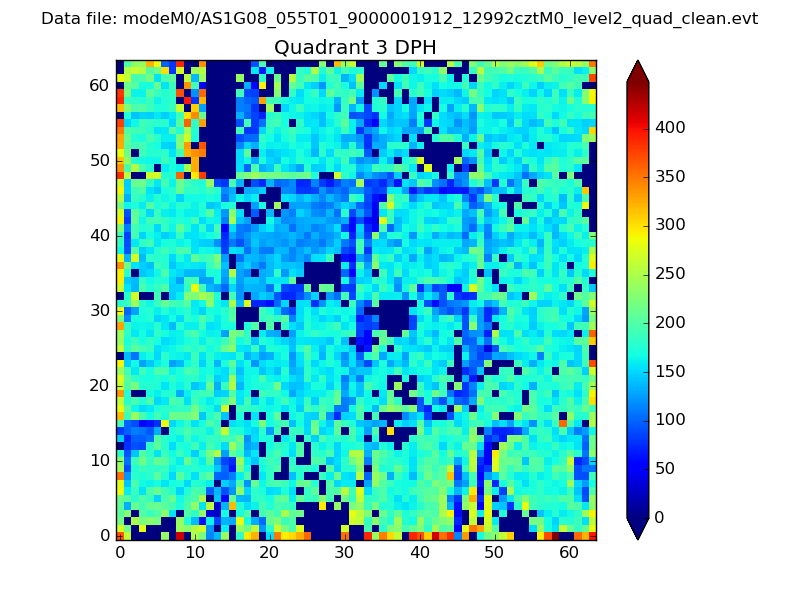 |
 |
Quadrant C |
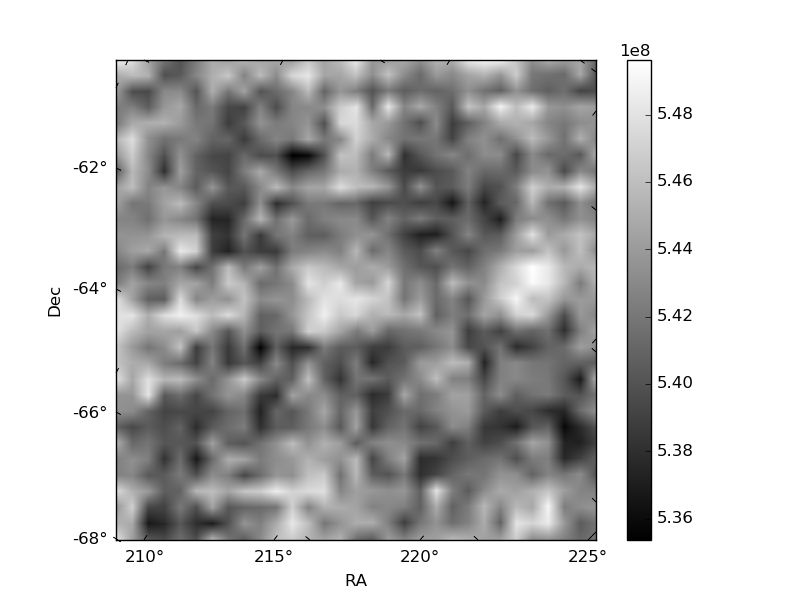
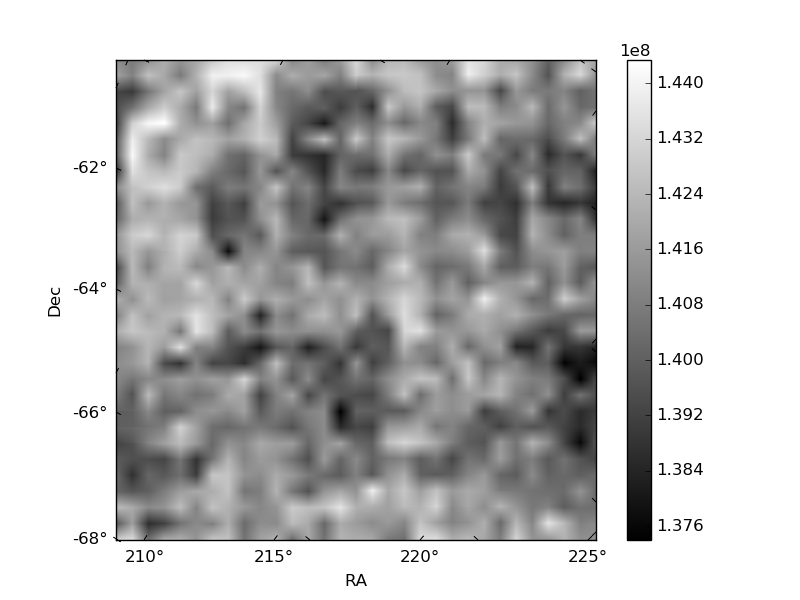
| Plot type | Count rate plots | Images |
|---|---|---|
| Comparison with Poisson distribution Blue bars denote a histogram of data divided into 1 sec bins. Red curve is a Poisson curve with rate = median count rate of data. |
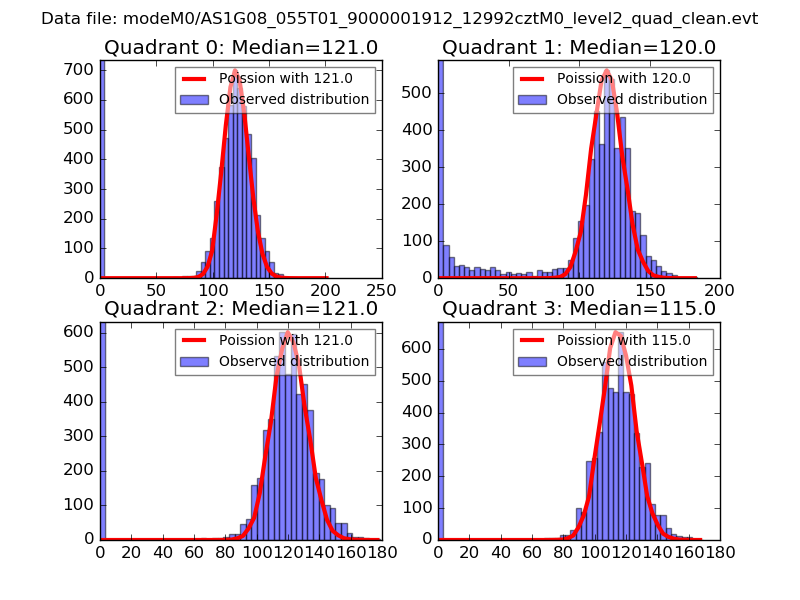 |
 |
| Quadrant-wise count rates Data is divided into 100 sec bins |
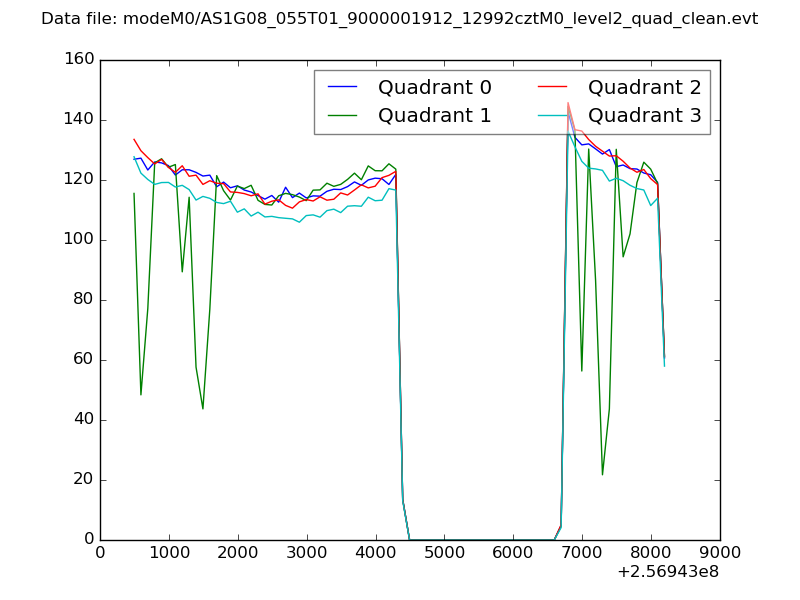 |
|
| Module-wise count rates for Quadrant A Data is divided into 100 sec bins |
 |
 |
| Module-wise count rates for Quadrant B Data is divided into 100 sec bins |
 |
 |
| Module-wise count rates for Quadrant C Data is divided into 100 sec bins |
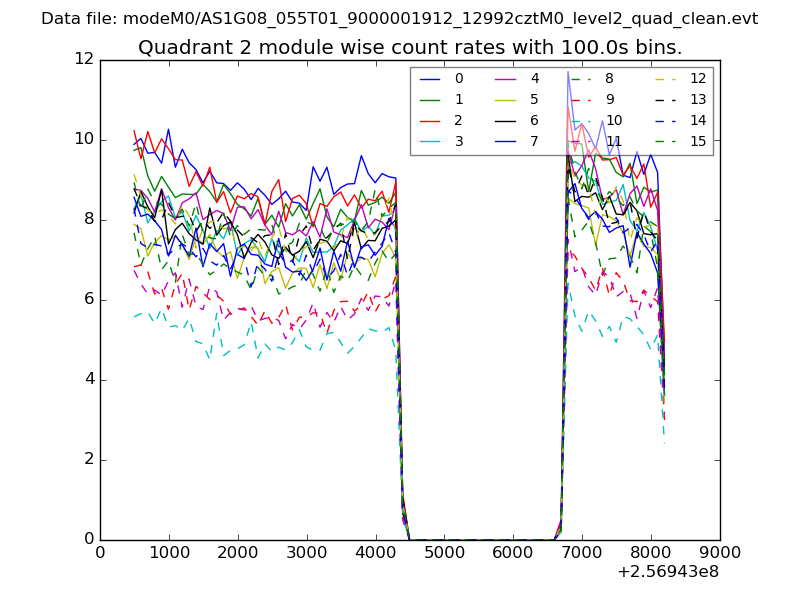 |
 |
| Module-wise count rates for Quadrant D Data is divided into 100 sec bins |
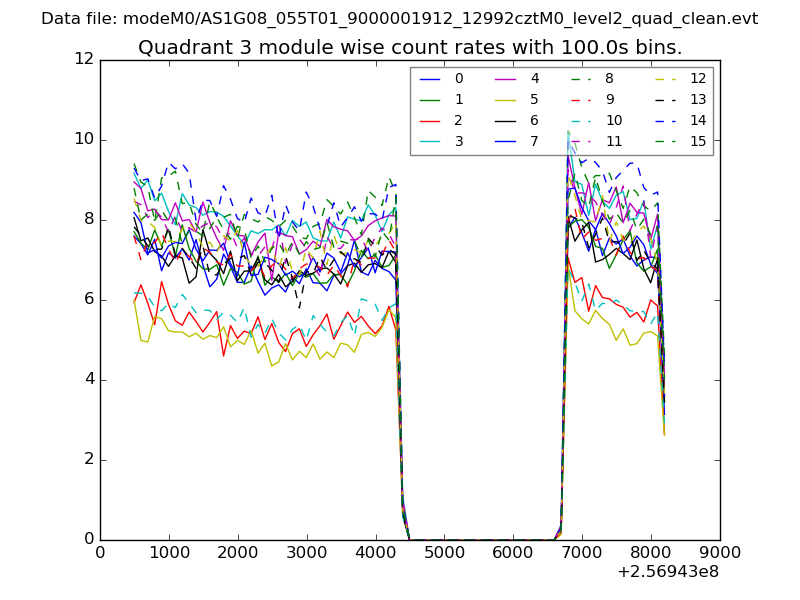 |
 |
| Parameter | Plot |
|---|---|
| CZT HV Monitor | 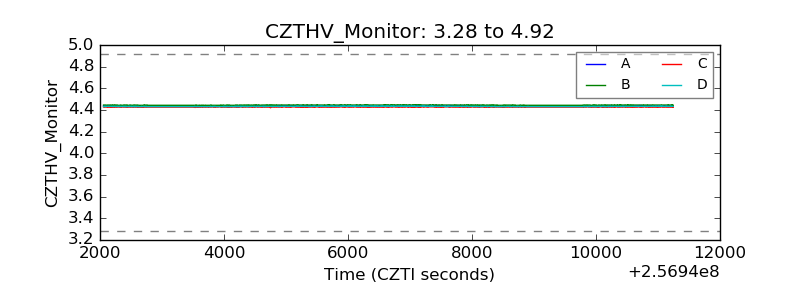 |
| D_VDD | 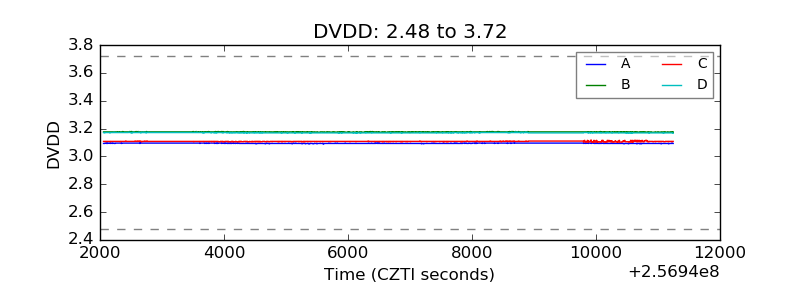 |
| Temperature 1 | 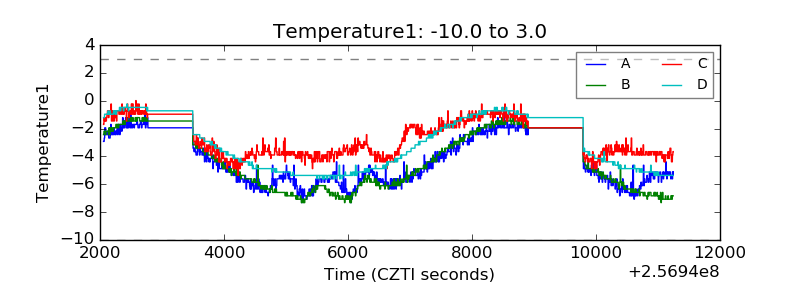 |
| Veto HV Monitor | 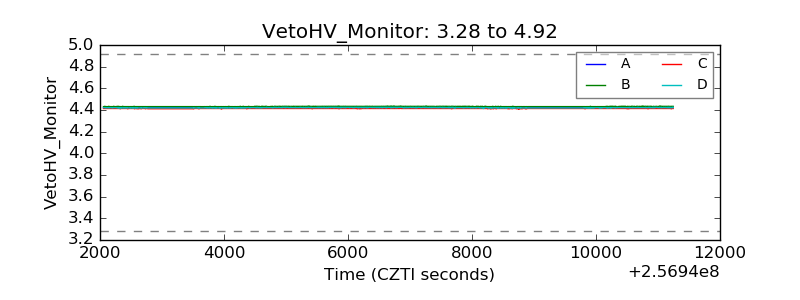 |
| Veto LLD | 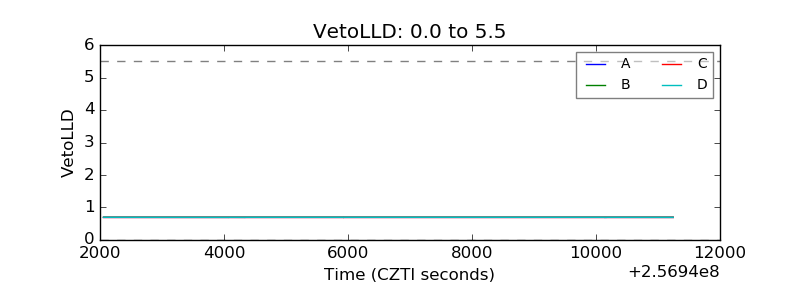 |
| Alpha Counter | 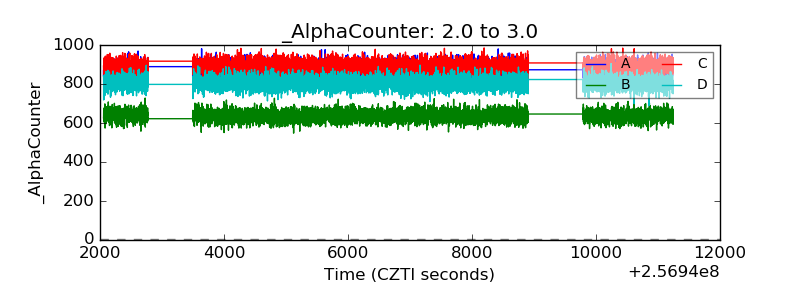 |
| _CPM_Rate | 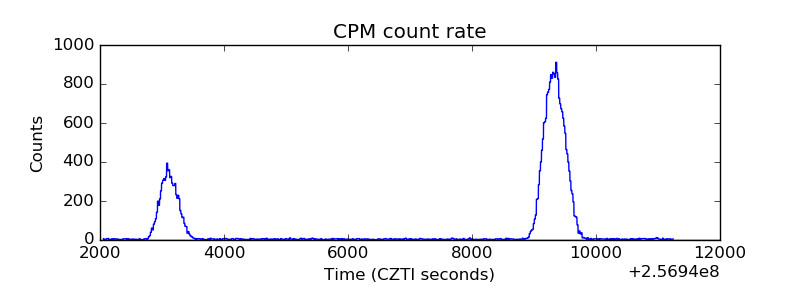 |
| CZT Counter | 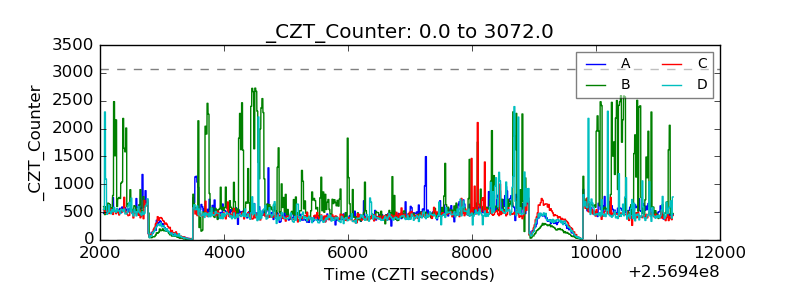 |
| +2.5 Volts monitor |  |
| +5 Volts monitor |  |
| _ROLL_ROT |  |
| _Roll_DEC | 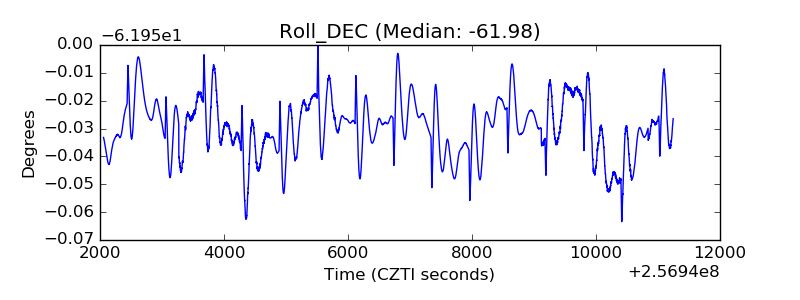 |
| _Roll_RA | 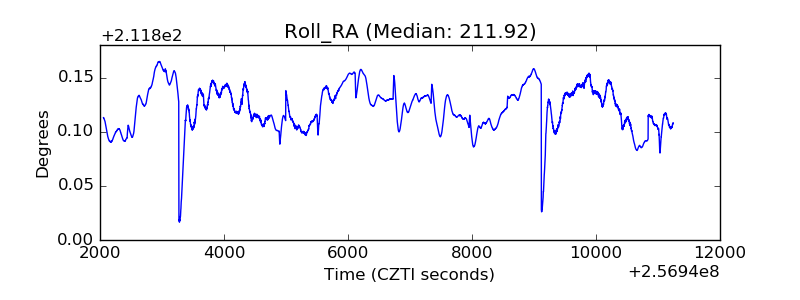 |
| Veto Counter |  |