| Param | Original file | Final file |
|---|---|---|
| Filename | modeM0/AS1G08_055T01_9000001912_12993cztM0_level2.evt | modeM0/AS1G08_055T01_9000001912_12993cztM0_level2_quad_clean.evt |
| Size (bytes) | 588,919,680 | 98,262,720 |
| Size | 561.6 MB | 93.7 MB |
| Events in quadrant A | 3,825,610 | 643,804 |
| Events in quadrant B | 6,460,077 | 568,395 |
| Events in quadrant C | 3,286,208 | 647,707 |
| Events in quadrant D | 3,773,142 | 612,360 |
| Mode M9 | |||
|---|---|---|---|
| Quadrant | BADHDUFLAG | Total packets | Discarded packets |
| A | 0 | 18 | 0 |
| B | 0 | 18 | 0 |
| C | 0 | 18 | 0 |
| D | 0 | 18 | 0 |
| Mode SS | |||
|---|---|---|---|
| Quadrant | BADHDUFLAG | Total packets | Discarded packets |
| A | 0 | 152 | 0 |
| B | 0 | 152 | 0 |
| C | 0 | 152 | 0 |
| D | 0 | 152 | 0 |
| Mode M0 | |||
|---|---|---|---|
| Quadrant | BADHDUFLAG | Total packets | Discarded packets |
| A | 0 | 15970 | 3 |
| B | 0 | 23958 | 2 |
| C | 0 | 14612 | 2 |
| D | 0 | 16345 | 2 |
| Quadrant | Total seconds | Saturated seconds | Saturation percentage |
|---|---|---|---|
| A | 7215 | 33 | 0.457380% |
| B | 7215 | 1317 | 18.253638% |
| C | 7215 | 10 | 0.138600% |
| D | 7215 | 126 | 1.746362% |
Noise dominated data is calculated using 1-second bins in cleaned event files. If a bin has >2000 counts, and if more than 50% of those come from <1% of pixels, then it is considered to be noise-dominated and hence unusable.
| Quadrant | # 1 sec bins | Bins with >0 counts | Bins with >2000 counts | High rate bins dominated by noise | Noise dominated (total time) | Noise dominated (detector-on time) | Marked lightcurve |
|---|---|---|---|---|---|---|---|
| A | 9141 | 7218 | 3 | 3 | 0.03% | 0.04% | 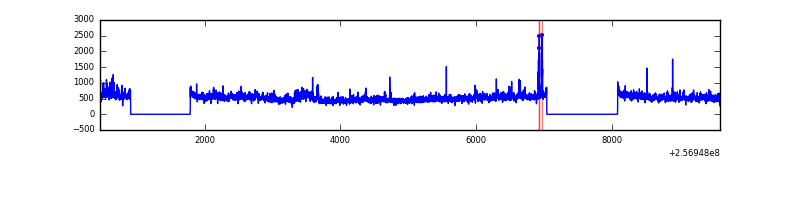 |
| B | 9141 | 7218 | 688 | 688 | 7.53% | 9.53% | 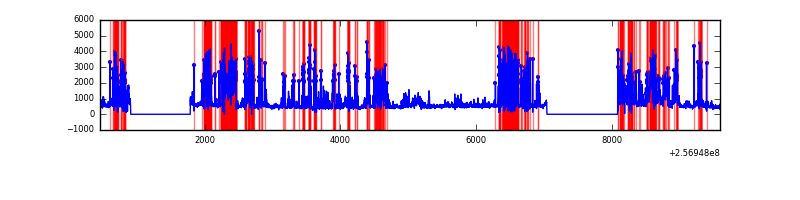 |
| C | 9141 | 7218 | 0 | 0 | 0.00% | 0.00% | 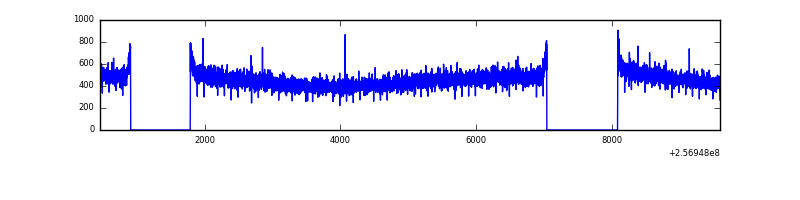 |
| D | 9141 | 7218 | 87 | 87 | 0.95% | 1.21% | 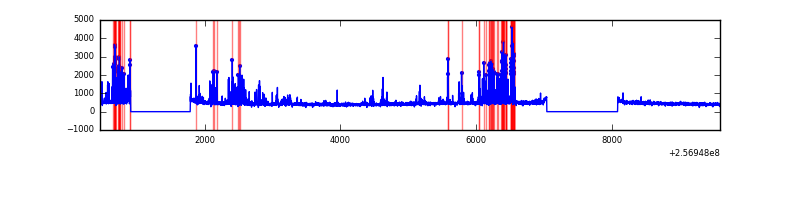 |
Top three noisy pixels from each quadrant. If the there are fewer than three noisy pixels in the level2.evt file, extra rows are filled as -1
| Pixel properties | Quadrant properties | ||||||
|---|---|---|---|---|---|---|---|
| Quadrant | DetID | PixID | Counts | Sigma | Mean | Median | Sigma |
| A | 12 | 189 | 314992 | 1820.57 | 854 | 836 | 172.6 |
| A | 15 | 222 | 87031 | 499.51 | 854 | 836 | 172.6 |
| A | 1 | 162 | 43649 | 248.11 | 854 | 836 | 172.6 |
| B | 4 | 239 | 2265201 | 15680.3 | 759 | 740 | 144.4 |
| B | 0 | 85 | 826317 | 5716.72 | 759 | 740 | 144.4 |
| B | 3 | 64 | 139299 | 959.45 | 759 | 740 | 144.4 |
| C | 13 | 61 | 6118 | 27.01 | 841 | 845 | 195.3 |
| C | 8 | 128 | 3730 | 14.78 | 841 | 845 | 195.3 |
| C | 8 | 112 | 2255 | 7.22 | 841 | 845 | 195.3 |
| D | 10 | 157 | 637904 | 3228.57 | 823 | 799 | 197.3 |
| D | 2 | 234 | 23918 | 117.16 | 823 | 799 | 197.3 |
| D | 8 | 195 | 13361 | 63.66 | 823 | 799 | 197.3 |
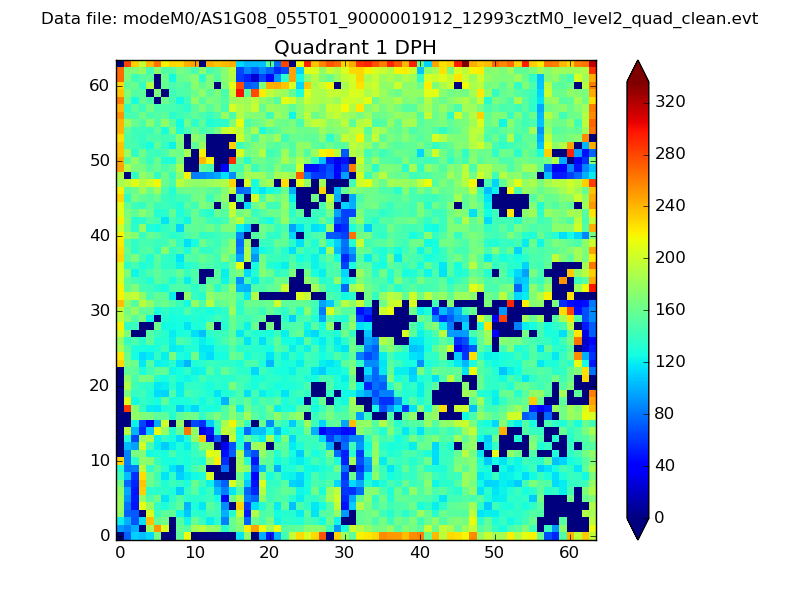
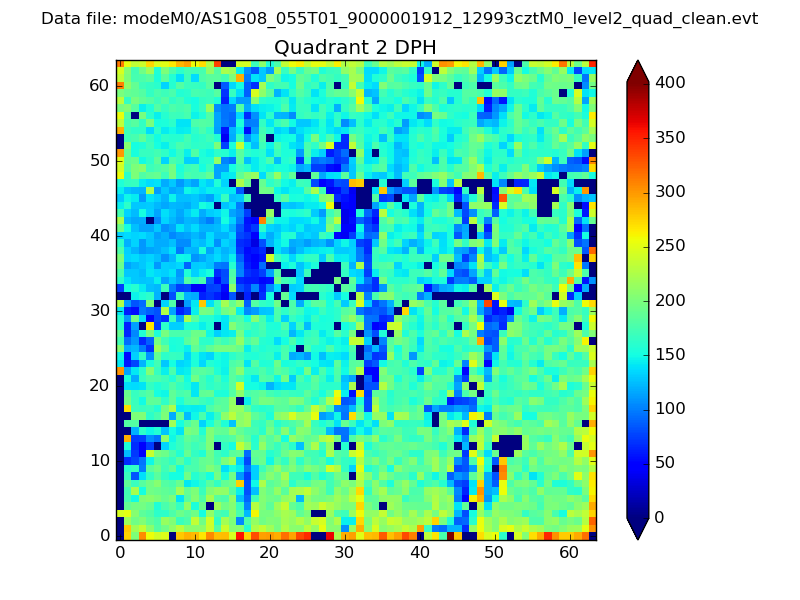
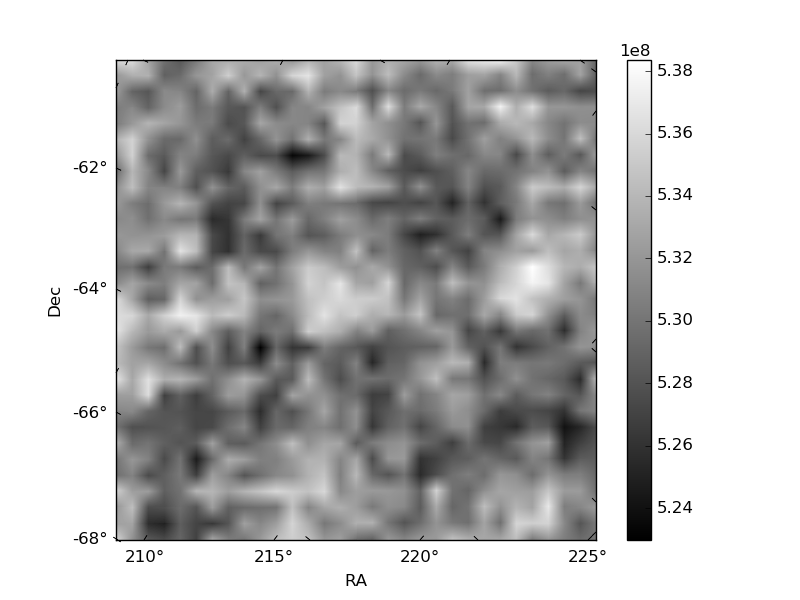
Histogram calculated using DETX and DETY for each event in the final _common_clean file
| Quadrant A |  |
 |
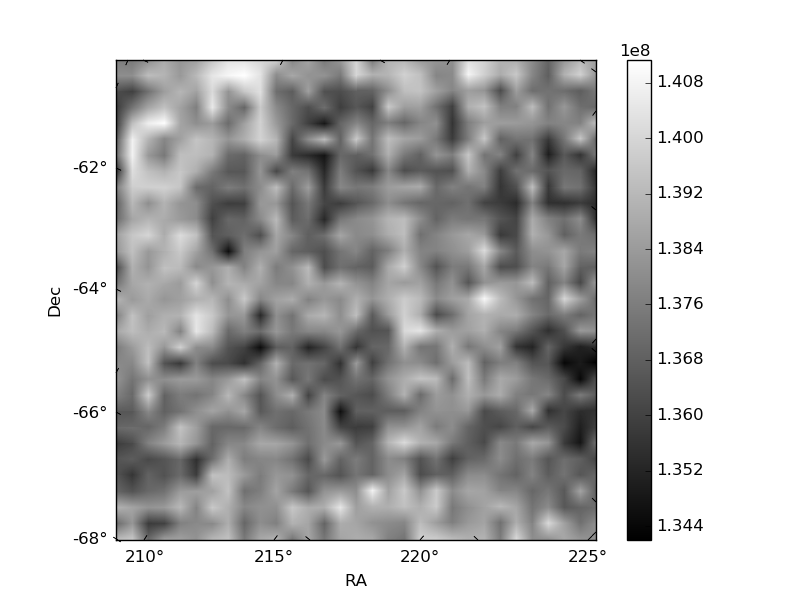
Quadrant B |
|---|---|---|---|
| Quadrant D | 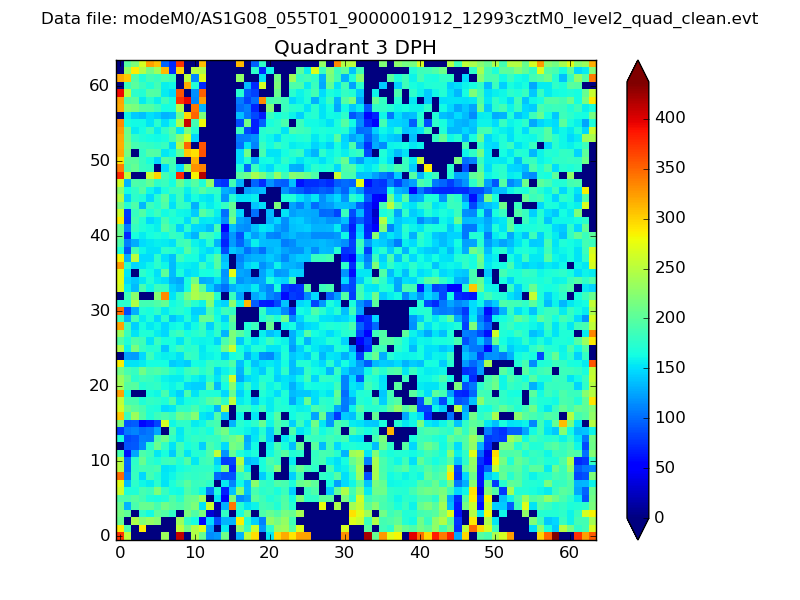 |
 |
Quadrant C |
| Plot type | Count rate plots | Images |
|---|---|---|
| Comparison with Poisson distribution Blue bars denote a histogram of data divided into 1 sec bins. Red curve is a Poisson curve with rate = median count rate of data. |
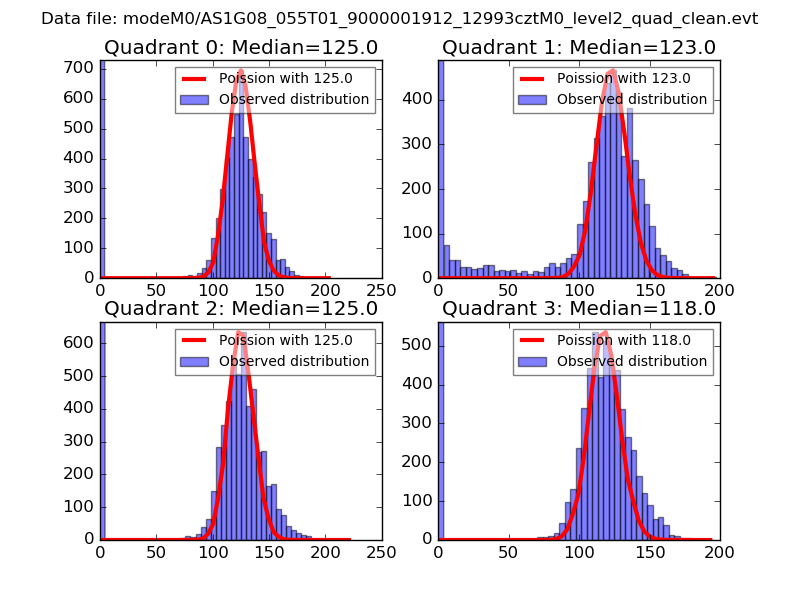 |
 |
| Quadrant-wise count rates Data is divided into 100 sec bins |
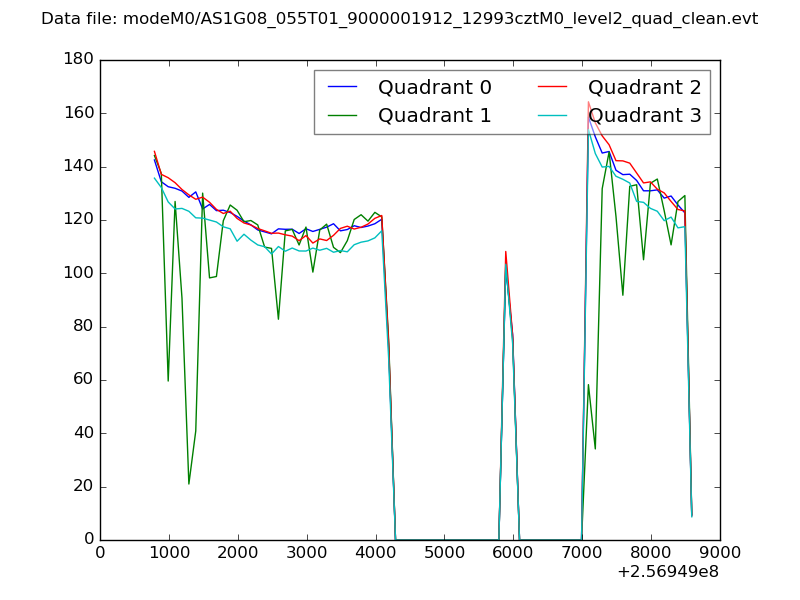 |
|
| Module-wise count rates for Quadrant A Data is divided into 100 sec bins |
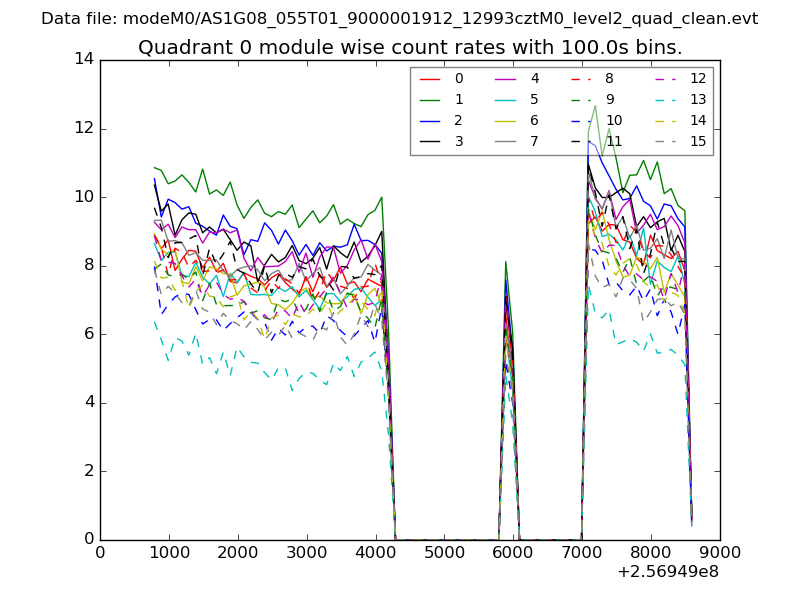 |
 |
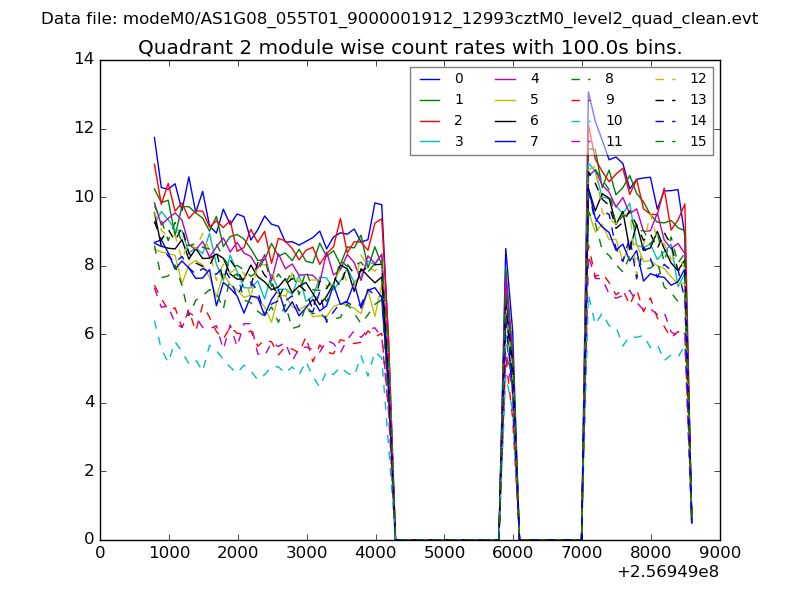
| Module-wise count rates for Quadrant B Data is divided into 100 sec bins |
 |
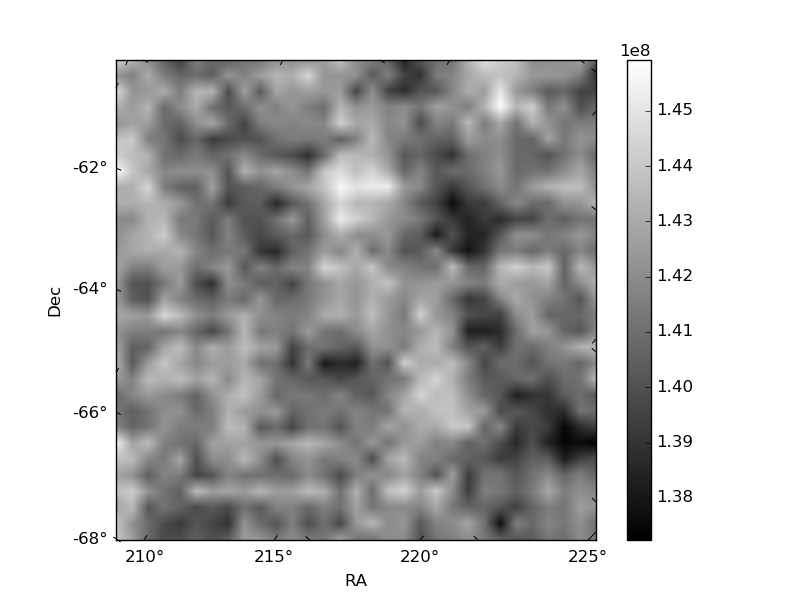 |
| Module-wise count rates for Quadrant C Data is divided into 100 sec bins |
 |
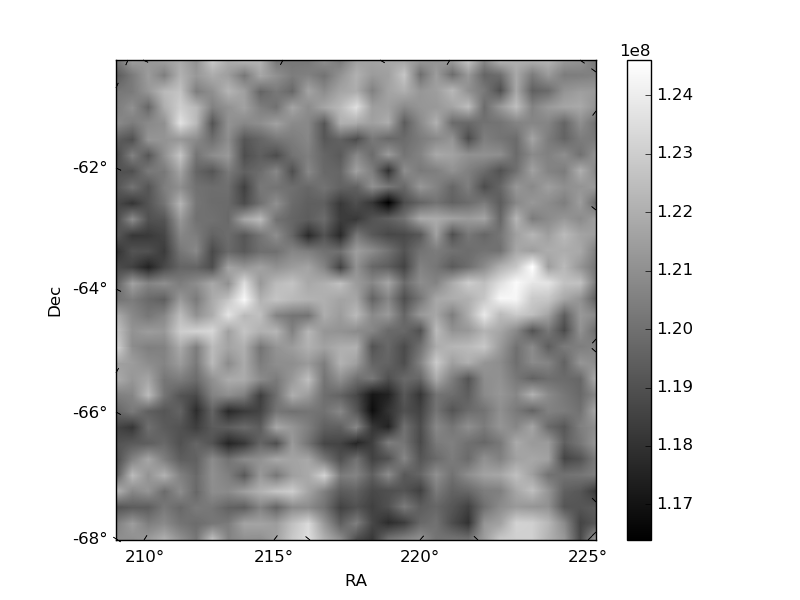 |
| Module-wise count rates for Quadrant D Data is divided into 100 sec bins |
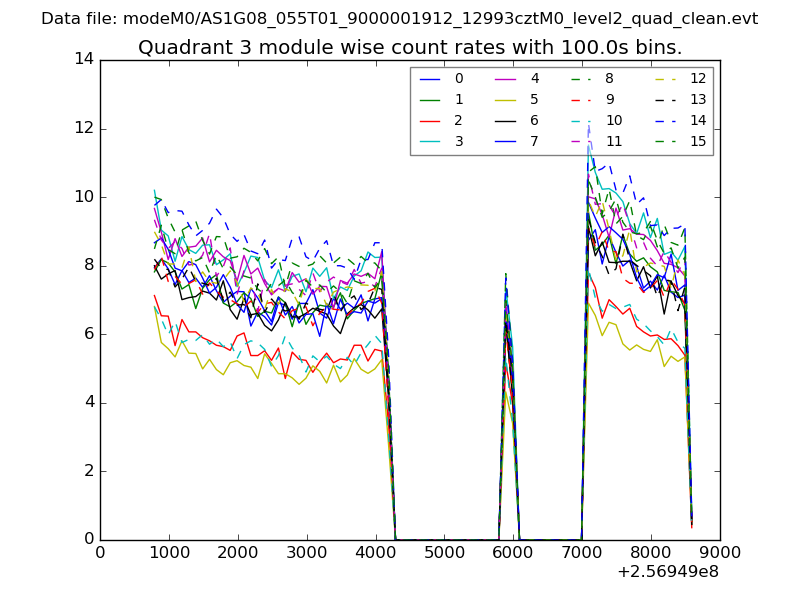 |
 |
| Parameter | Plot |
|---|---|
| CZT HV Monitor |  |
| D_VDD | 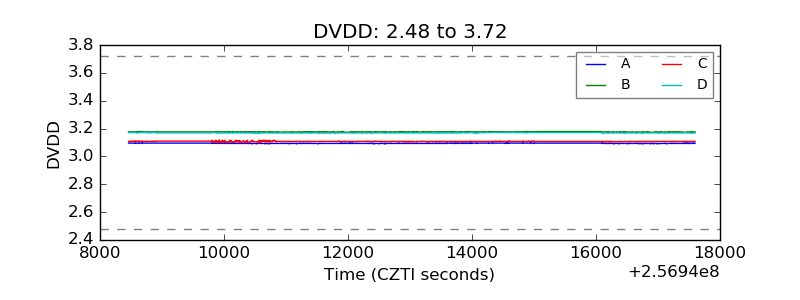 |
| Temperature 1 | 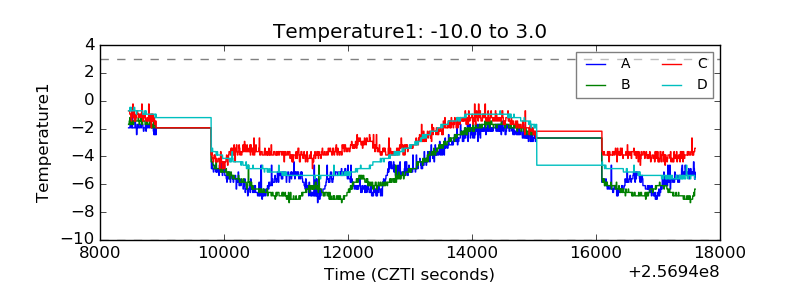 |
| Veto HV Monitor | 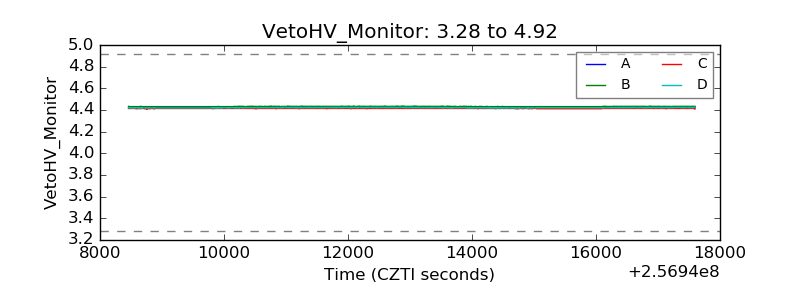 |
| Veto LLD | 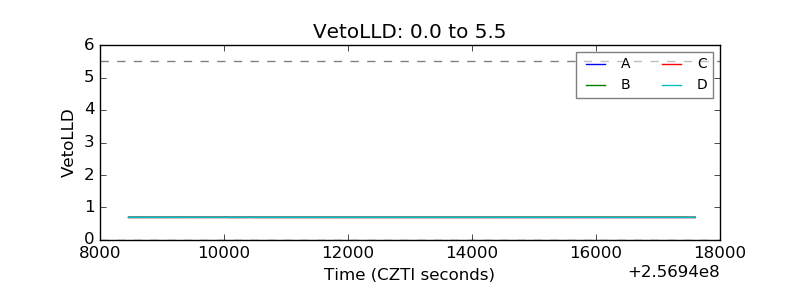 |
| Alpha Counter | 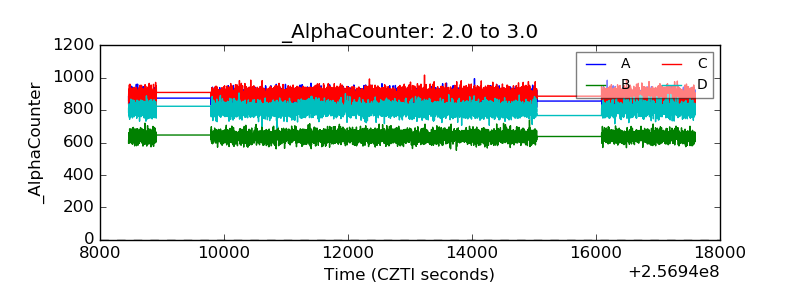 |
| _CPM_Rate | 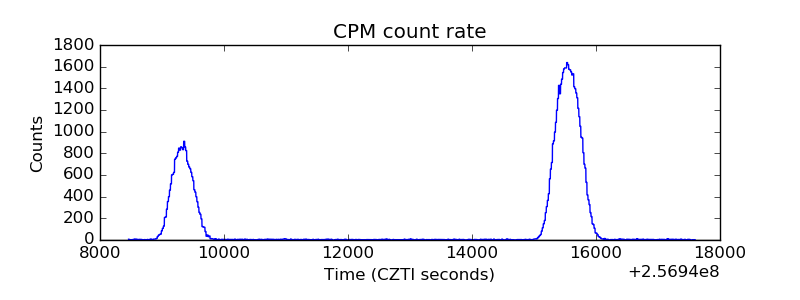 |
| CZT Counter | 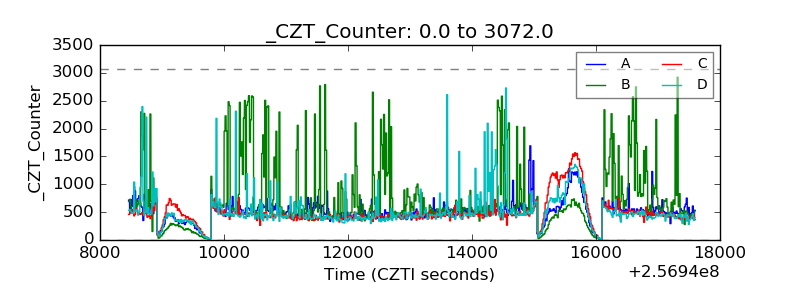 |
| +2.5 Volts monitor |  |
| +5 Volts monitor |  |
| _ROLL_ROT | 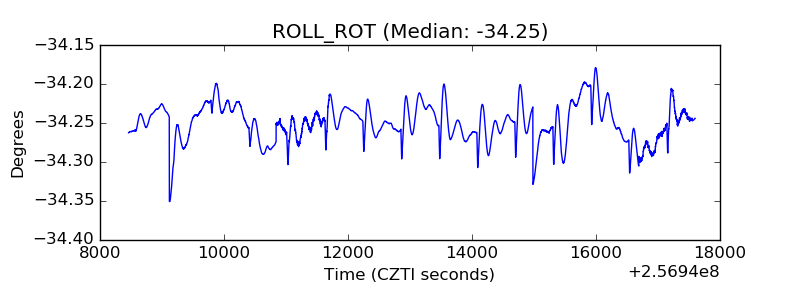 |
| _Roll_DEC | 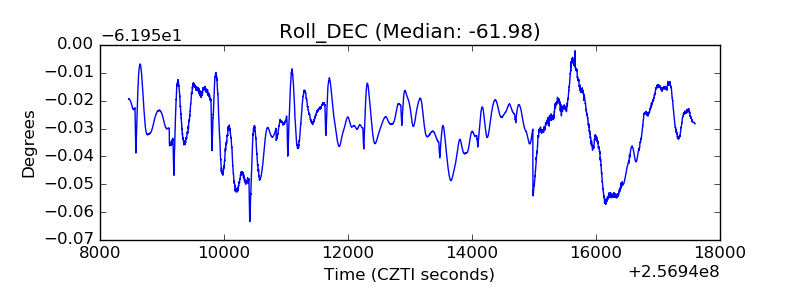 |
| _Roll_RA | 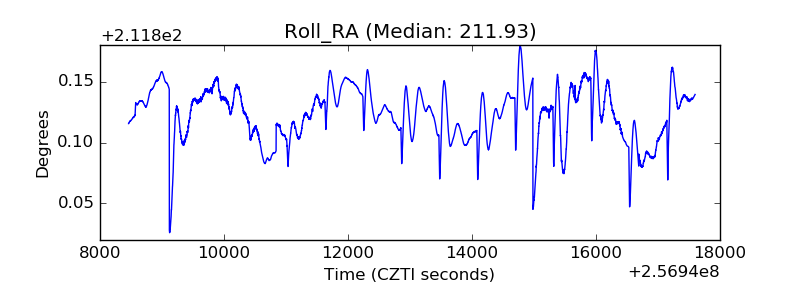 |
| Veto Counter | 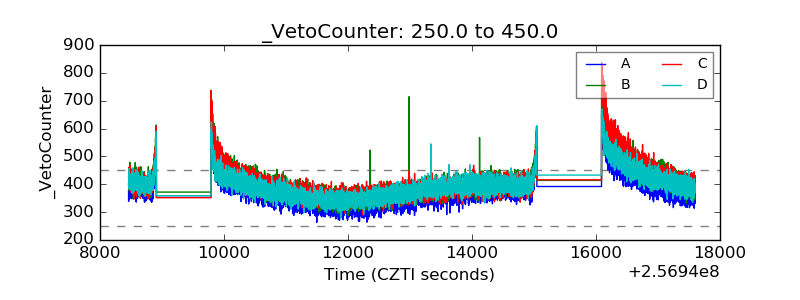 |