| Param | Original file | Final file |
|---|---|---|
| Filename | modeM0/AS1G08_055T01_9000001912_12995cztM0_level2.evt | modeM0/AS1G08_055T01_9000001912_12995cztM0_level2_quad_clean.evt |
| Size (bytes) | 2,512,658,880 | 470,655,360 |
| Size | 2.3 GB | 448.9 MB |
| Events in quadrant A | 17,026,661 | 3,060,425 |
| Events in quadrant B | 24,190,531 | 2,897,082 |
| Events in quadrant C | 15,357,797 | 3,053,087 |
| Events in quadrant D | 17,224,008 | 2,907,077 |
| Mode M9 | |||
|---|---|---|---|
| Quadrant | BADHDUFLAG | Total packets | Discarded packets |
| A | 0 | 45 | 0 |
| B | 0 | 45 | 0 |
| C | 0 | 45 | 0 |
| D | 0 | 45 | 0 |
| Mode SS | |||
|---|---|---|---|
| Quadrant | BADHDUFLAG | Total packets | Discarded packets |
| A | 0 | 694 | 0 |
| B | 0 | 694 | 0 |
| C | 0 | 694 | 0 |
| D | 0 | 694 | 0 |
| Mode M0 | |||
|---|---|---|---|
| Quadrant | BADHDUFLAG | Total packets | Discarded packets |
| A | 0 | 72589 | 6 |
| B | 0 | 94251 | 5 |
| C | 0 | 69262 | 5 |
| D | 0 | 75456 | 5 |
| Quadrant | Total seconds | Saturated seconds | Saturation percentage |
|---|---|---|---|
| A | 34008 | 178 | 0.523406% |
| B | 34008 | 3526 | 10.368149% |
| C | 34008 | 95 | 0.279346% |
| D | 34008 | 544 | 1.599624% |
Noise dominated data is calculated using 1-second bins in cleaned event files. If a bin has >2000 counts, and if more than 50% of those come from <1% of pixels, then it is considered to be noise-dominated and hence unusable.
| Quadrant | # 1 sec bins | Bins with >0 counts | Bins with >2000 counts | High rate bins dominated by noise | Noise dominated (total time) | Noise dominated (detector-on time) | Marked lightcurve |
|---|---|---|---|---|---|---|---|
| A | 38751 | 34016 | 13 | 13 | 0.03% | 0.04% | 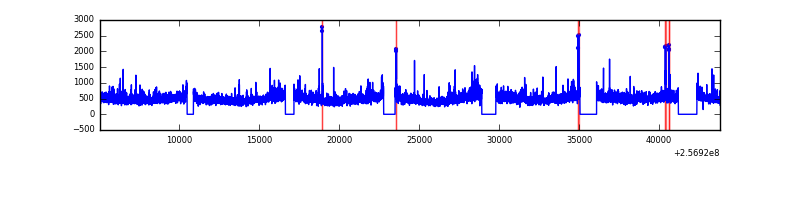 |
| B | 38751 | 34015 | 1711 | 1711 | 4.42% | 5.03% | 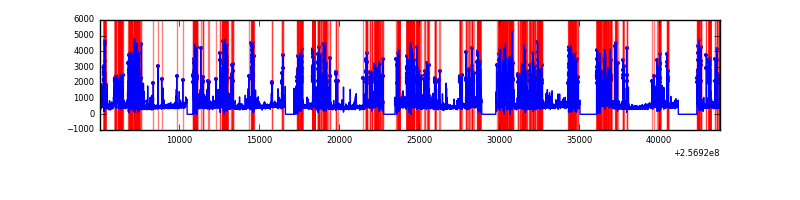 |
| C | 38751 | 34016 | 21 | 21 | 0.05% | 0.06% | 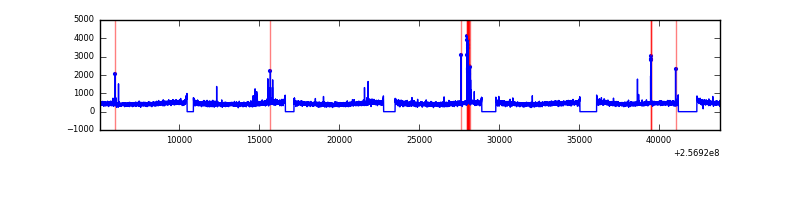 |
| D | 38751 | 34016 | 344 | 344 | 0.89% | 1.01% | 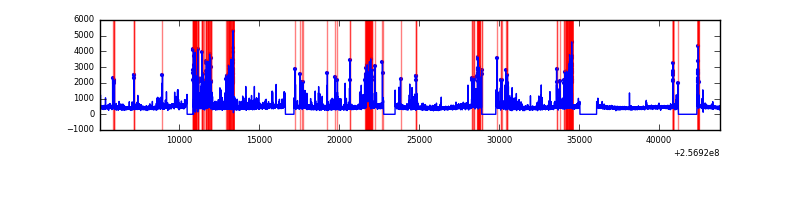 |
Top three noisy pixels from each quadrant. If the there are fewer than three noisy pixels in the level2.evt file, extra rows are filled as -1
| Pixel properties | Quadrant properties | ||||||
|---|---|---|---|---|---|---|---|
| Quadrant | DetID | PixID | Counts | Sigma | Mean | Median | Sigma |
| A | 12 | 189 | 935696 | 1175.18 | 3967 | 3883 | 792.9 |
| A | 1 | 162 | 210271 | 260.29 | 3967 | 3883 | 792.9 |
| A | 15 | 222 | 203938 | 252.3 | 3967 | 3883 | 792.9 |
| B | 4 | 239 | 5223554 | 7533.2 | 3723 | 3626 | 692.9 |
| B | 3 | 64 | 1714637 | 2469.26 | 3723 | 3626 | 692.9 |
| B | 0 | 85 | 1177263 | 1693.75 | 3723 | 3626 | 692.9 |
| C | 0 | 207 | 98288 | 105.55 | 3892 | 3910 | 894.2 |
| C | 14 | 234 | 59730 | 62.43 | 3892 | 3910 | 894.2 |
| C | 13 | 61 | 28247 | 27.22 | 3892 | 3910 | 894.2 |
| D | 1 | 52 | 1632385 | 1798.45 | 3827 | 3723 | 905.6 |
| D | 10 | 157 | 799379 | 878.6 | 3827 | 3723 | 905.6 |
| D | 8 | 195 | 154600 | 166.6 | 3827 | 3723 | 905.6 |
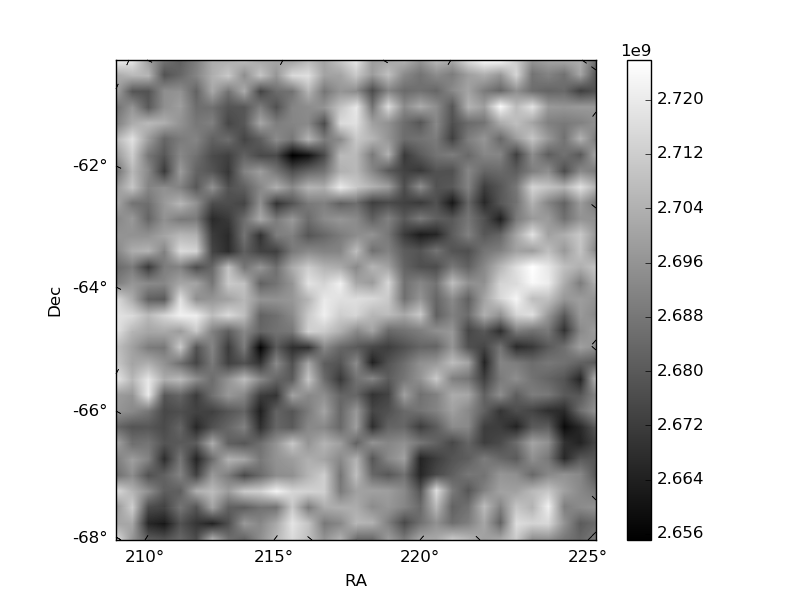
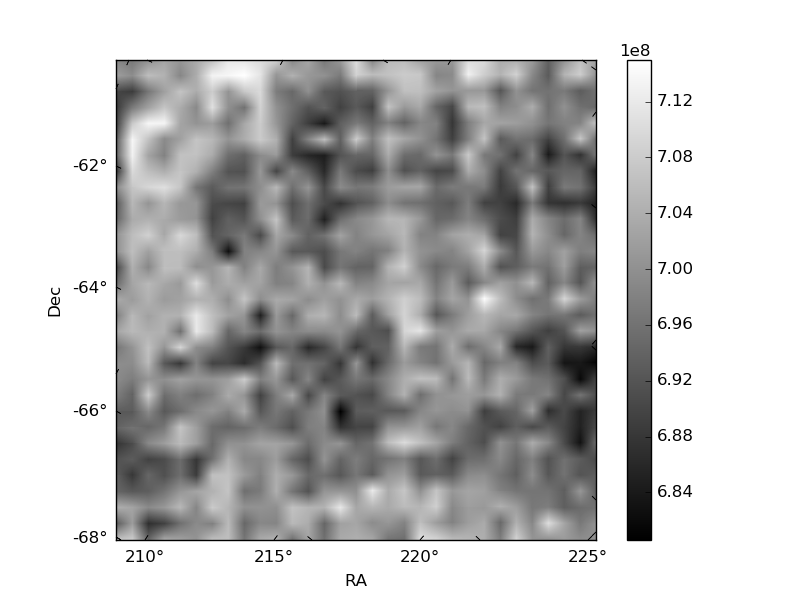
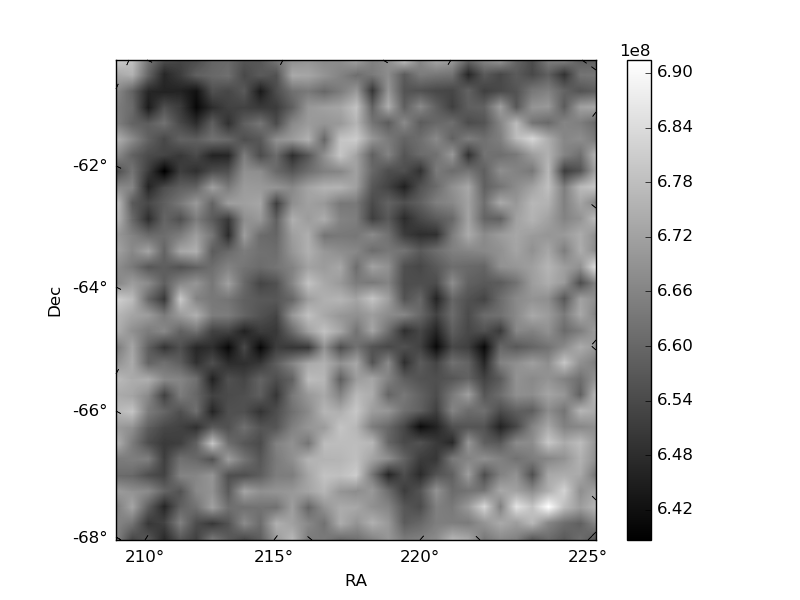
Histogram calculated using DETX and DETY for each event in the final _common_clean file
| Quadrant A | 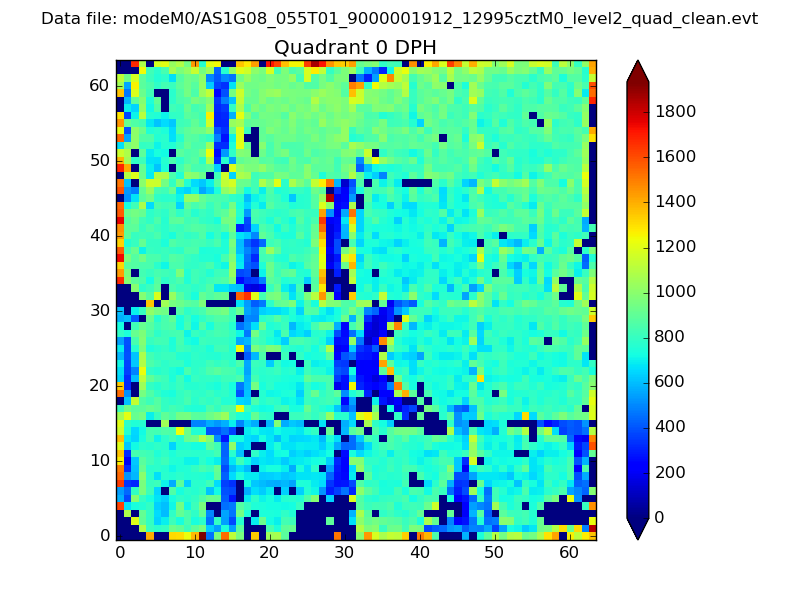 |
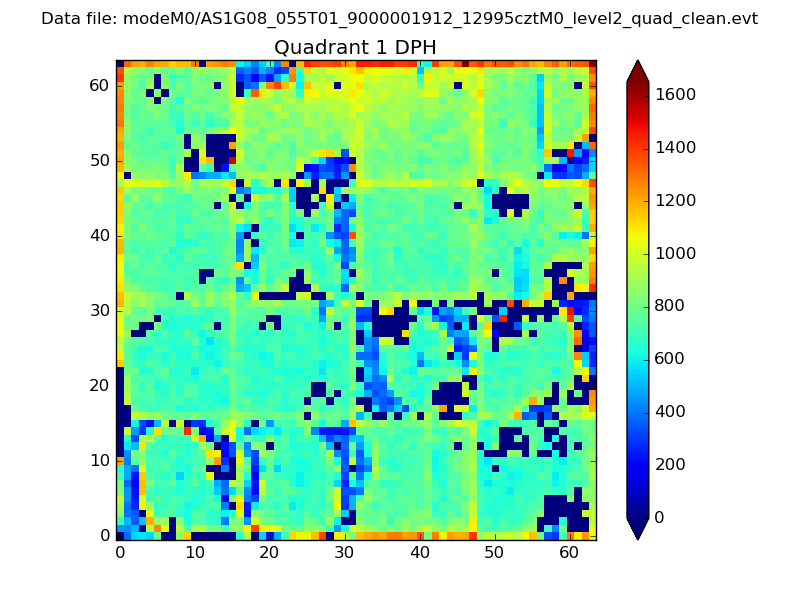 |
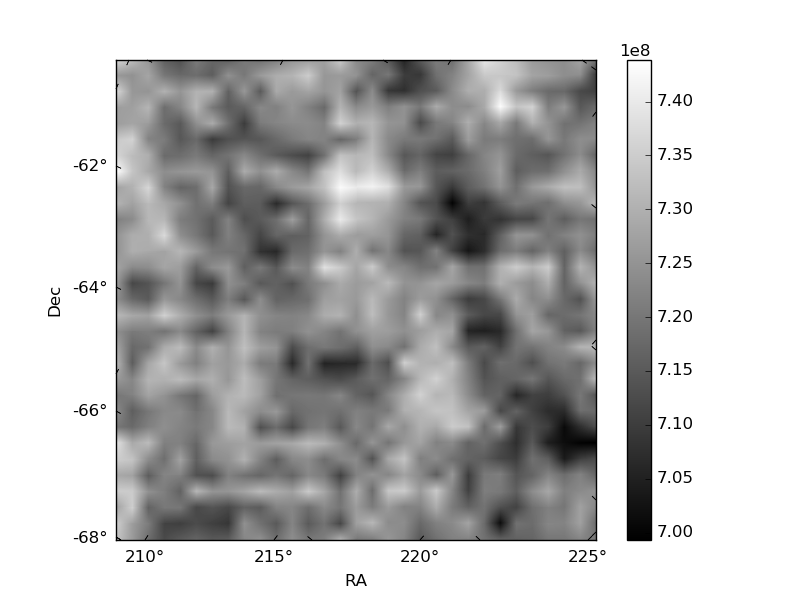
Quadrant B |
|---|---|---|---|
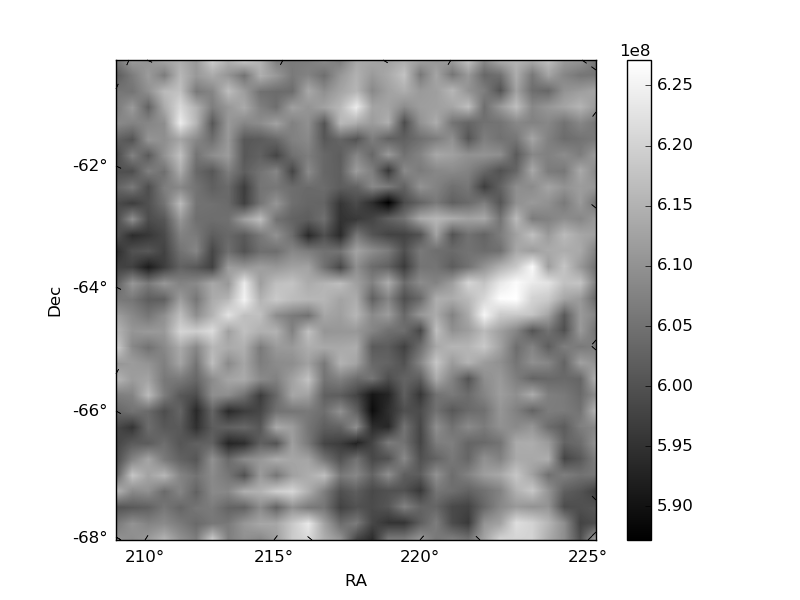
| Quadrant D | 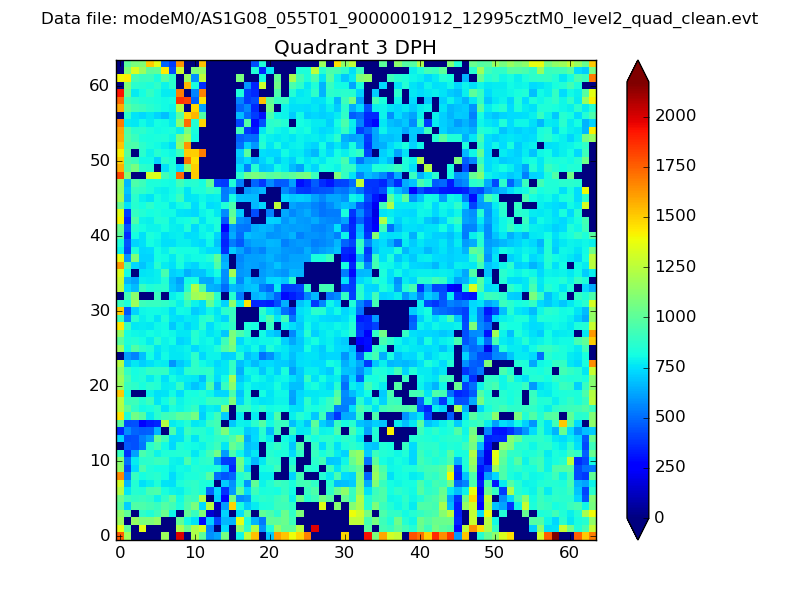 |
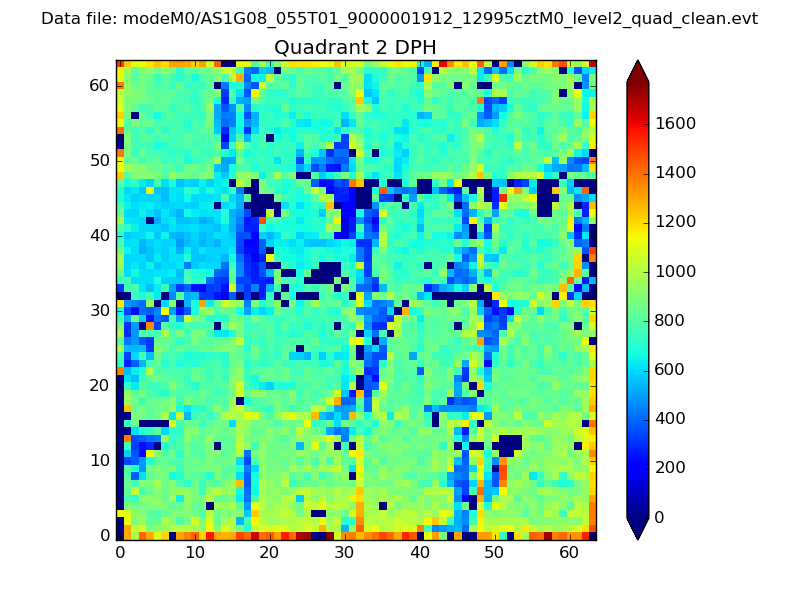 |
Quadrant C |
| Plot type | Count rate plots | Images |
|---|---|---|
| Comparison with Poisson distribution Blue bars denote a histogram of data divided into 1 sec bins. Red curve is a Poisson curve with rate = median count rate of data. |
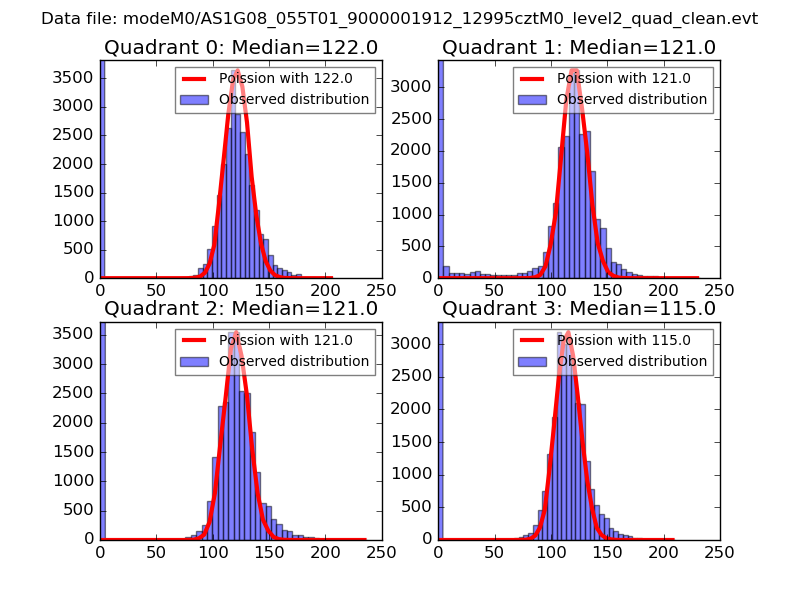 |
 |
| Quadrant-wise count rates Data is divided into 100 sec bins |
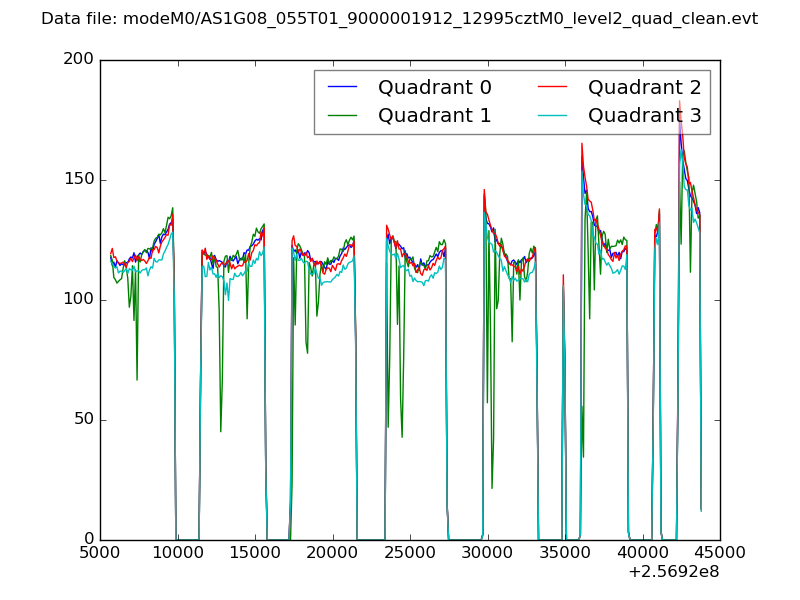 |
|
| Module-wise count rates for Quadrant A Data is divided into 100 sec bins |
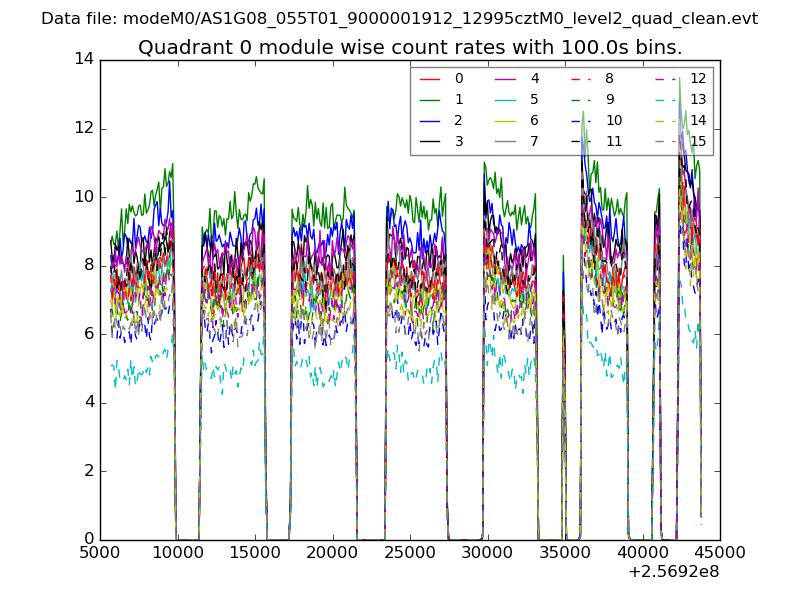 |
 |
| Module-wise count rates for Quadrant B Data is divided into 100 sec bins |
 |
 |
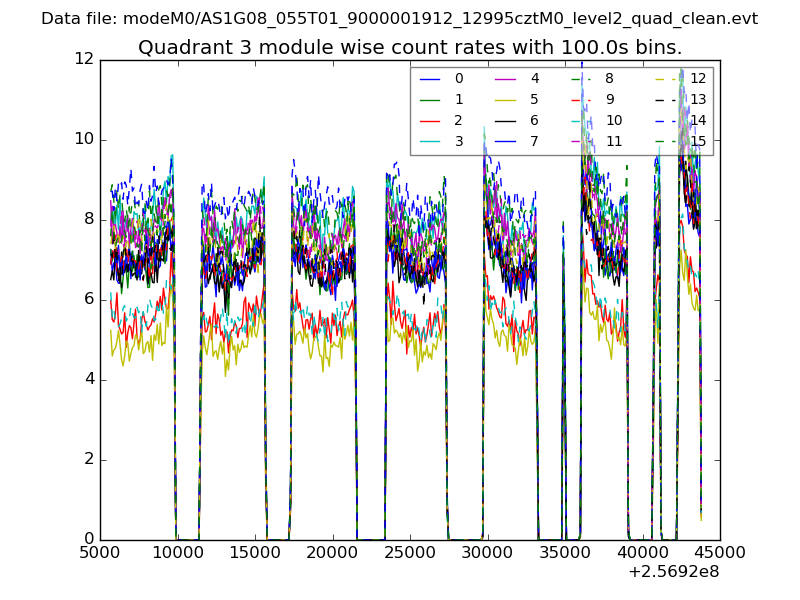
| Module-wise count rates for Quadrant C Data is divided into 100 sec bins |
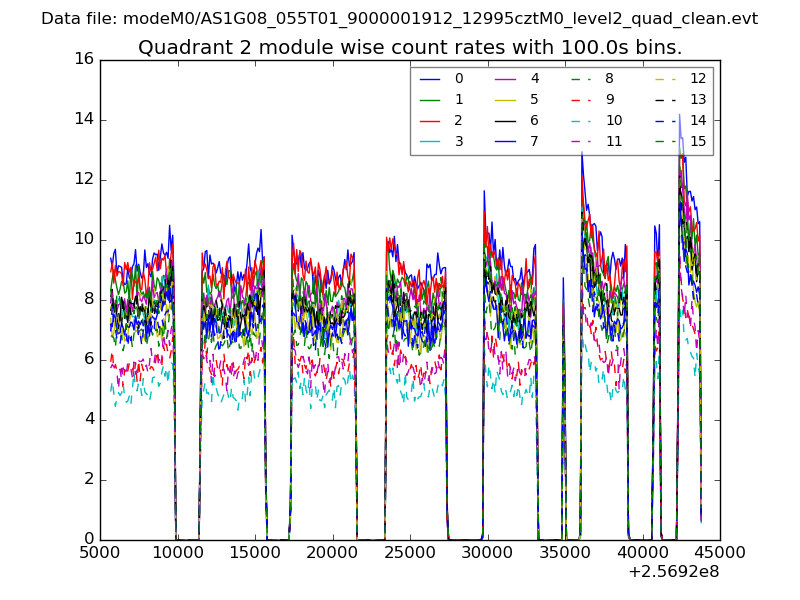 |
 |
| Module-wise count rates for Quadrant D Data is divided into 100 sec bins |
 |
 |
| Parameter | Plot |
|---|---|
| CZT HV Monitor | 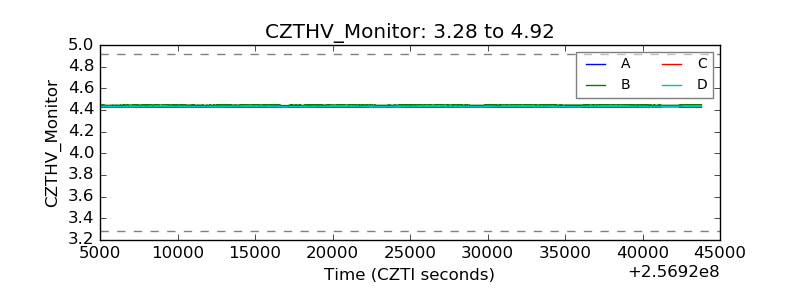 |
| D_VDD | 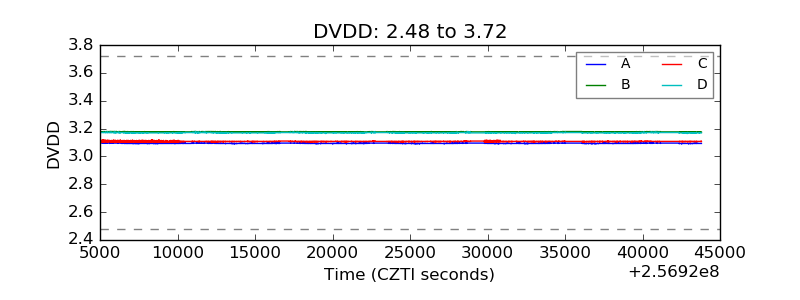 |
| Temperature 1 | 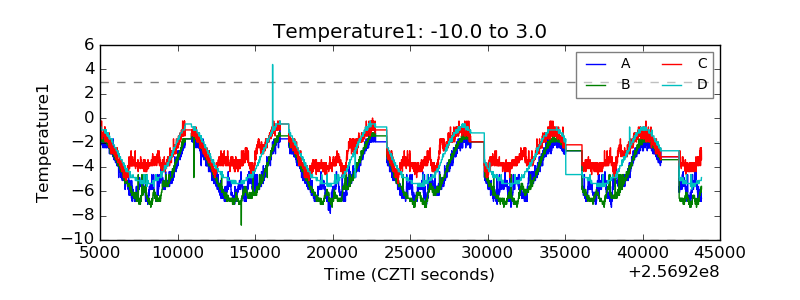 |
| Veto HV Monitor | 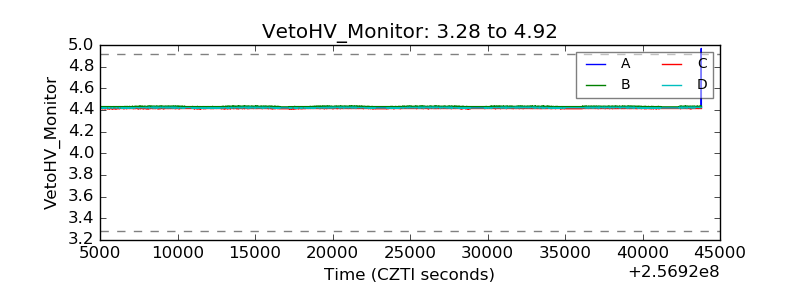 |
| Veto LLD | 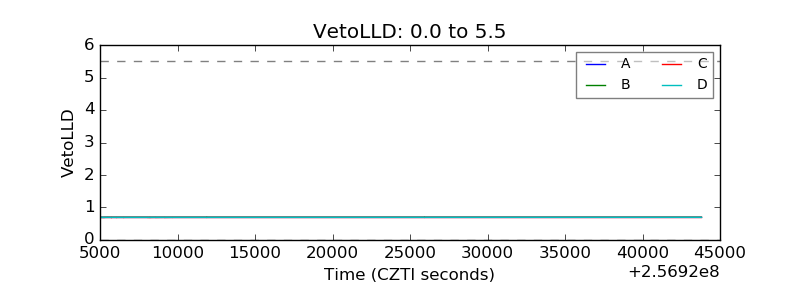 |
| Alpha Counter | 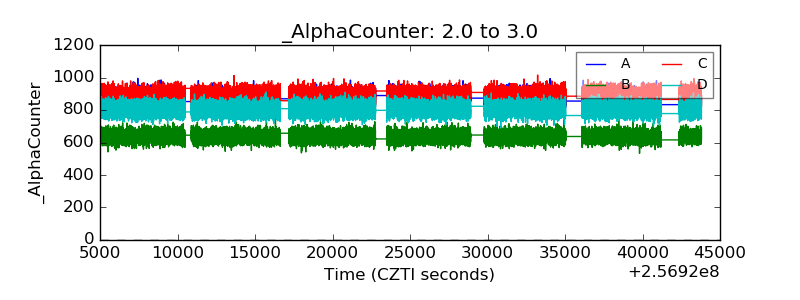 |
| _CPM_Rate | 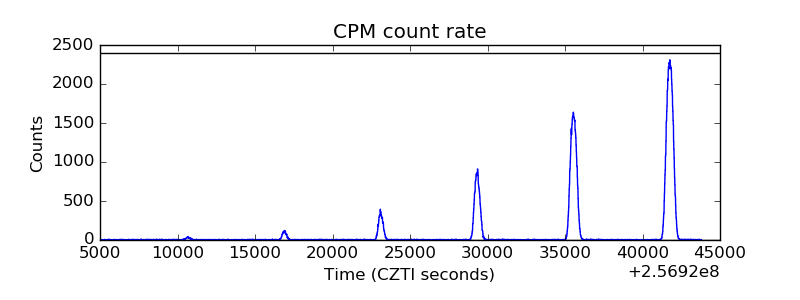 |
| CZT Counter | 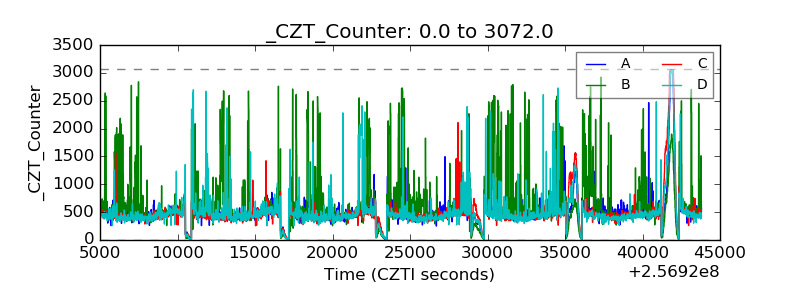 |
| +2.5 Volts monitor | 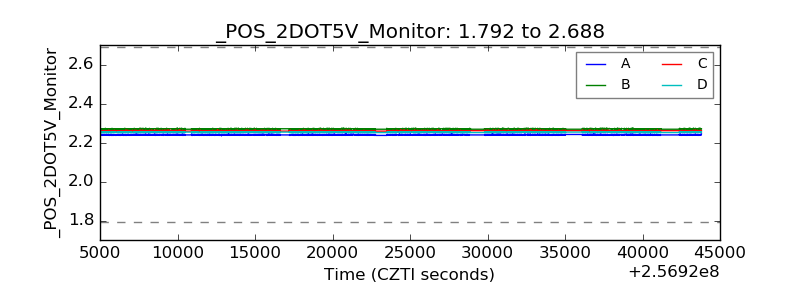 |
| +5 Volts monitor |  |
| _ROLL_ROT | 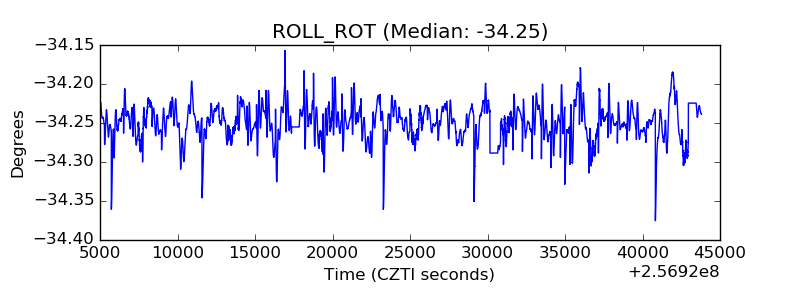 |
| _Roll_DEC | 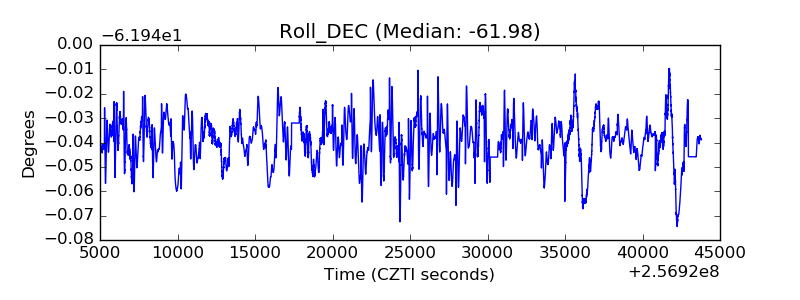 |
| _Roll_RA | 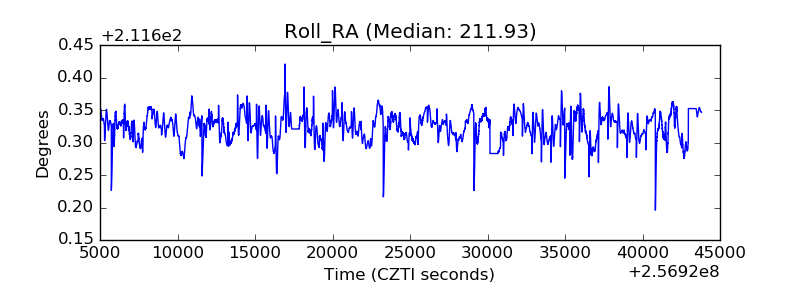 |
| Veto Counter | 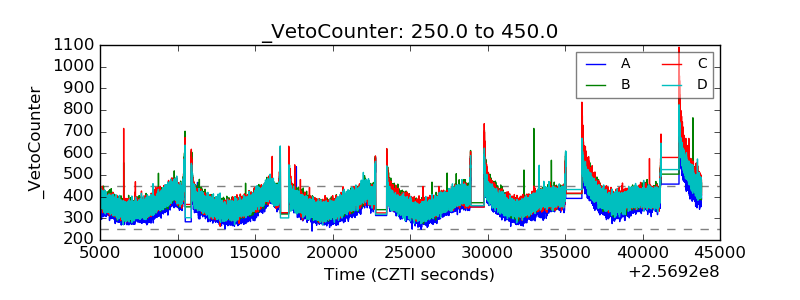 |