| Param | Original file | Final file |
|---|---|---|
| Filename | modeM0/AS1G08_055T01_9000001912_12996cztM0_level2.evt | modeM0/AS1G08_055T01_9000001912_12996cztM0_level2_quad_clean.evt |
| Size (bytes) | 476,593,920 | 103,374,720 |
| Size | 454.5 MB | 98.6 MB |
| Events in quadrant A | 3,289,579 | 676,352 |
| Events in quadrant B | 4,424,351 | 665,852 |
| Events in quadrant C | 3,122,025 | 693,850 |
| Events in quadrant D | 3,166,738 | 651,938 |
| Mode M9 | |||
|---|---|---|---|
| Quadrant | BADHDUFLAG | Total packets | Discarded packets |
| A | 0 | 15 | 0 |
| B | 0 | 15 | 0 |
| C | 0 | 15 | 0 |
| D | 0 | 16 | 0 |
| Mode SS | |||
|---|---|---|---|
| Quadrant | BADHDUFLAG | Total packets | Discarded packets |
| A | 0 | 128 | 0 |
| B | 0 | 128 | 0 |
| C | 0 | 128 | 0 |
| D | 0 | 128 | 0 |
| Mode M0 | |||
|---|---|---|---|
| Quadrant | BADHDUFLAG | Total packets | Discarded packets |
| A | 0 | 13606 | 3 |
| B | 0 | 17249 | 2 |
| C | 0 | 13260 | 2 |
| D | 0 | 13567 | 2 |
| Quadrant | Total seconds | Saturated seconds | Saturation percentage |
|---|---|---|---|
| A | 6346 | 23 | 0.362433% |
| B | 6346 | 506 | 7.973527% |
| C | 6346 | 39 | 0.614560% |
| D | 6346 | 42 | 0.661834% |
Noise dominated data is calculated using 1-second bins in cleaned event files. If a bin has >2000 counts, and if more than 50% of those come from <1% of pixels, then it is considered to be noise-dominated and hence unusable.
| Quadrant | # 1 sec bins | Bins with >0 counts | Bins with >2000 counts | High rate bins dominated by noise | Noise dominated (total time) | Noise dominated (detector-on time) | Marked lightcurve |
|---|---|---|---|---|---|---|---|
| A | 7588 | 6349 | 0 | 0 | 0.00% | 0.00% | 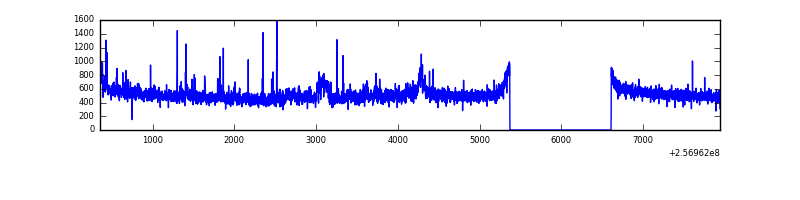 |
| B | 7588 | 6349 | 256 | 256 | 3.37% | 4.03% | 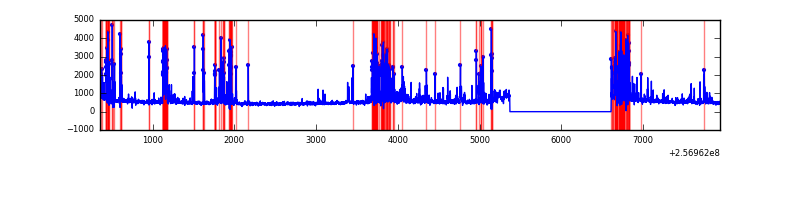 |
| C | 7588 | 6349 | 0 | 0 | 0.00% | 0.00% | 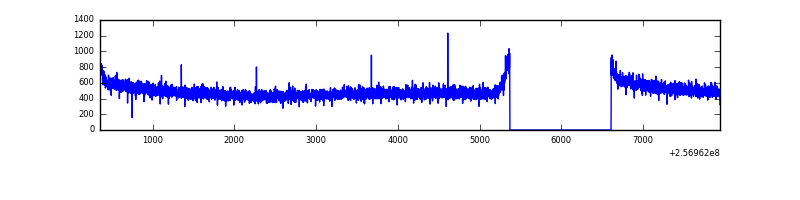 |
| D | 7588 | 6349 | 13 | 13 | 0.17% | 0.20% | 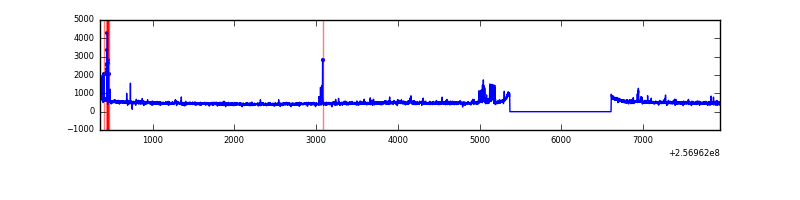 |
Top three noisy pixels from each quadrant. If the there are fewer than three noisy pixels in the level2.evt file, extra rows are filled as -1
| Pixel properties | Quadrant properties | ||||||
|---|---|---|---|---|---|---|---|
| Quadrant | DetID | PixID | Counts | Sigma | Mean | Median | Sigma |
| A | 12 | 189 | 142631 | 889.56 | 796 | 781 | 159.5 |
| A | 8 | 15 | 30469 | 186.18 | 796 | 781 | 159.5 |
| A | 1 | 162 | 16976 | 101.56 | 796 | 781 | 159.5 |
| B | 4 | 239 | 857738 | 6086.83 | 773 | 754 | 140.8 |
| B | 10 | 245 | 341326 | 2418.95 | 773 | 754 | 140.8 |
| B | 0 | 219 | 56268 | 394.29 | 773 | 754 | 140.8 |
| C | 13 | 61 | 5853 | 27.69 | 800 | 805 | 182.3 |
| C | 14 | 234 | 2593 | 9.81 | 800 | 805 | 182.3 |
| C | 3 | 202 | 2033 | 6.74 | 800 | 805 | 182.3 |
| D | 8 | 195 | 92633 | 496.15 | 782 | 759 | 185.2 |
| D | 13 | 122 | 58218 | 310.3 | 782 | 759 | 185.2 |
| D | 1 | 52 | 28767 | 151.25 | 782 | 759 | 185.2 |
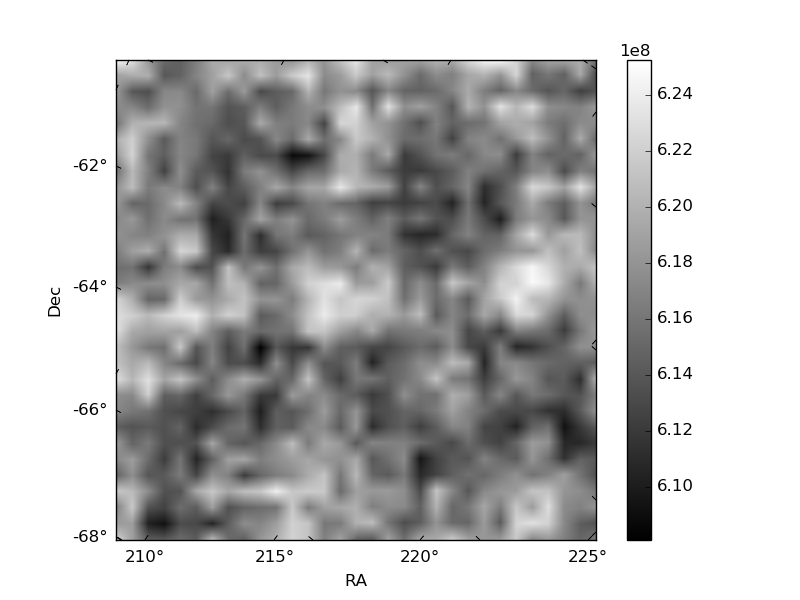
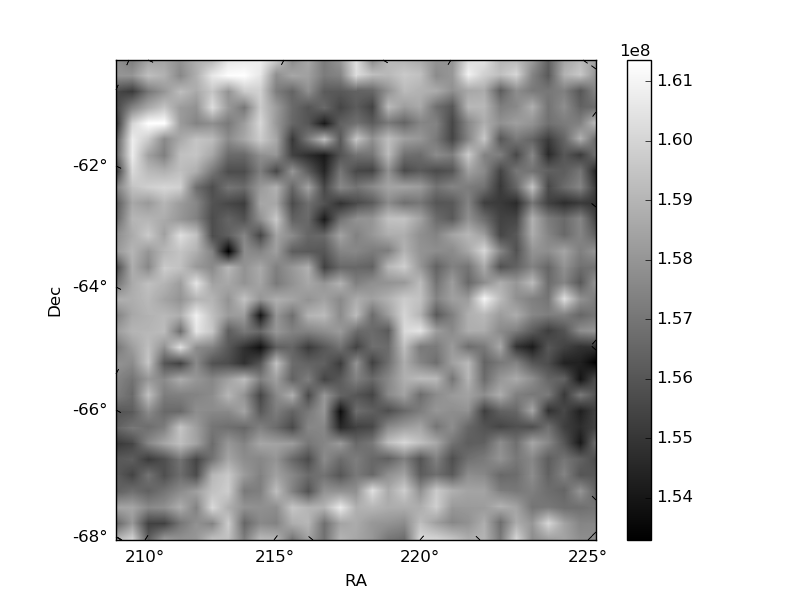
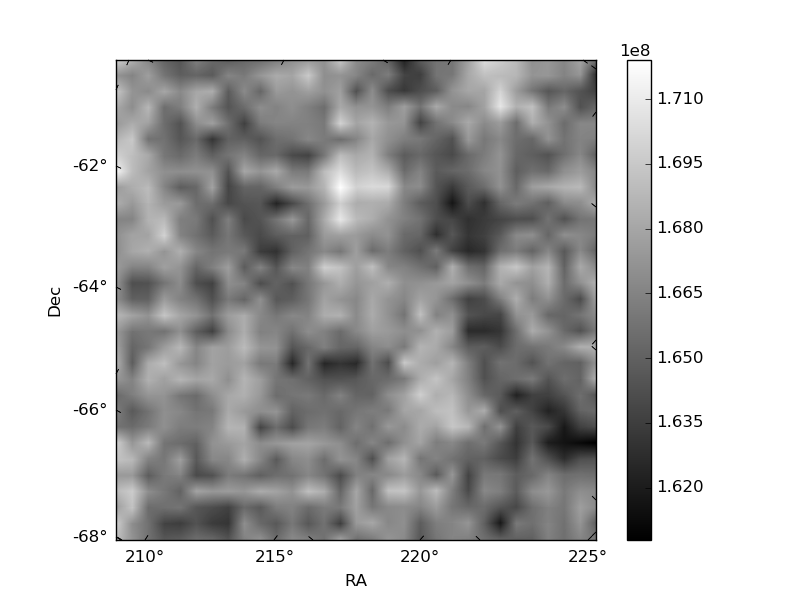
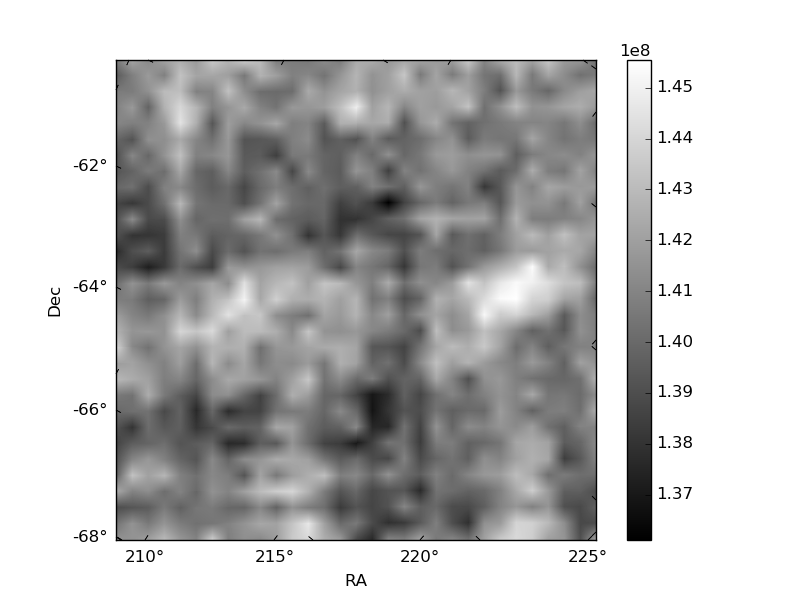
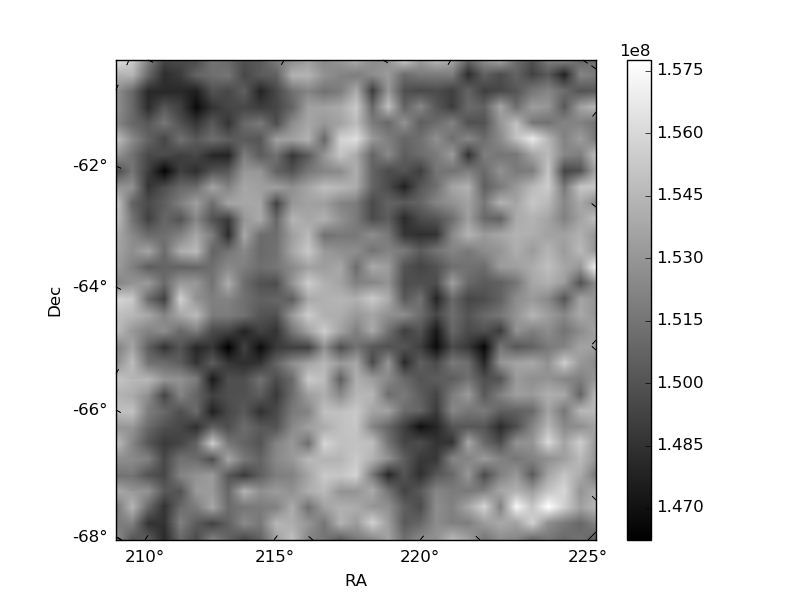
Histogram calculated using DETX and DETY for each event in the final _common_clean file
| Quadrant A | 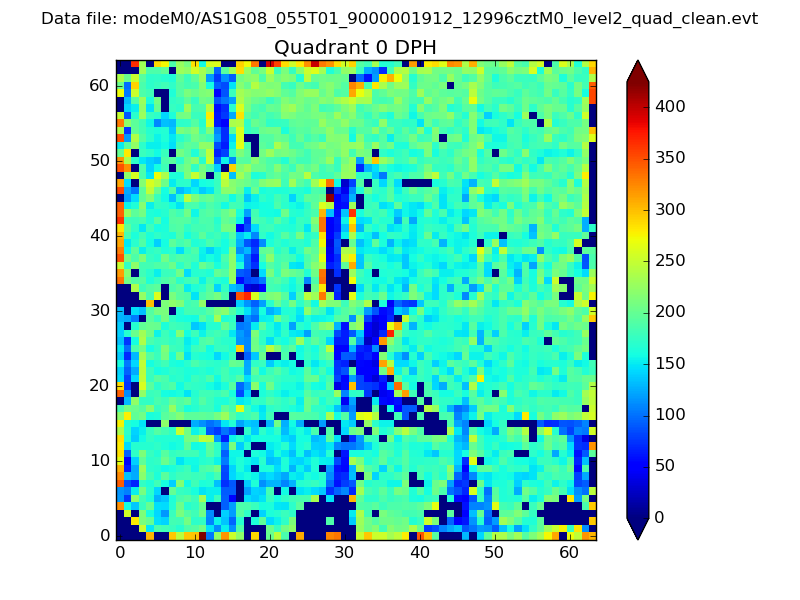 |
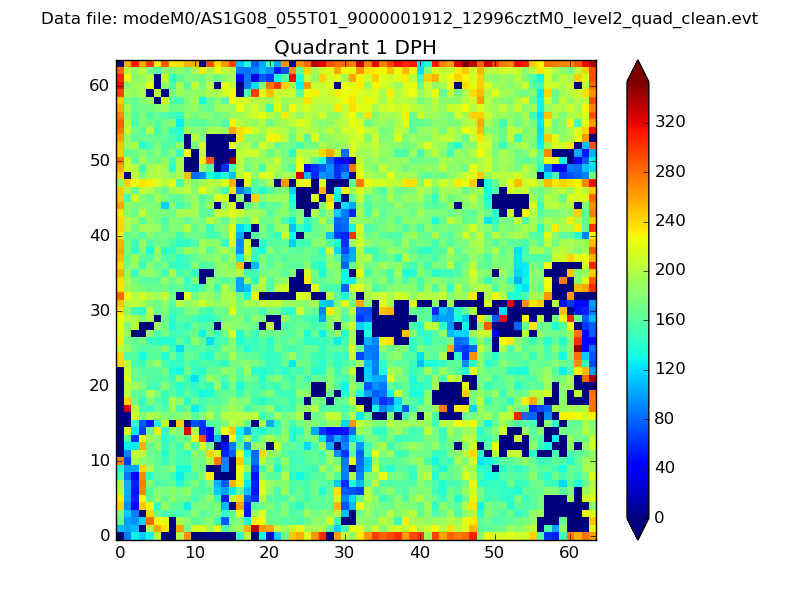 |
Quadrant B |
|---|---|---|---|
| Quadrant D | 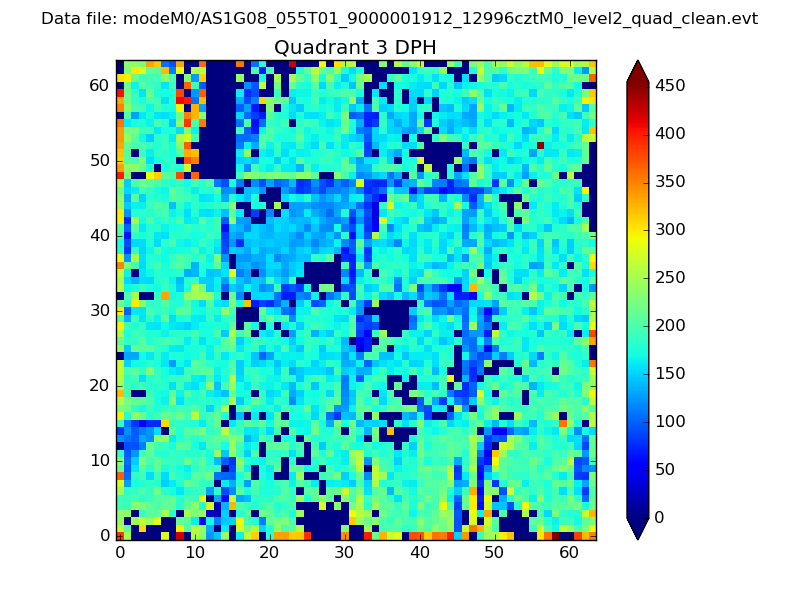 |
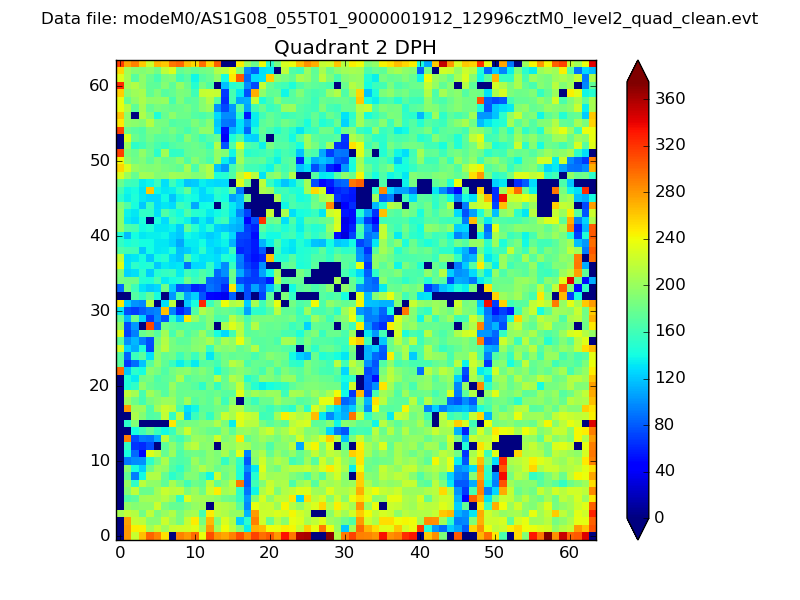 |
Quadrant C |
| Plot type | Count rate plots | Images |
|---|---|---|
| Comparison with Poisson distribution Blue bars denote a histogram of data divided into 1 sec bins. Red curve is a Poisson curve with rate = median count rate of data. |
 |
 |
| Quadrant-wise count rates Data is divided into 100 sec bins |
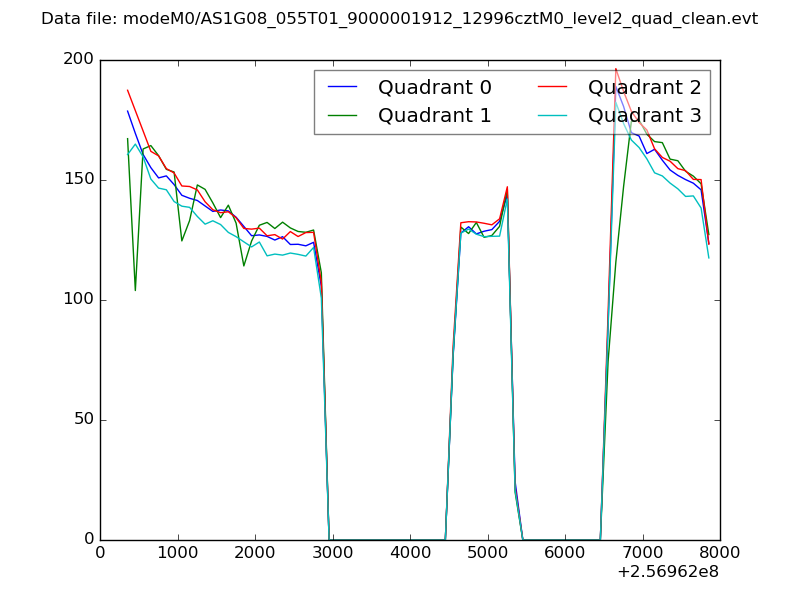 |
|
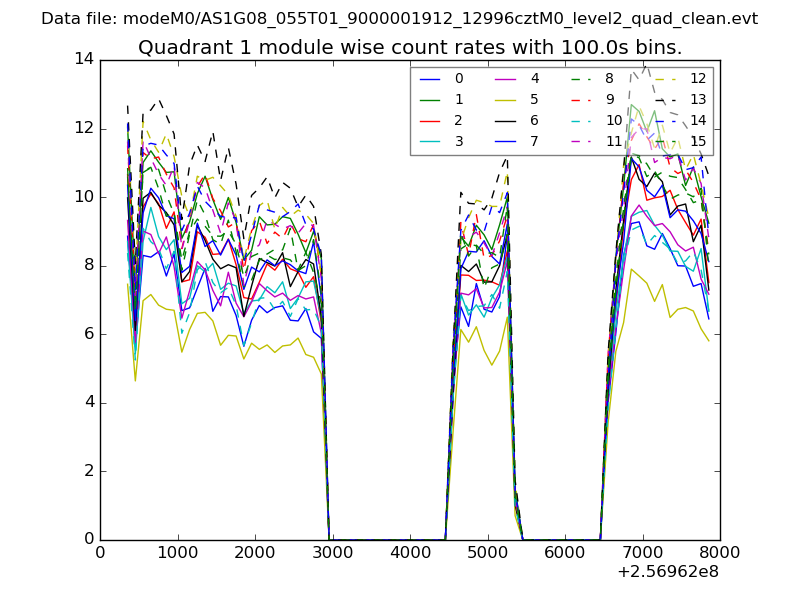
| Module-wise count rates for Quadrant A Data is divided into 100 sec bins |
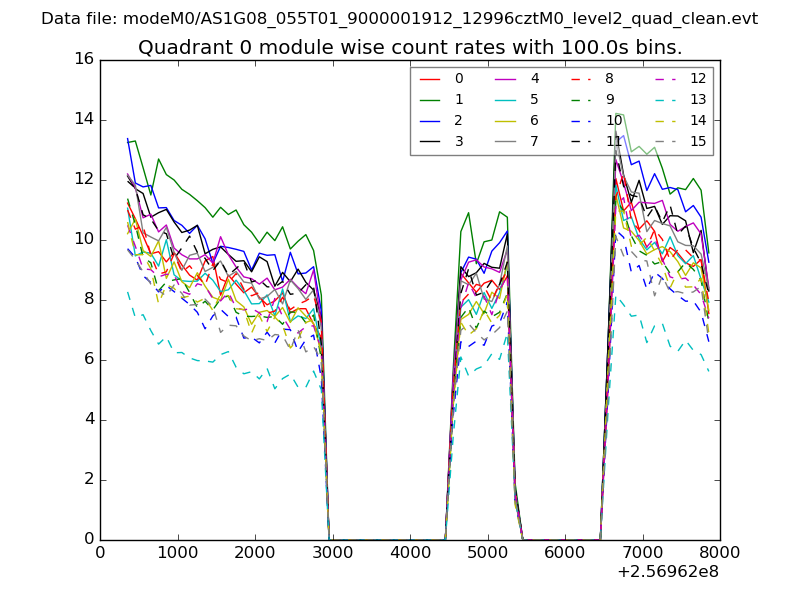 |
 |
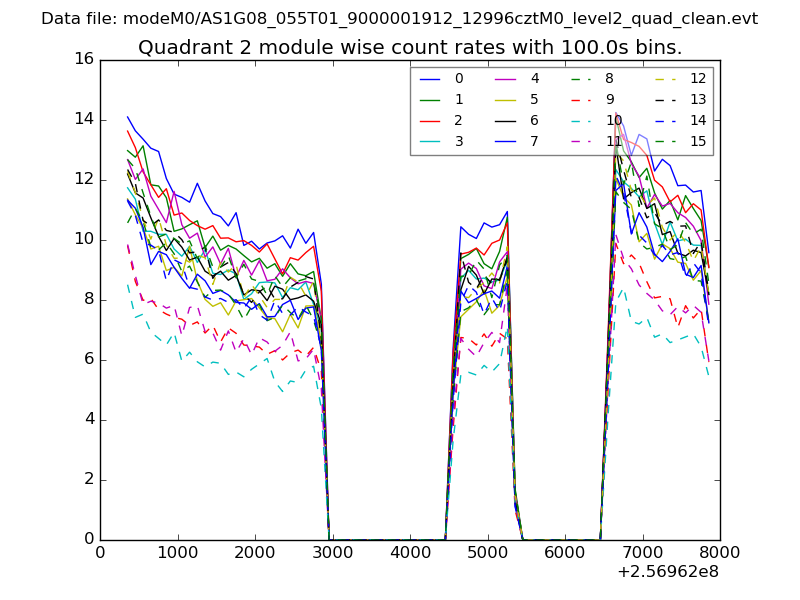
| Module-wise count rates for Quadrant B Data is divided into 100 sec bins |
 |
 |
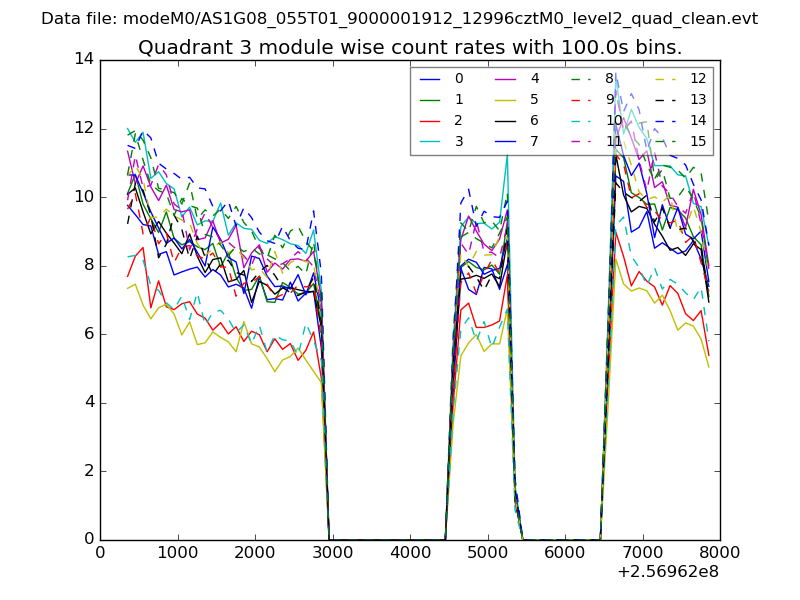
| Module-wise count rates for Quadrant C Data is divided into 100 sec bins |
 |
 |
| Module-wise count rates for Quadrant D Data is divided into 100 sec bins |
 |
 |
| Parameter | Plot |
|---|---|
| CZT HV Monitor | 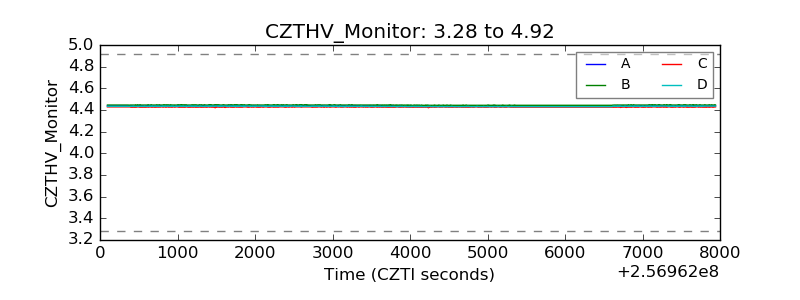 |
| D_VDD | 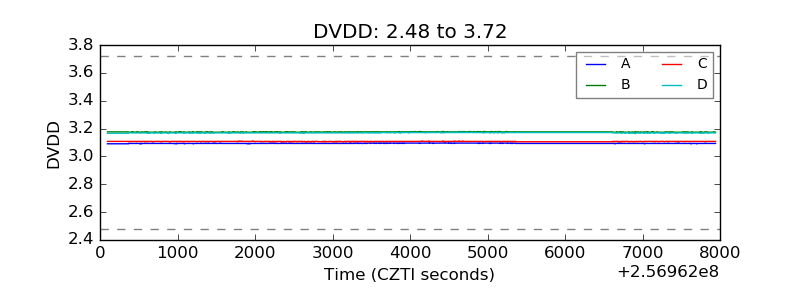 |
| Temperature 1 | 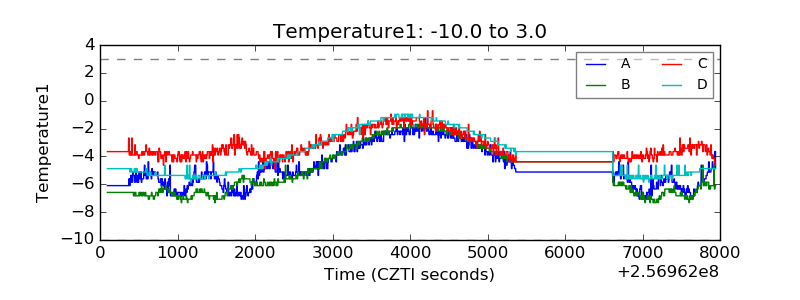 |
| Veto HV Monitor | 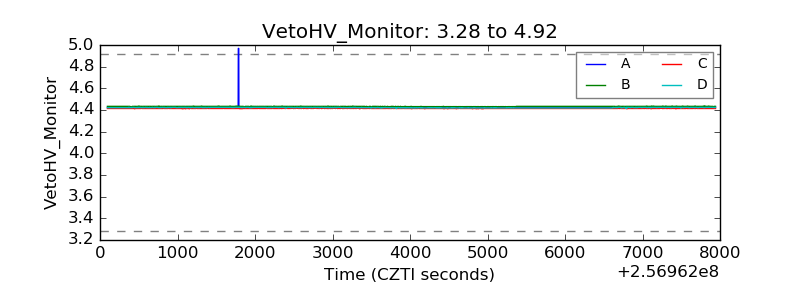 |
| Veto LLD | 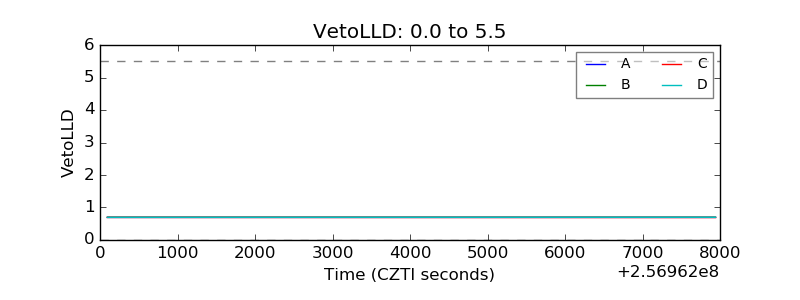 |
| Alpha Counter |  |
| _CPM_Rate | 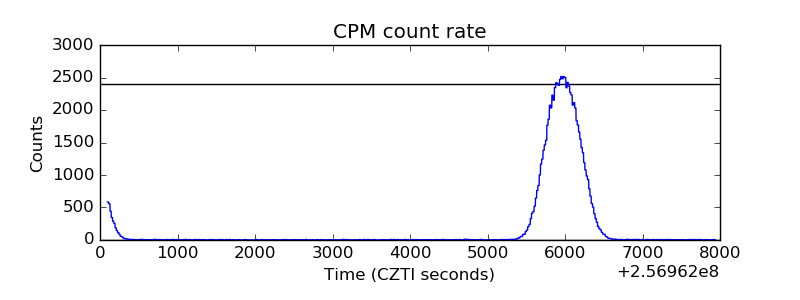 |
| CZT Counter | 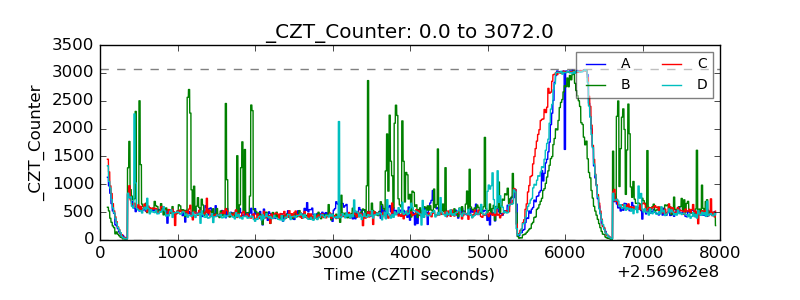 |
| +2.5 Volts monitor |  |
| +5 Volts monitor | 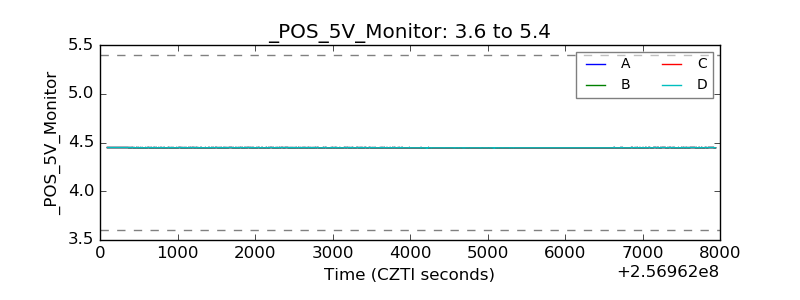 |
| _ROLL_ROT | 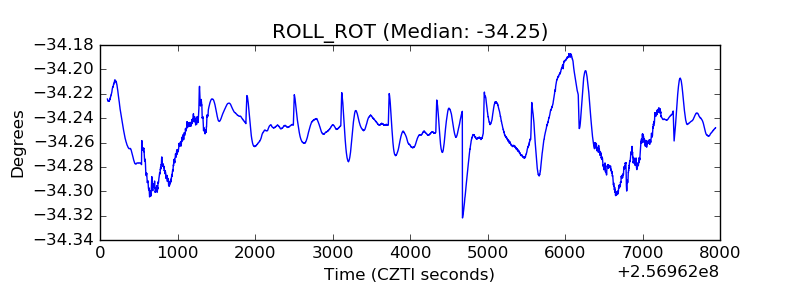 |
| _Roll_DEC | 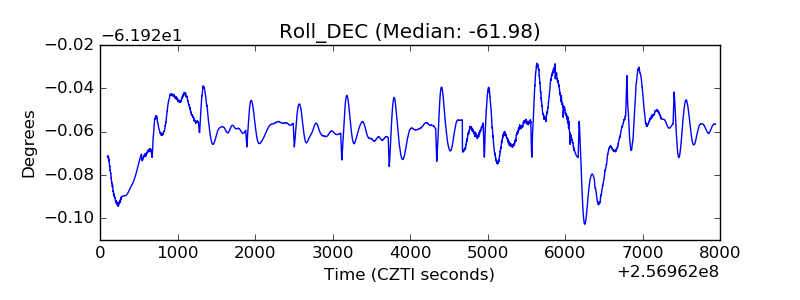 |
| _Roll_RA | 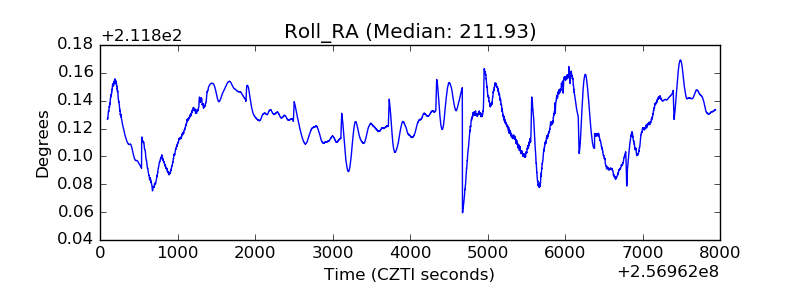 |
| Veto Counter | 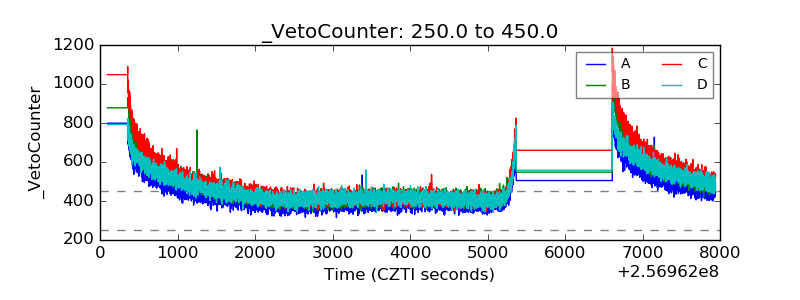 |