| Param | Original file | Final file |
|---|---|---|
| Filename | modeM0/AS1G08_055T01_9000001912_12998cztM0_level2.evt | modeM0/AS1G08_055T01_9000001912_12998cztM0_level2_quad_clean.evt |
| Size (bytes) | 481,092,480 | 94,072,320 |
| Size | 458.8 MB | 89.7 MB |
| Events in quadrant A | 3,082,017 | 623,439 |
| Events in quadrant B | 4,484,773 | 593,744 |
| Events in quadrant C | 2,920,251 | 632,104 |
| Events in quadrant D | 3,683,276 | 588,184 |
| Mode M9 | |||
|---|---|---|---|
| Quadrant | BADHDUFLAG | Total packets | Discarded packets |
| A | 0 | 13 | 0 |
| B | 0 | 13 | 0 |
| C | 0 | 13 | 0 |
| D | 0 | 13 | 0 |
| Mode SS | |||
|---|---|---|---|
| Quadrant | BADHDUFLAG | Total packets | Discarded packets |
| A | 0 | 120 | 0 |
| B | 0 | 120 | 0 |
| C | 0 | 120 | 0 |
| D | 0 | 120 | 0 |
| Mode M0 | |||
|---|---|---|---|
| Quadrant | BADHDUFLAG | Total packets | Discarded packets |
| A | 0 | 12557 | 2 |
| B | 0 | 16983 | 1 |
| C | 0 | 12166 | 1 |
| D | 0 | 14695 | 1 |
| Quadrant | Total seconds | Saturated seconds | Saturation percentage |
|---|---|---|---|
| A | 5883 | 58 | 0.985892% |
| B | 5883 | 642 | 10.912800% |
| C | 5883 | 54 | 0.917899% |
| D | 5883 | 244 | 4.147544% |
Noise dominated data is calculated using 1-second bins in cleaned event files. If a bin has >2000 counts, and if more than 50% of those come from <1% of pixels, then it is considered to be noise-dominated and hence unusable.
| Quadrant | # 1 sec bins | Bins with >0 counts | Bins with >2000 counts | High rate bins dominated by noise | Noise dominated (total time) | Noise dominated (detector-on time) | Marked lightcurve |
|---|---|---|---|---|---|---|---|
| A | 7204 | 5885 | 5 | 5 | 0.07% | 0.08% | 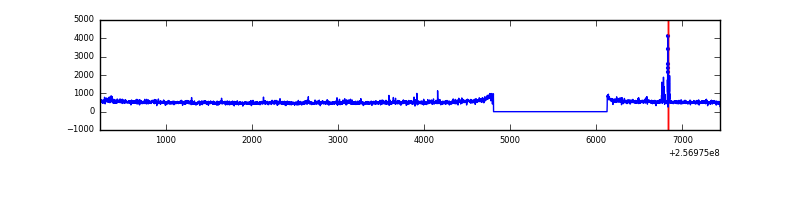 |
| B | 7204 | 5885 | 373 | 373 | 5.18% | 6.34% | 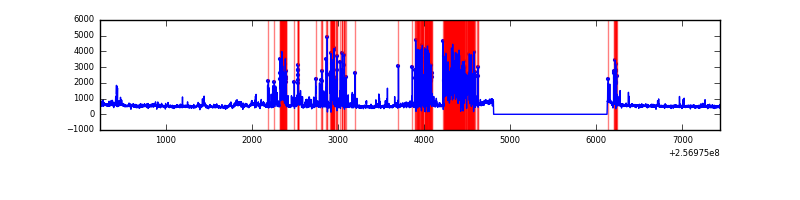 |
| C | 7204 | 5885 | 0 | 0 | 0.00% | 0.00% | 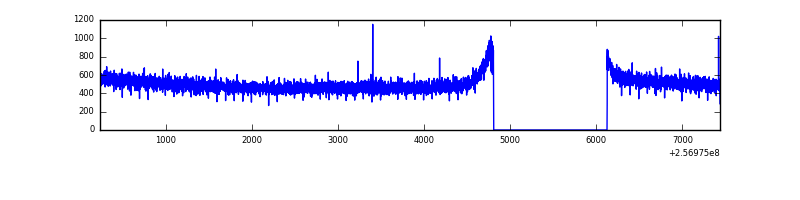 |
| D | 7204 | 5885 | 150 | 150 | 2.08% | 2.55% | 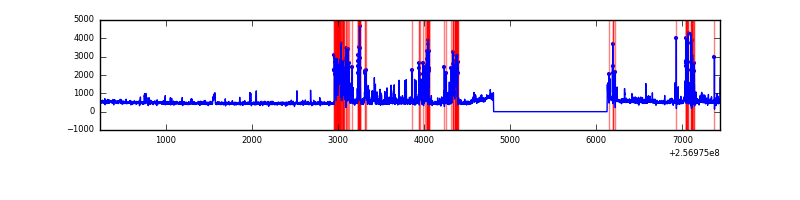 |
Top three noisy pixels from each quadrant. If the there are fewer than three noisy pixels in the level2.evt file, extra rows are filled as -1
| Pixel properties | Quadrant properties | ||||||
|---|---|---|---|---|---|---|---|
| Quadrant | DetID | PixID | Counts | Sigma | Mean | Median | Sigma |
| A | 12 | 189 | 86991 | 572.34 | 750 | 735 | 150.7 |
| A | 9 | 143 | 52672 | 344.62 | 750 | 735 | 150.7 |
| A | 1 | 162 | 30147 | 195.16 | 750 | 735 | 150.7 |
| B | 4 | 239 | 1460338 | 11251.98 | 708 | 693 | 129.7 |
| B | 0 | 219 | 121257 | 929.39 | 708 | 693 | 129.7 |
| B | 3 | 209 | 47050 | 357.35 | 708 | 693 | 129.7 |
| C | 13 | 61 | 5417 | 27.44 | 748 | 751 | 170.0 |
| C | 14 | 234 | 3477 | 16.03 | 748 | 751 | 170.0 |
| C | 8 | 222 | 1993 | 7.31 | 748 | 751 | 170.0 |
| D | 1 | 52 | 727999 | 4220.08 | 731 | 712 | 172.3 |
| D | 13 | 122 | 118006 | 680.6 | 731 | 712 | 172.3 |
| D | 8 | 195 | 63674 | 365.34 | 731 | 712 | 172.3 |
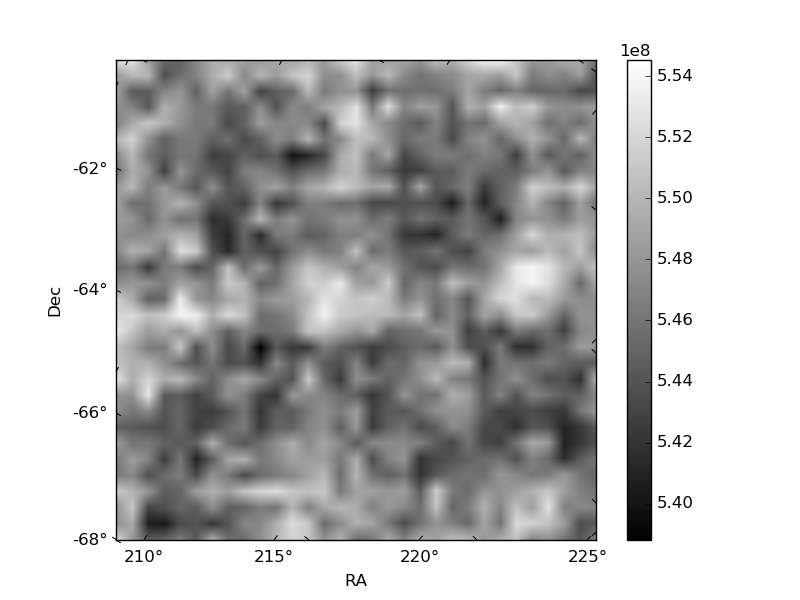
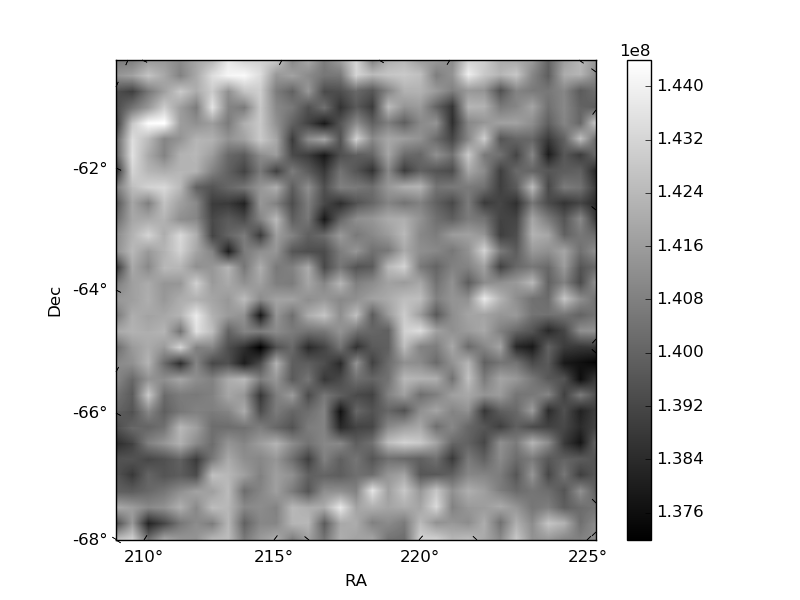
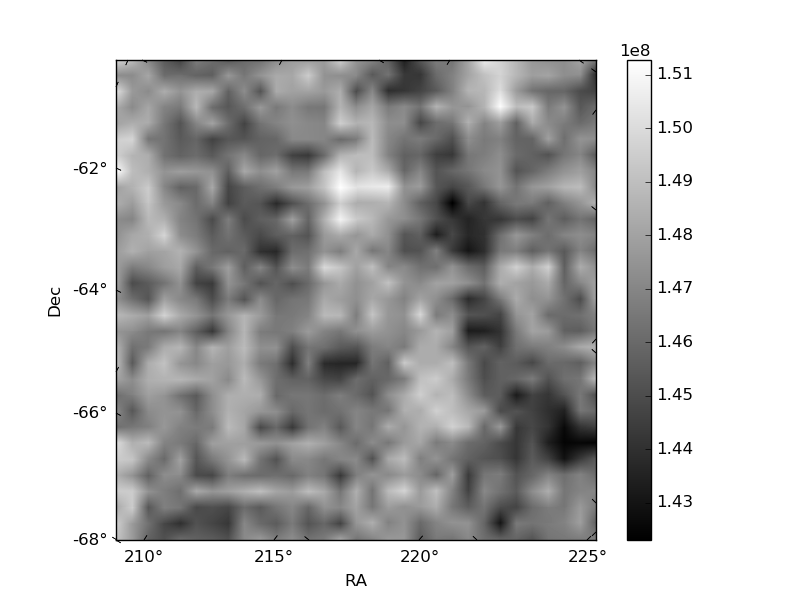
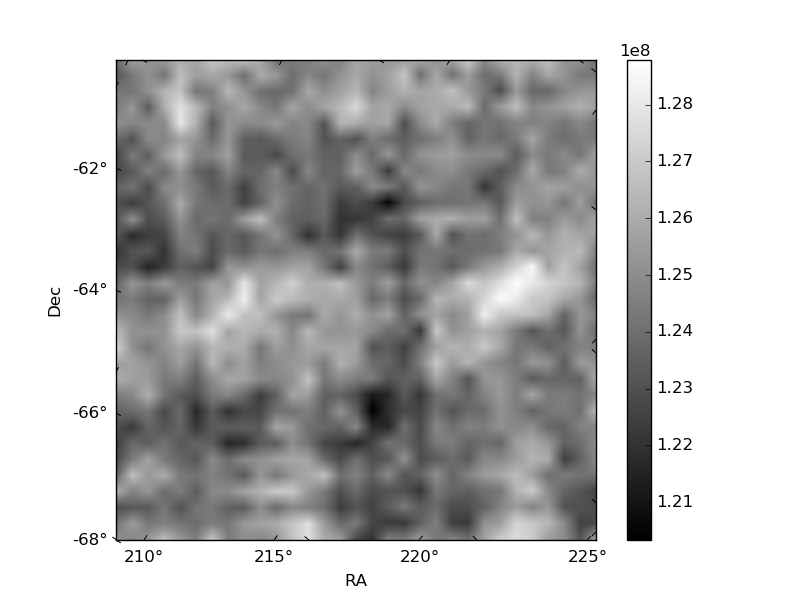
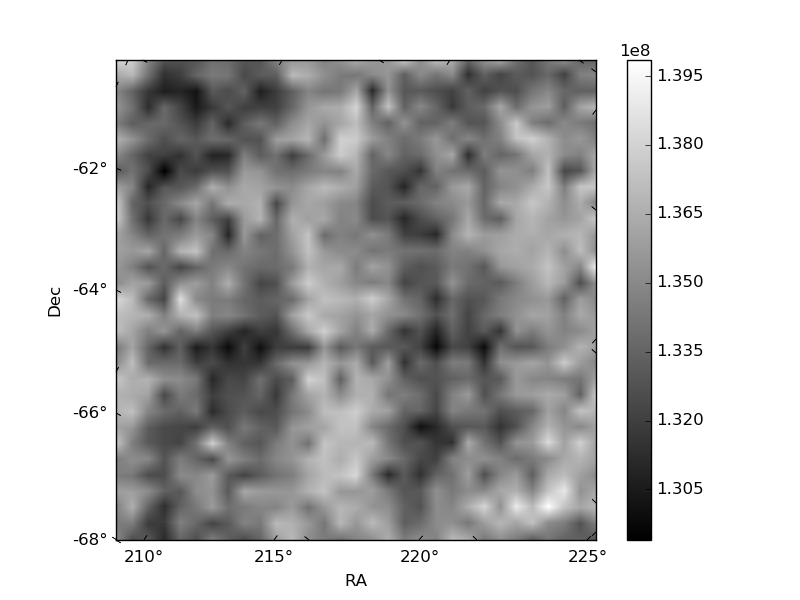
Histogram calculated using DETX and DETY for each event in the final _common_clean file
| Quadrant A | 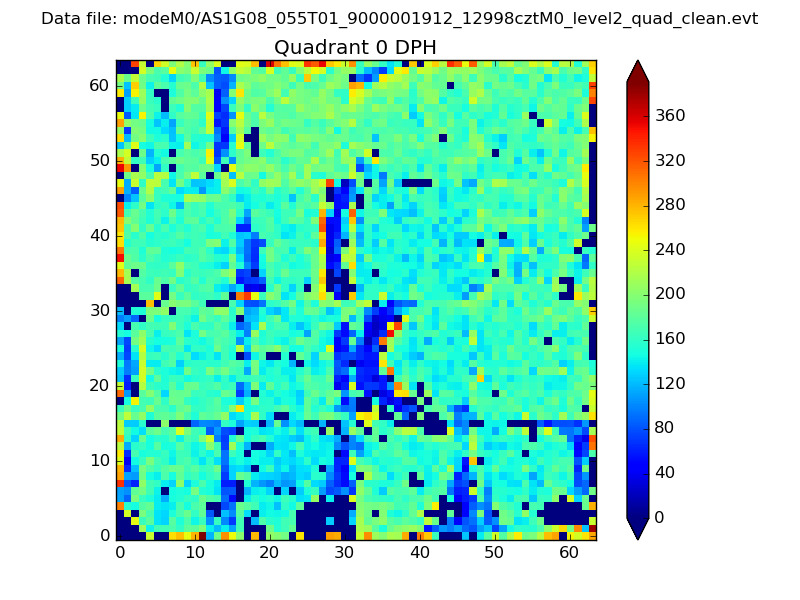 |
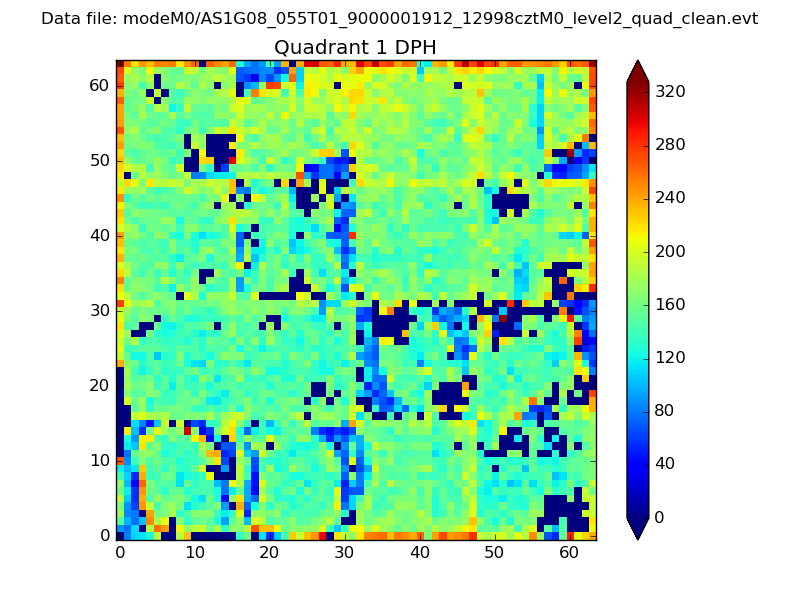 |
Quadrant B |
|---|---|---|---|
| Quadrant D | 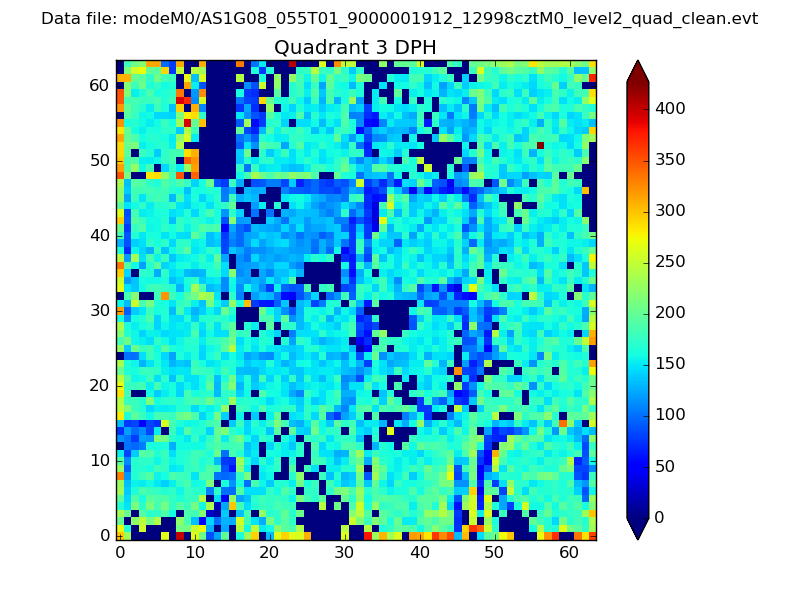 |
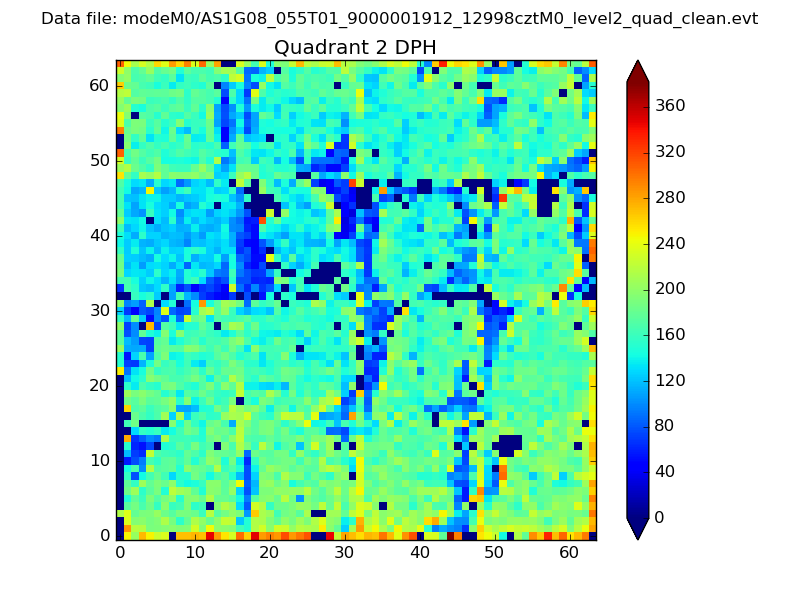 |
Quadrant C |
| Plot type | Count rate plots | Images |
|---|---|---|
| Comparison with Poisson distribution Blue bars denote a histogram of data divided into 1 sec bins. Red curve is a Poisson curve with rate = median count rate of data. |
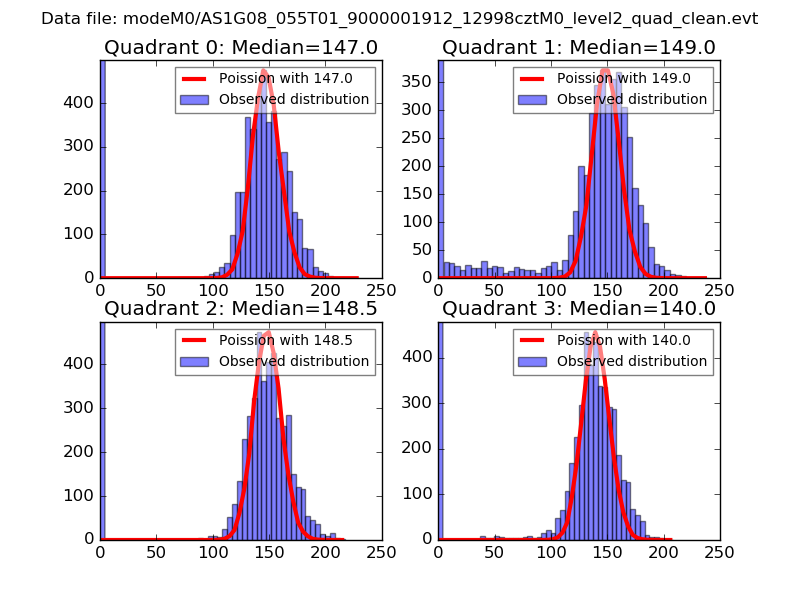 |
 |
| Quadrant-wise count rates Data is divided into 100 sec bins |
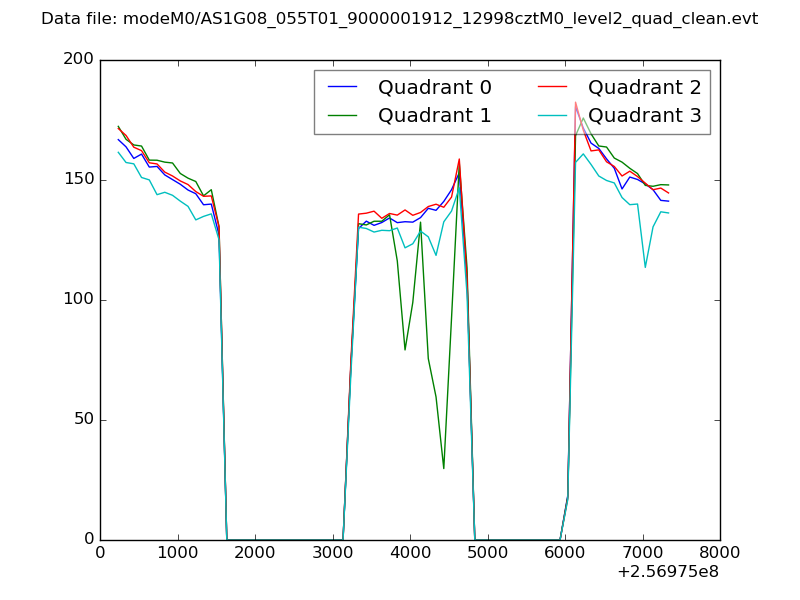 |
|
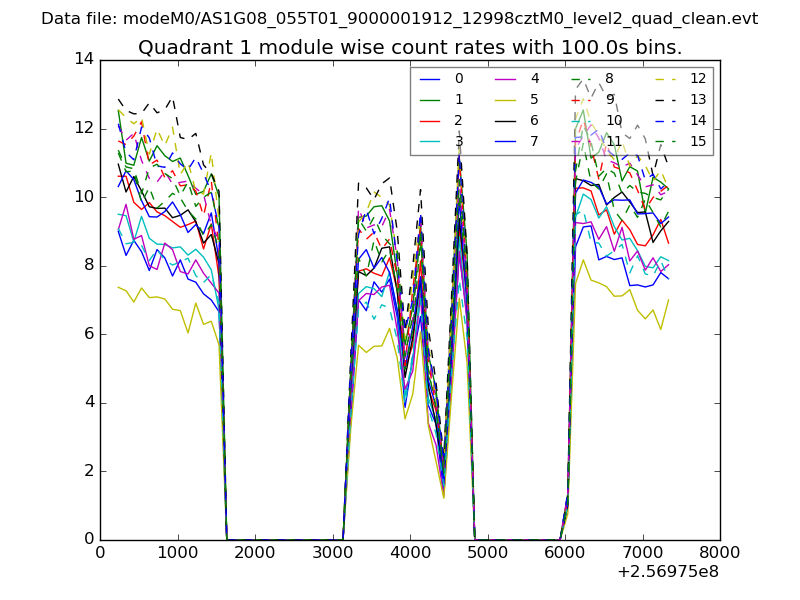
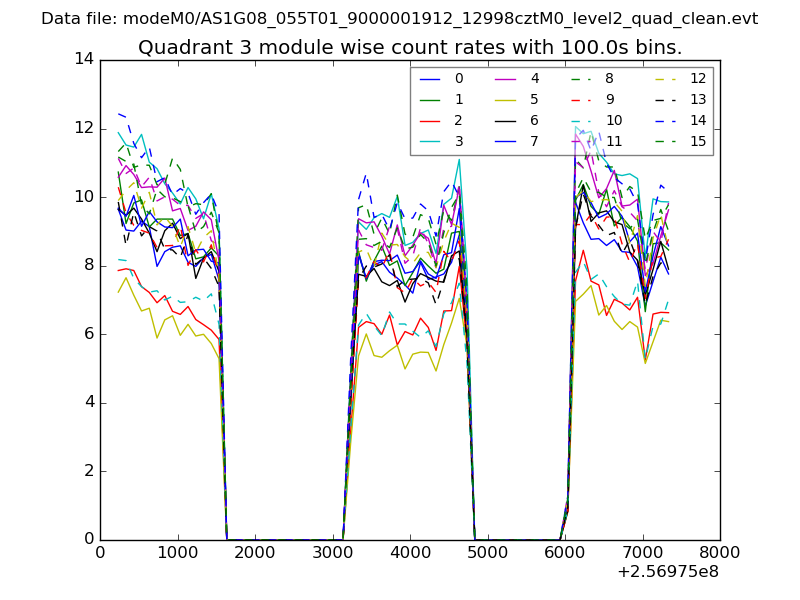
| Module-wise count rates for Quadrant A Data is divided into 100 sec bins |
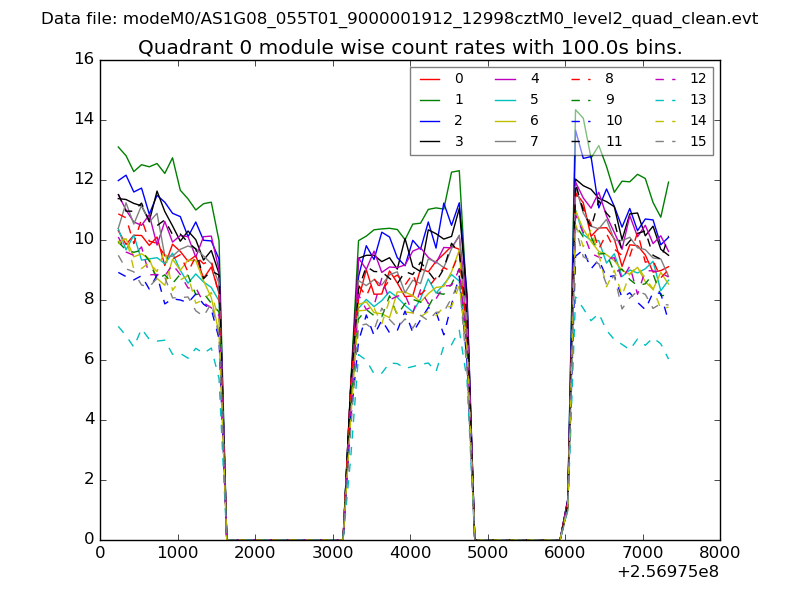 |
 |
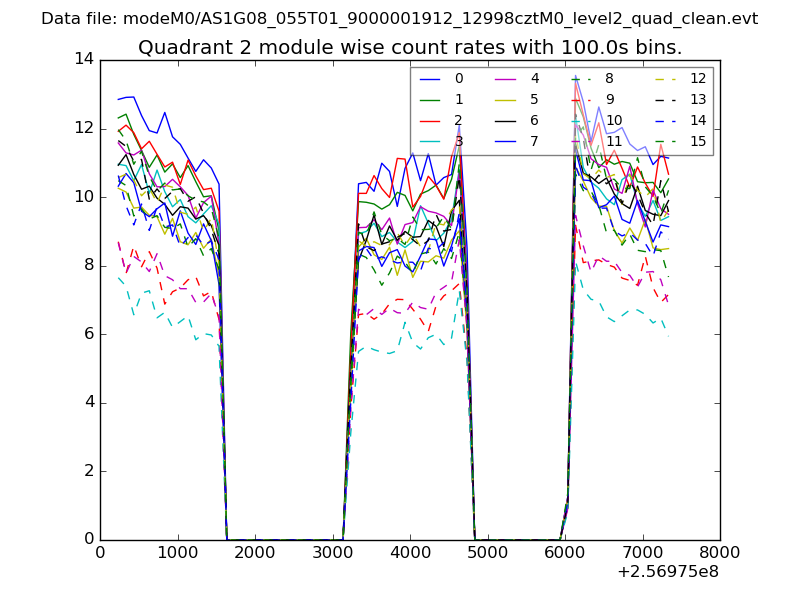
| Module-wise count rates for Quadrant B Data is divided into 100 sec bins |
 |
 |
| Module-wise count rates for Quadrant C Data is divided into 100 sec bins |
 |
 |
| Module-wise count rates for Quadrant D Data is divided into 100 sec bins |
 |
 |
| Parameter | Plot |
|---|---|
| CZT HV Monitor | 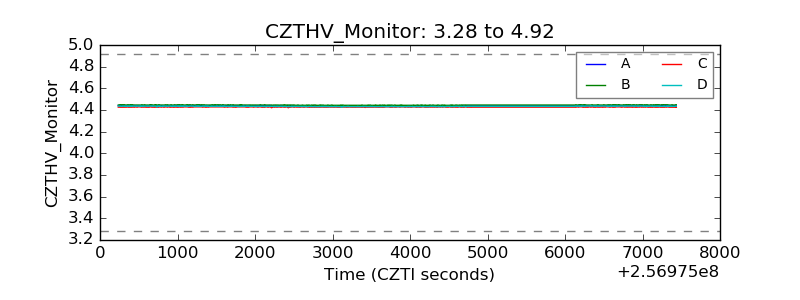 |
| D_VDD | 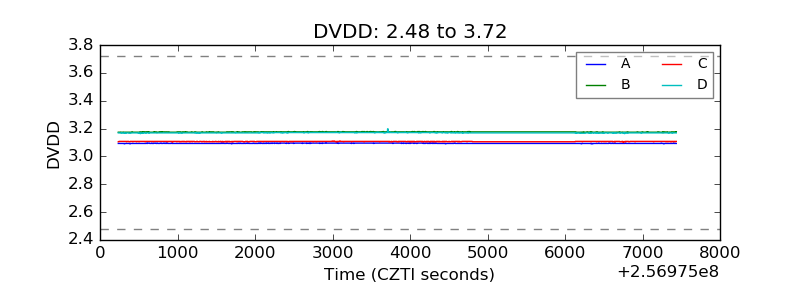 |
| Temperature 1 | 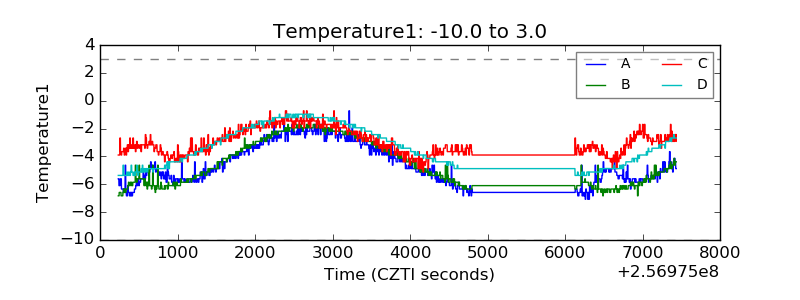 |
| Veto HV Monitor | 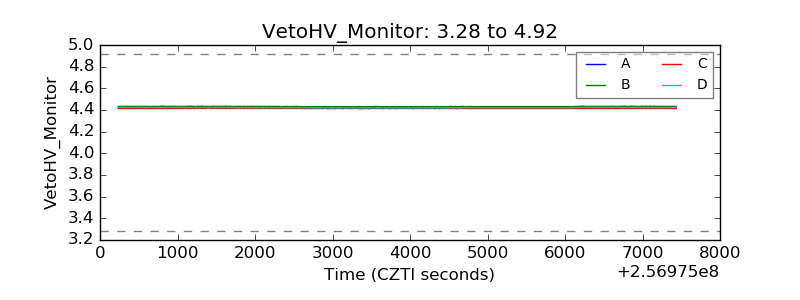 |
| Veto LLD | 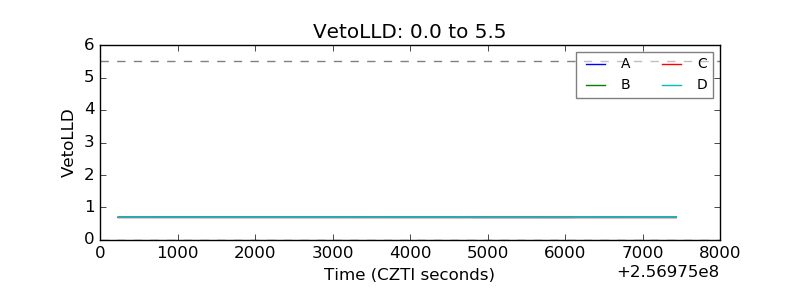 |
| Alpha Counter | 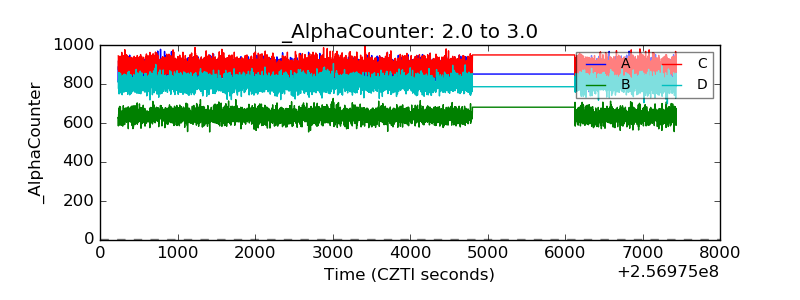 |
| _CPM_Rate | 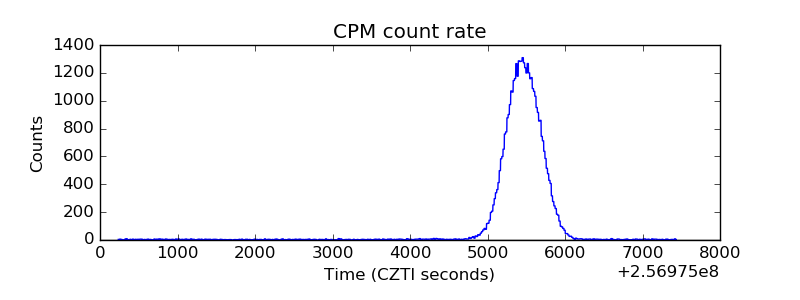 |
| CZT Counter | 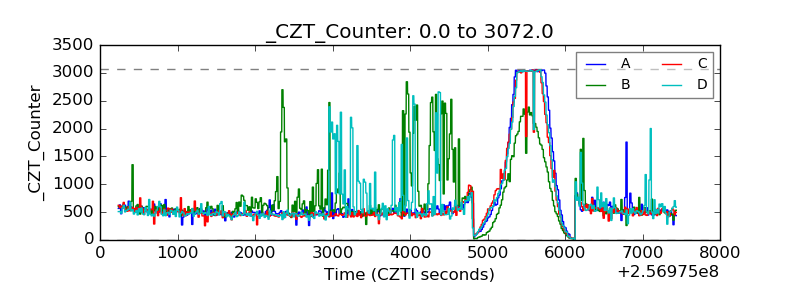 |
| +2.5 Volts monitor |  |
| +5 Volts monitor |  |
| _ROLL_ROT | 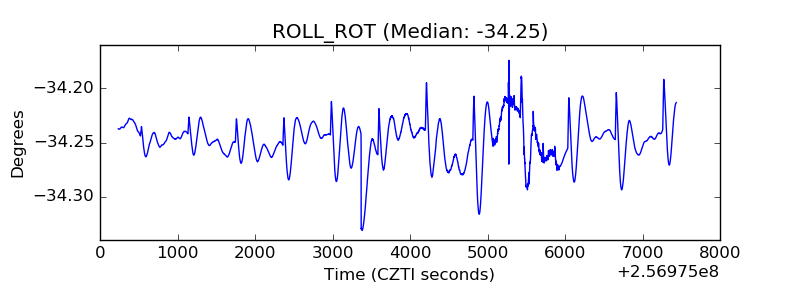 |
| _Roll_DEC | 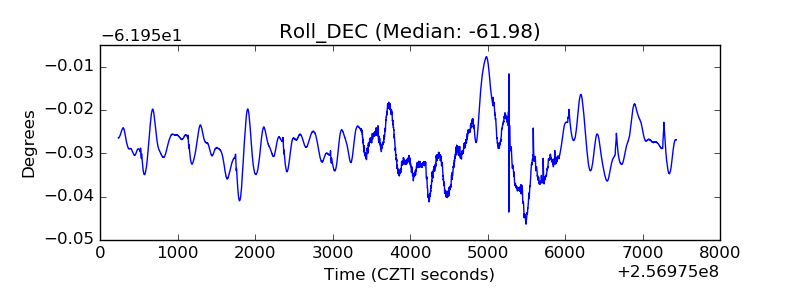 |
| _Roll_RA | 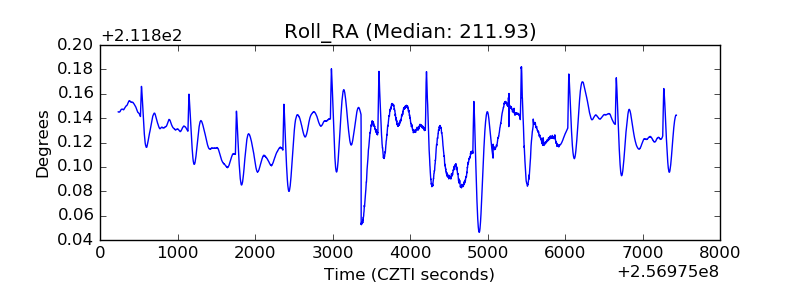 |
| Veto Counter | 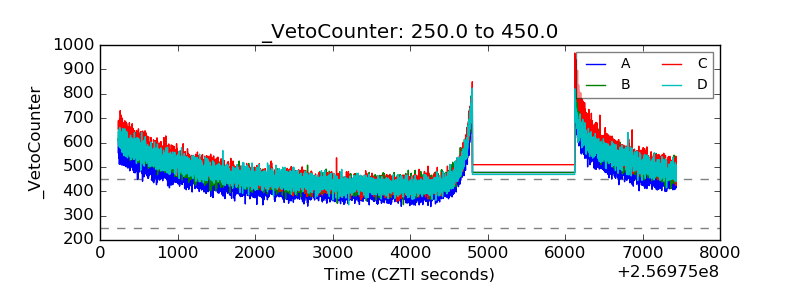 |