| Param | Original file | Final file |
|---|---|---|
| Filename | modeM0/AS1G08_055T01_9000001912_13000cztM0_level2.evt | modeM0/AS1G08_055T01_9000001912_13000cztM0_level2_quad_clean.evt |
| Size (bytes) | 501,520,320 | 89,645,760 |
| Size | 478.3 MB | 85.5 MB |
| Events in quadrant A | 3,333,129 | 574,775 |
| Events in quadrant B | 4,354,995 | 552,201 |
| Events in quadrant C | 3,127,396 | 578,381 |
| Events in quadrant D | 3,924,327 | 548,473 |
| Mode M9 | |||
|---|---|---|---|
| Quadrant | BADHDUFLAG | Total packets | Discarded packets |
| A | 0 | 9 | 0 |
| B | 0 | 9 | 0 |
| C | 0 | 9 | 0 |
| D | 0 | 10 | 0 |
| Mode SS | |||
|---|---|---|---|
| Quadrant | BADHDUFLAG | Total packets | Discarded packets |
| A | 0 | 134 | 0 |
| B | 0 | 134 | 0 |
| C | 0 | 134 | 0 |
| D | 0 | 134 | 0 |
| Mode M0 | |||
|---|---|---|---|
| Quadrant | BADHDUFLAG | Total packets | Discarded packets |
| A | 0 | 13989 | 3 |
| B | 0 | 17125 | 2 |
| C | 0 | 13657 | 2 |
| D | 0 | 15944 | 2 |
| Quadrant | Total seconds | Saturated seconds | Saturation percentage |
|---|---|---|---|
| A | 6605 | 186 | 2.816048% |
| B | 6605 | 552 | 8.357305% |
| C | 6605 | 137 | 2.074186% |
| D | 6605 | 244 | 3.694171% |
Noise dominated data is calculated using 1-second bins in cleaned event files. If a bin has >2000 counts, and if more than 50% of those come from <1% of pixels, then it is considered to be noise-dominated and hence unusable.
| Quadrant | # 1 sec bins | Bins with >0 counts | Bins with >2000 counts | High rate bins dominated by noise | Noise dominated (total time) | Noise dominated (detector-on time) | Marked lightcurve |
|---|---|---|---|---|---|---|---|
| A | 7506 | 6607 | 0 | 0 | 0.00% | 0.00% | 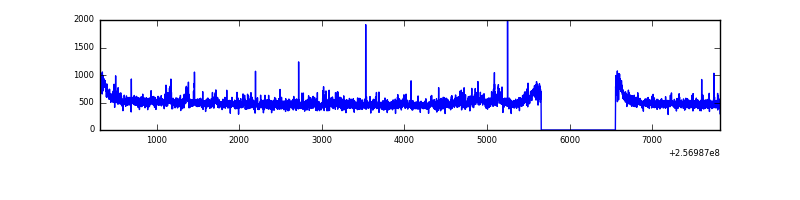 |
| B | 7506 | 6607 | 211 | 211 | 2.81% | 3.19% | 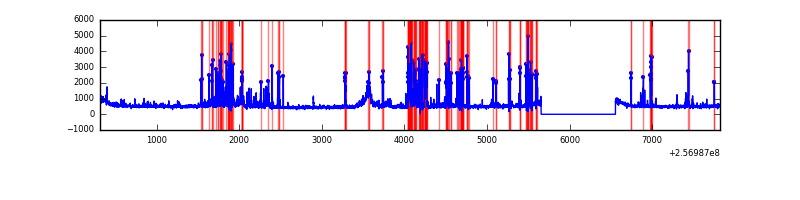 |
| C | 7506 | 6607 | 0 | 0 | 0.00% | 0.00% | 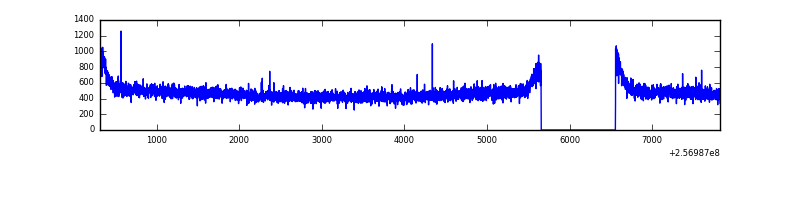 |
| D | 7506 | 6607 | 79 | 79 | 1.05% | 1.20% |  |
Top three noisy pixels from each quadrant. If the there are fewer than three noisy pixels in the level2.evt file, extra rows are filled as -1
| Pixel properties | Quadrant properties | ||||||
|---|---|---|---|---|---|---|---|
| Quadrant | DetID | PixID | Counts | Sigma | Mean | Median | Sigma |
| A | 12 | 189 | 121950 | 737.57 | 814 | 797 | 164.3 |
| A | 1 | 162 | 41543 | 248.06 | 814 | 797 | 164.3 |
| A | 1 | 178 | 15215 | 87.78 | 814 | 797 | 164.3 |
| B | 4 | 239 | 903126 | 6148.94 | 781 | 760 | 146.8 |
| B | 0 | 219 | 217189 | 1474.8 | 781 | 760 | 146.8 |
| B | 3 | 64 | 65756 | 442.9 | 781 | 760 | 146.8 |
| C | 13 | 61 | 5938 | 27.95 | 801 | 803 | 183.7 |
| C | 14 | 234 | 3662 | 15.56 | 801 | 803 | 183.7 |
| C | 12 | 4 | 1950 | 6.24 | 801 | 803 | 183.7 |
| D | 1 | 52 | 830322 | 4412.11 | 791 | 766 | 188.0 |
| D | 14 | 49 | 39452 | 205.76 | 791 | 766 | 188.0 |
| D | 8 | 195 | 38635 | 201.41 | 791 | 766 | 188.0 |
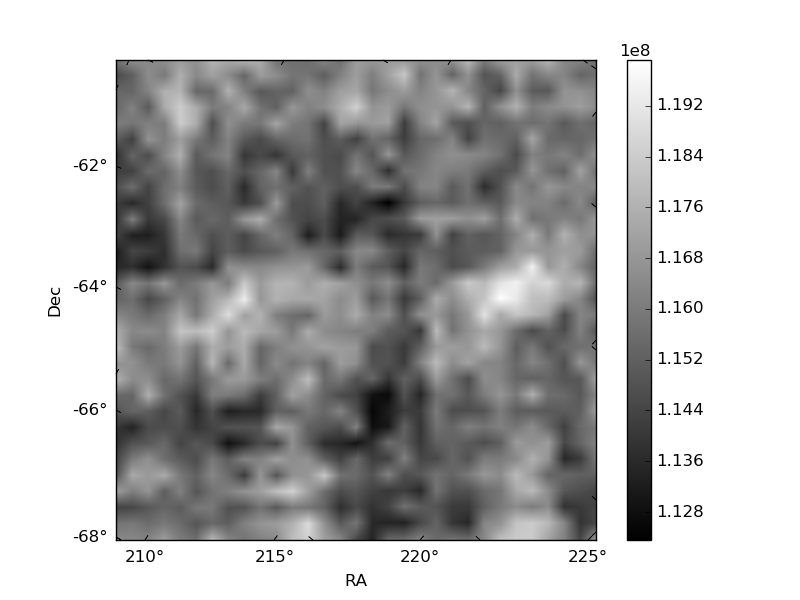
Histogram calculated using DETX and DETY for each event in the final _common_clean file
| Quadrant A |  |
 |
Quadrant B |
|---|---|---|---|
| Quadrant D | 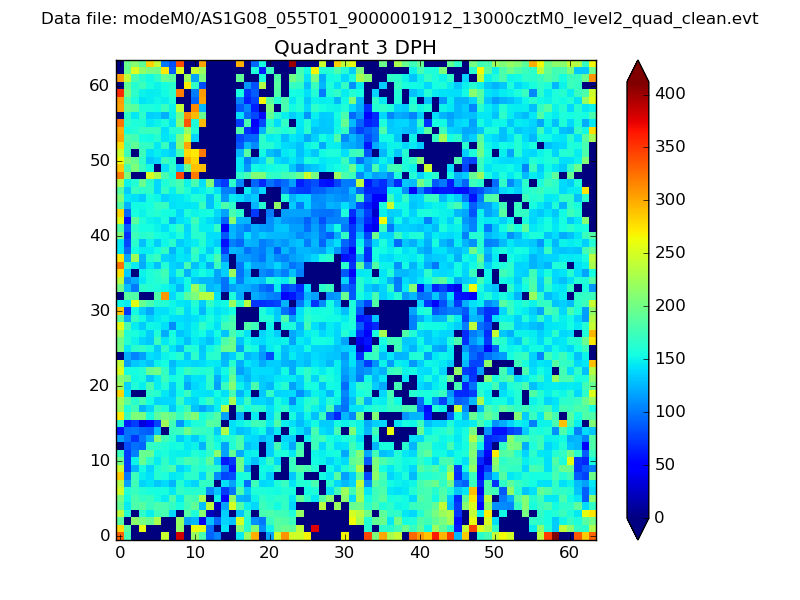 |
 |
Quadrant C |
| Plot type | Count rate plots | Images |
|---|---|---|
| Comparison with Poisson distribution Blue bars denote a histogram of data divided into 1 sec bins. Red curve is a Poisson curve with rate = median count rate of data. |
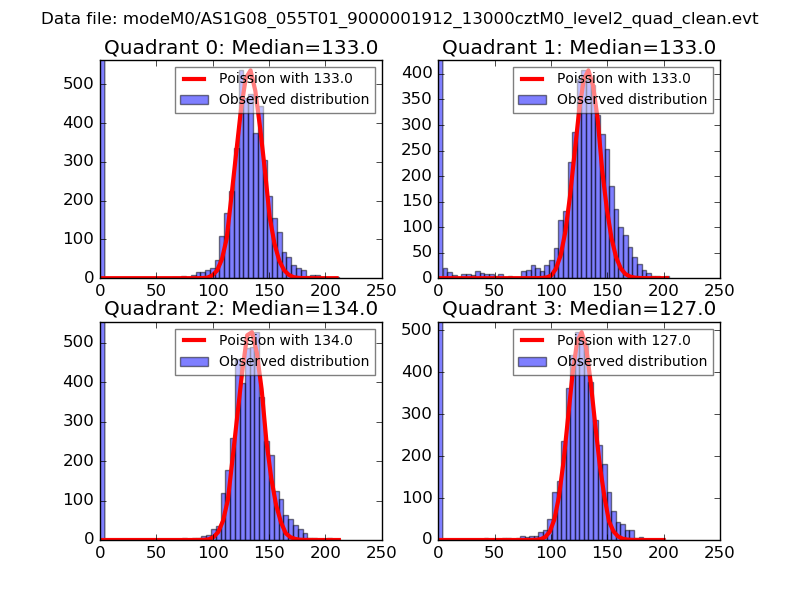 |
 |
| Quadrant-wise count rates Data is divided into 100 sec bins |
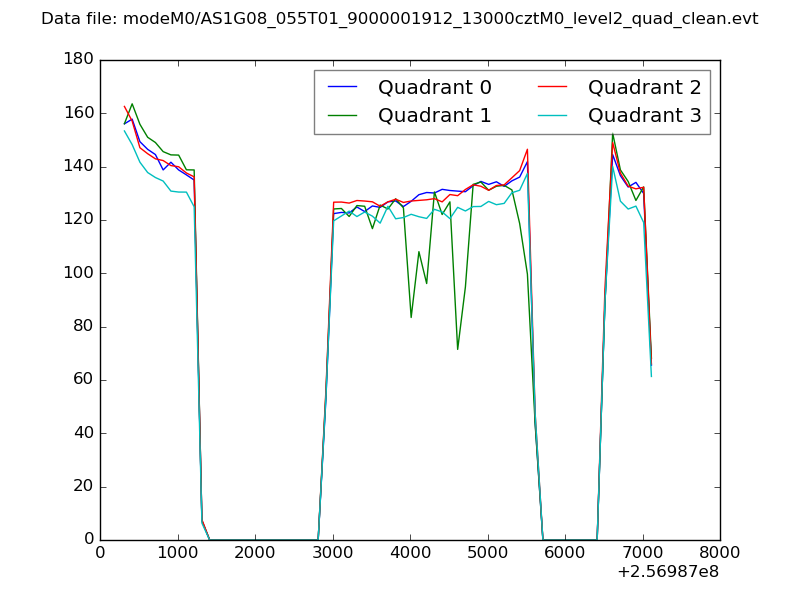 |
|
| Module-wise count rates for Quadrant A Data is divided into 100 sec bins |
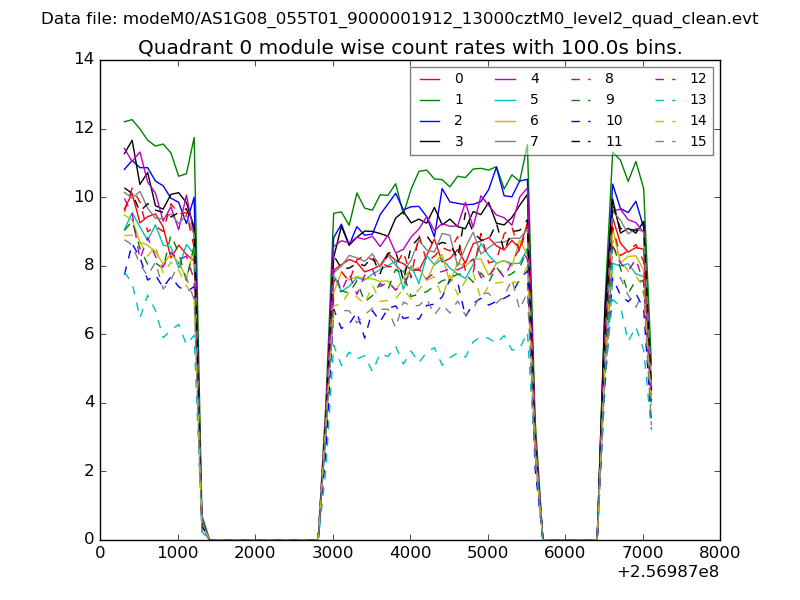 |
 |
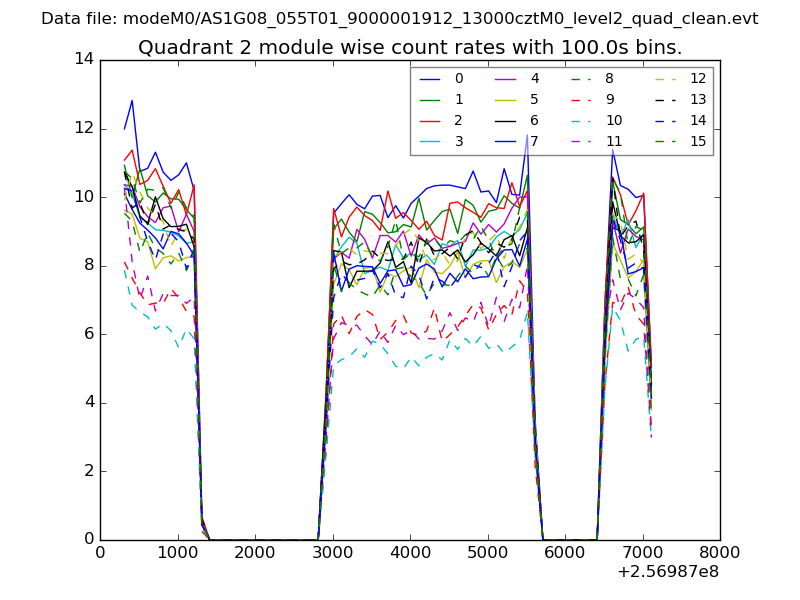
| Module-wise count rates for Quadrant B Data is divided into 100 sec bins |
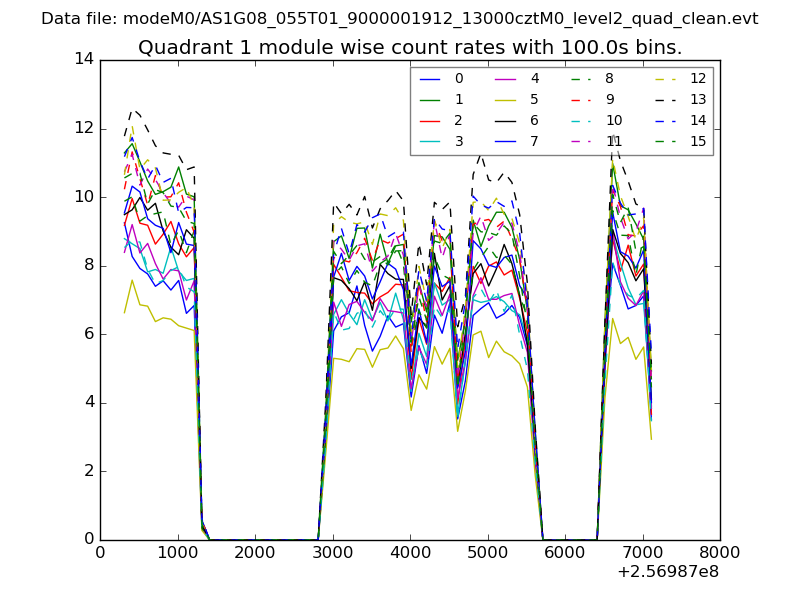 |
 |
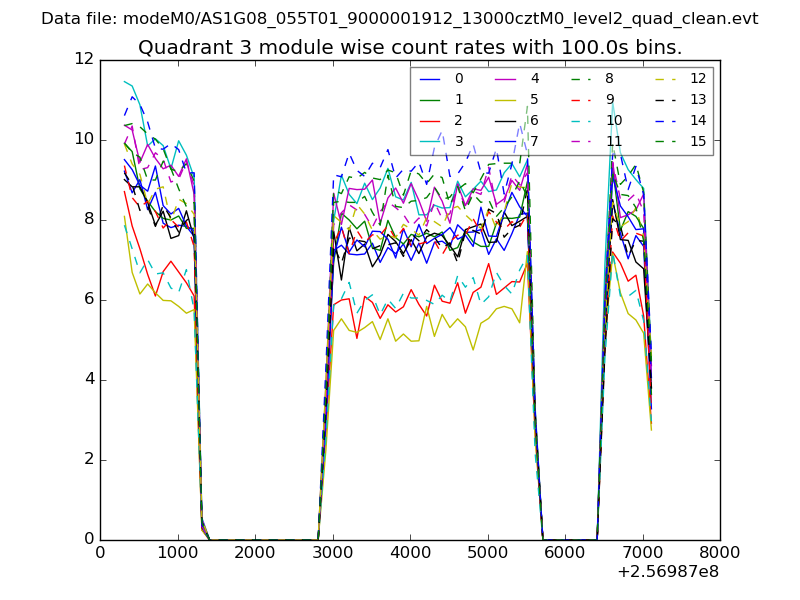
| Module-wise count rates for Quadrant C Data is divided into 100 sec bins |
 |
 |
| Module-wise count rates for Quadrant D Data is divided into 100 sec bins |
 |
 |
| Parameter | Plot |
|---|---|
| CZT HV Monitor | 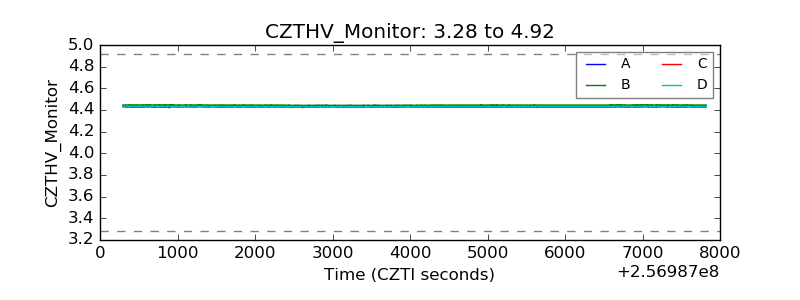 |
| D_VDD | 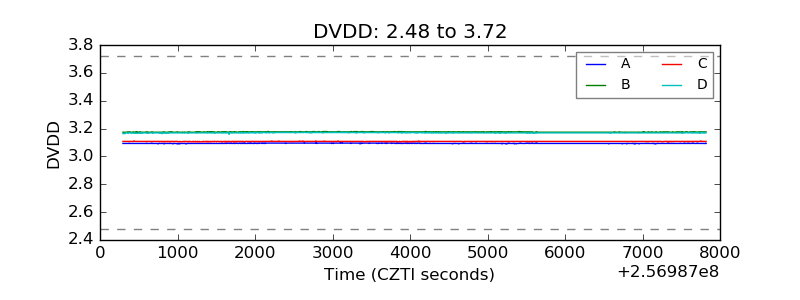 |
| Temperature 1 | 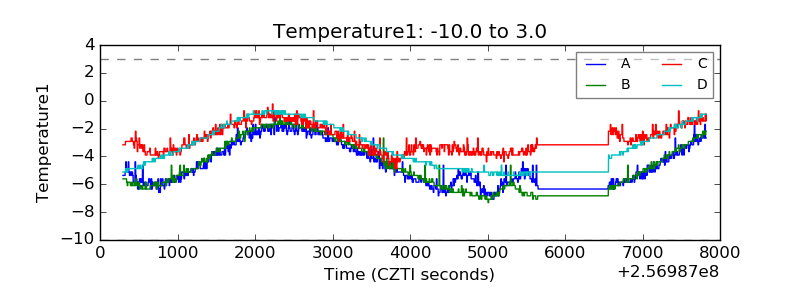 |
| Veto HV Monitor | 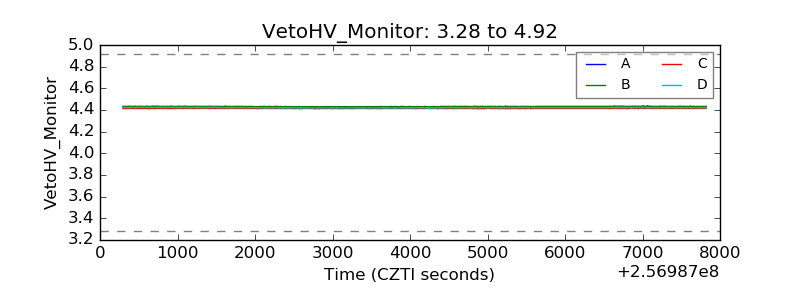 |
| Veto LLD | 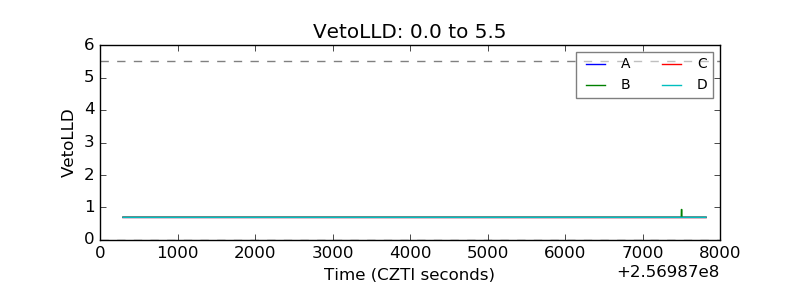 |
| Alpha Counter | 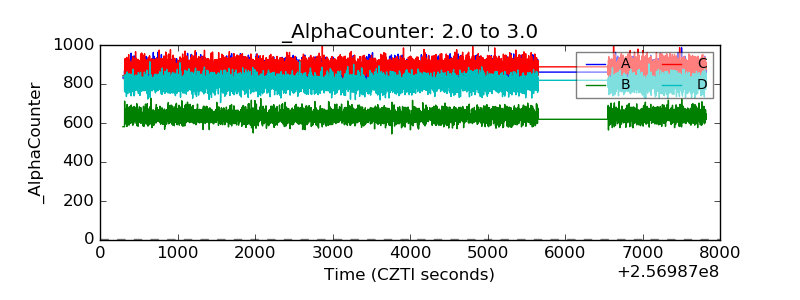 |
| _CPM_Rate | 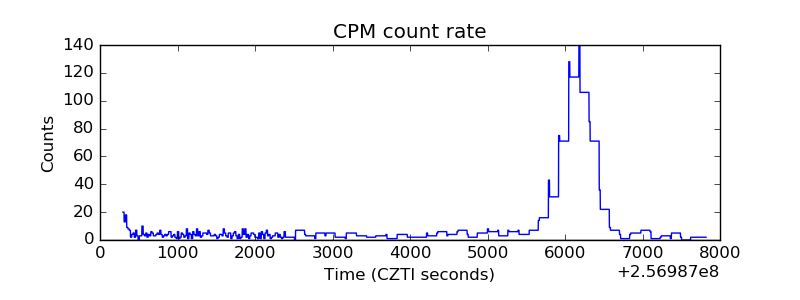 |
| CZT Counter |  |
| +2.5 Volts monitor |  |
| +5 Volts monitor |  |
| _ROLL_ROT | 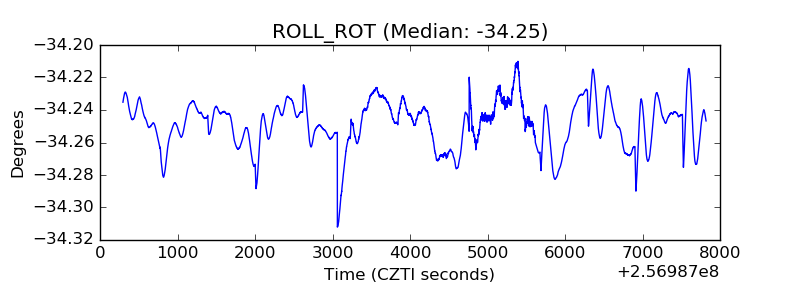 |
| _Roll_DEC | 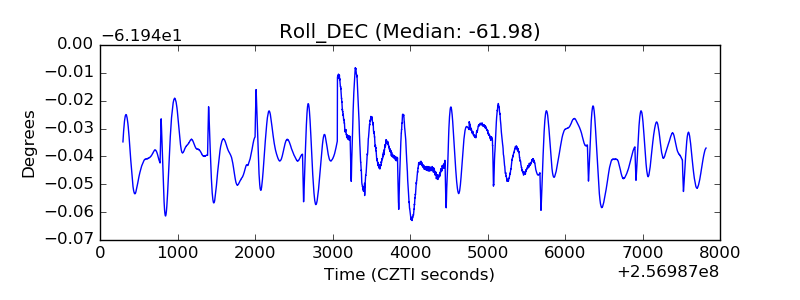 |
| _Roll_RA | 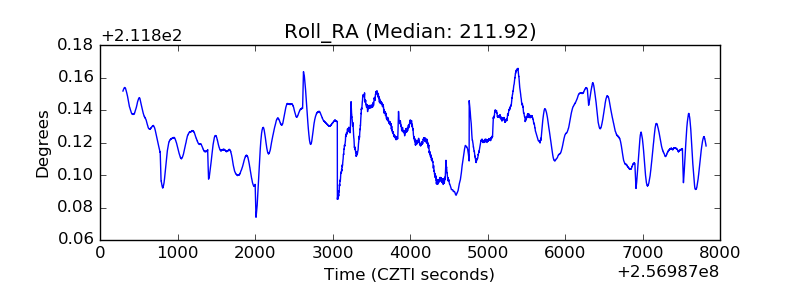 |
| Veto Counter | 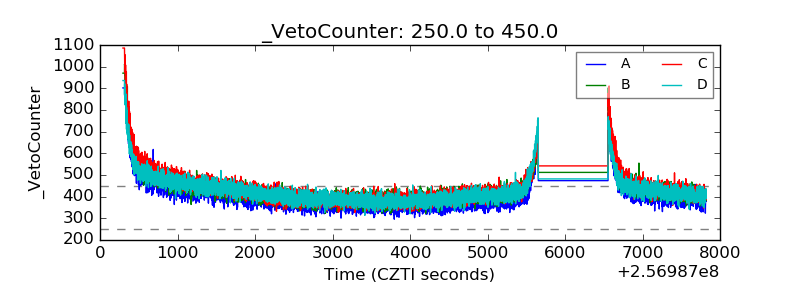 |