| Param | Original file | Final file |
|---|---|---|
| Filename | modeM0/AS1G08_055T01_9000001912_13001cztM0_level2.evt | modeM0/AS1G08_055T01_9000001912_13001cztM0_level2_quad_clean.evt |
| Size (bytes) | 593,190,720 | 87,897,600 |
| Size | 565.7 MB | 83.8 MB |
| Events in quadrant A | 3,710,739 | 551,472 |
| Events in quadrant B | 5,894,809 | 500,219 |
| Events in quadrant C | 3,548,001 | 557,345 |
| Events in quadrant D | 4,301,605 | 529,731 |
| Mode M9 | |||
|---|---|---|---|
| Quadrant | BADHDUFLAG | Total packets | Discarded packets |
| A | 0 | 6 | 0 |
| B | 0 | 6 | 0 |
| C | 0 | 6 | 0 |
| D | 0 | 7 | 0 |
| Mode SS | |||
|---|---|---|---|
| Quadrant | BADHDUFLAG | Total packets | Discarded packets |
| A | 0 | 154 | 0 |
| B | 0 | 154 | 0 |
| C | 0 | 154 | 0 |
| D | 0 | 154 | 0 |
| Mode M0 | |||
|---|---|---|---|
| Quadrant | BADHDUFLAG | Total packets | Discarded packets |
| A | 0 | 15762 | 3 |
| B | 0 | 22256 | 2 |
| C | 0 | 15712 | 2 |
| D | 0 | 17958 | 2 |
| Quadrant | Total seconds | Saturated seconds | Saturation percentage |
|---|---|---|---|
| A | 7508 | 207 | 2.757059% |
| B | 7508 | 1136 | 15.130527% |
| C | 7508 | 163 | 2.171018% |
| D | 7508 | 308 | 4.102291% |
Noise dominated data is calculated using 1-second bins in cleaned event files. If a bin has >2000 counts, and if more than 50% of those come from <1% of pixels, then it is considered to be noise-dominated and hence unusable.
| Quadrant | # 1 sec bins | Bins with >0 counts | Bins with >2000 counts | High rate bins dominated by noise | Noise dominated (total time) | Noise dominated (detector-on time) | Marked lightcurve |
|---|---|---|---|---|---|---|---|
| A | 7989 | 7511 | 1 | 1 | 0.01% | 0.01% | 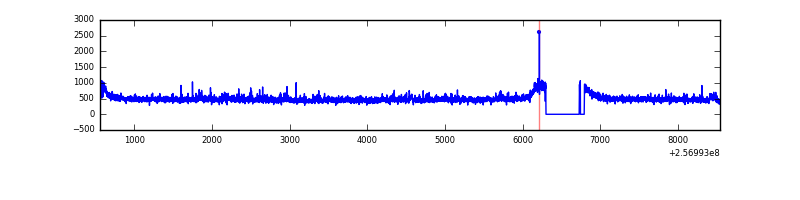 |
| B | 7989 | 7511 | 599 | 599 | 7.50% | 7.97% | 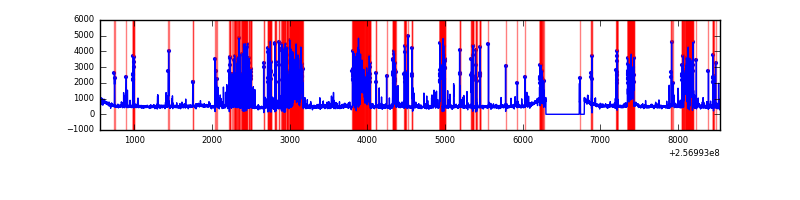 |
| C | 7989 | 7511 | 11 | 11 | 0.14% | 0.15% | 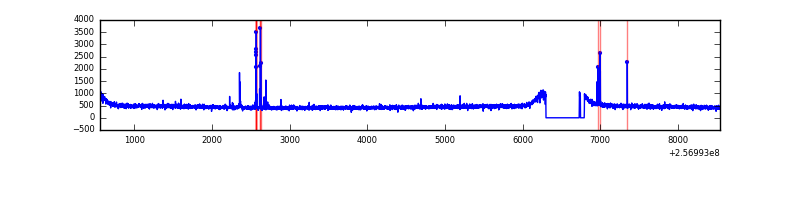 |
| D | 7989 | 7511 | 110 | 110 | 1.38% | 1.46% | 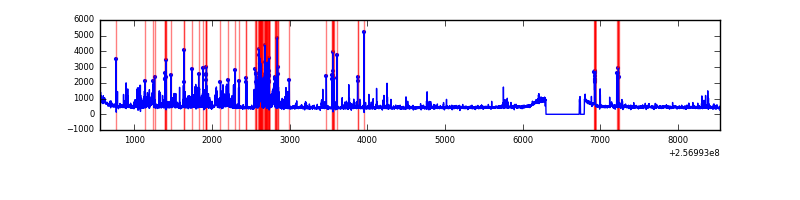 |
Top three noisy pixels from each quadrant. If the there are fewer than three noisy pixels in the level2.evt file, extra rows are filled as -1
| Pixel properties | Quadrant properties | ||||||
|---|---|---|---|---|---|---|---|
| Quadrant | DetID | PixID | Counts | Sigma | Mean | Median | Sigma |
| A | 12 | 189 | 111739 | 605.29 | 907 | 886 | 183.1 |
| A | 1 | 162 | 43914 | 234.94 | 907 | 886 | 183.1 |
| A | 1 | 178 | 17437 | 90.37 | 907 | 886 | 183.1 |
| B | 4 | 239 | 2194513 | 13871.2 | 836 | 814 | 158.1 |
| B | 3 | 64 | 186572 | 1174.59 | 836 | 814 | 158.1 |
| B | 0 | 219 | 134143 | 843.07 | 836 | 814 | 158.1 |
| C | 0 | 207 | 41678 | 197.26 | 892 | 896 | 206.7 |
| C | 14 | 234 | 25395 | 118.5 | 892 | 896 | 206.7 |
| C | 13 | 61 | 6545 | 27.32 | 892 | 896 | 206.7 |
| D | 1 | 52 | 908452 | 4253.59 | 884 | 857 | 213.4 |
| D | 8 | 195 | 35955 | 164.49 | 884 | 857 | 213.4 |
| D | 2 | 234 | 28934 | 131.59 | 884 | 857 | 213.4 |
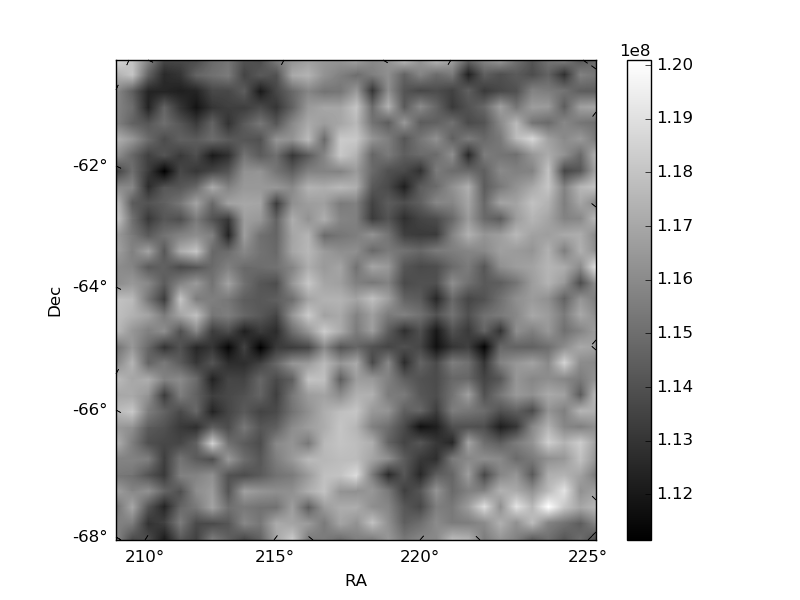
Histogram calculated using DETX and DETY for each event in the final _common_clean file
| Quadrant A | 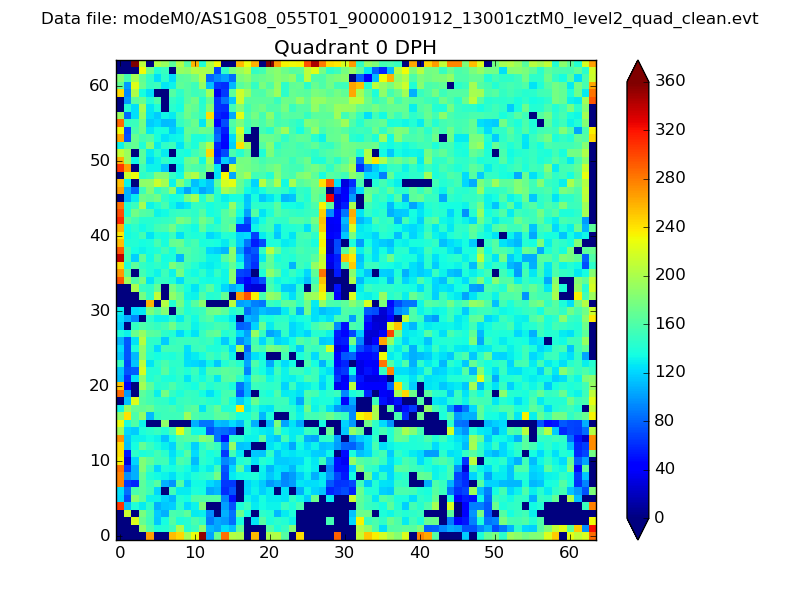 |
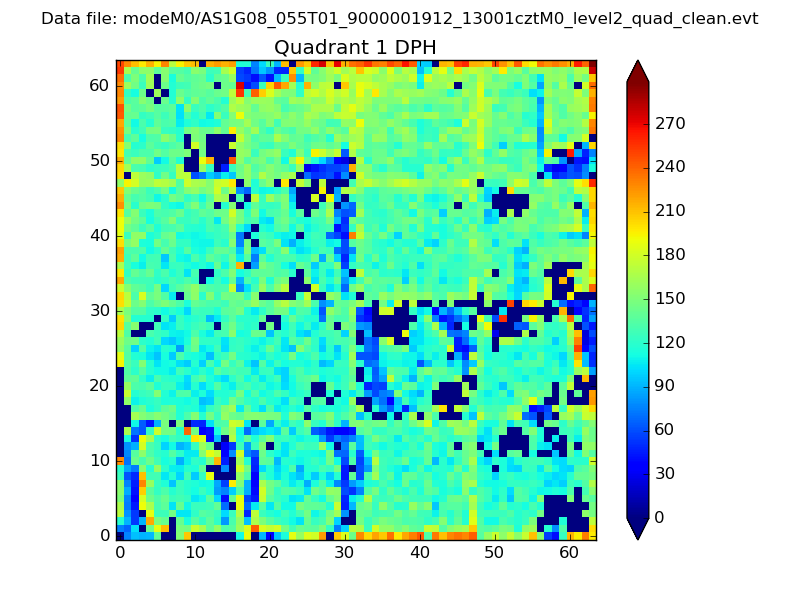 |
Quadrant B |
|---|---|---|---|
| Quadrant D | 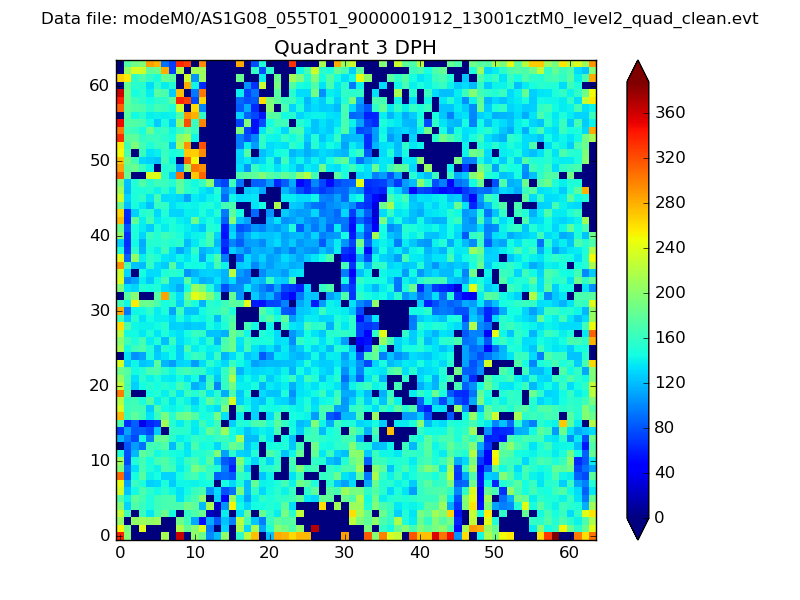 |
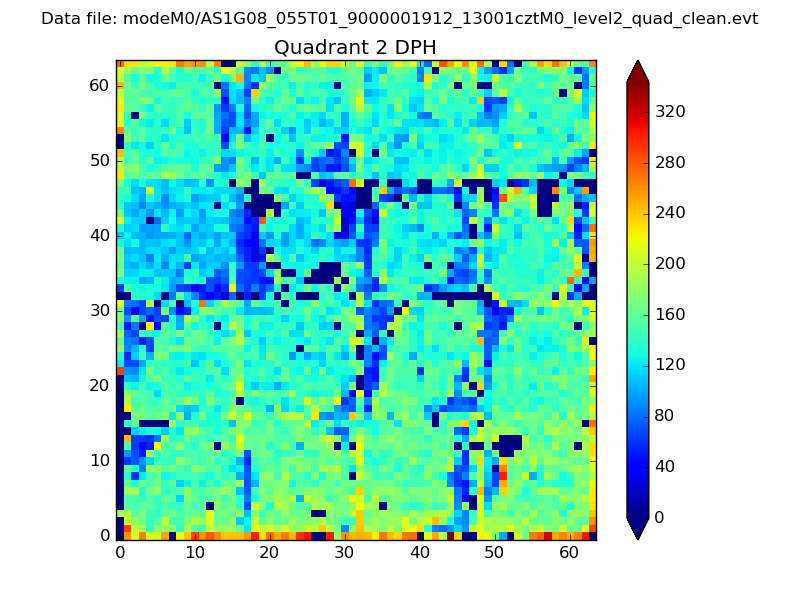 |
Quadrant C |
| Plot type | Count rate plots | Images |
|---|---|---|
| Comparison with Poisson distribution Blue bars denote a histogram of data divided into 1 sec bins. Red curve is a Poisson curve with rate = median count rate of data. |
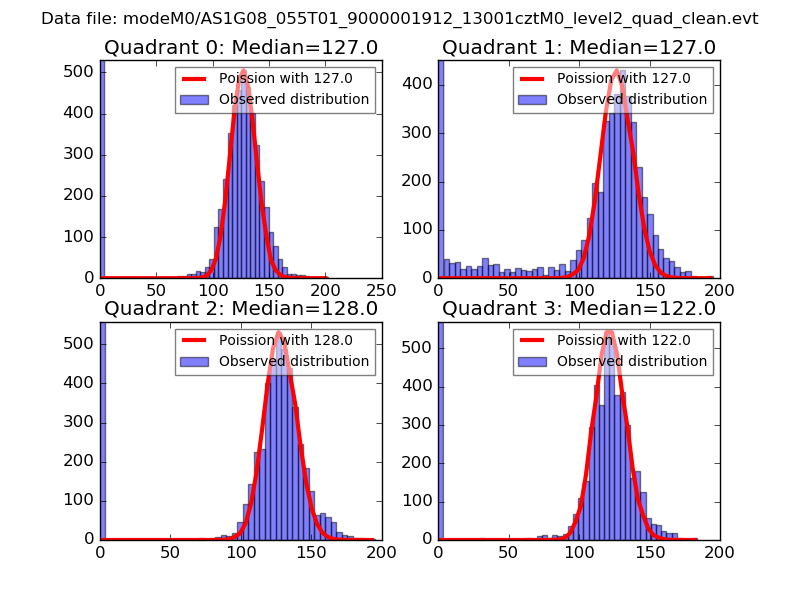 |
 |
| Quadrant-wise count rates Data is divided into 100 sec bins |
 |
|
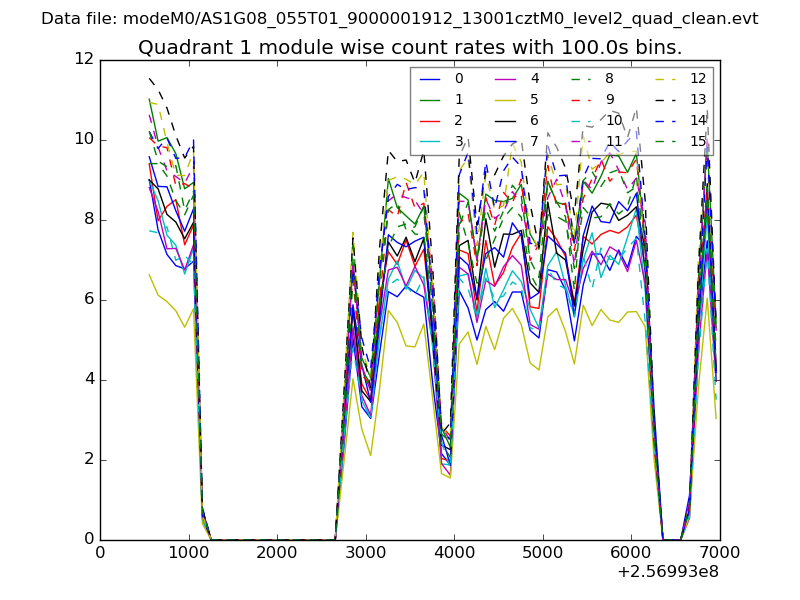
| Module-wise count rates for Quadrant A Data is divided into 100 sec bins |
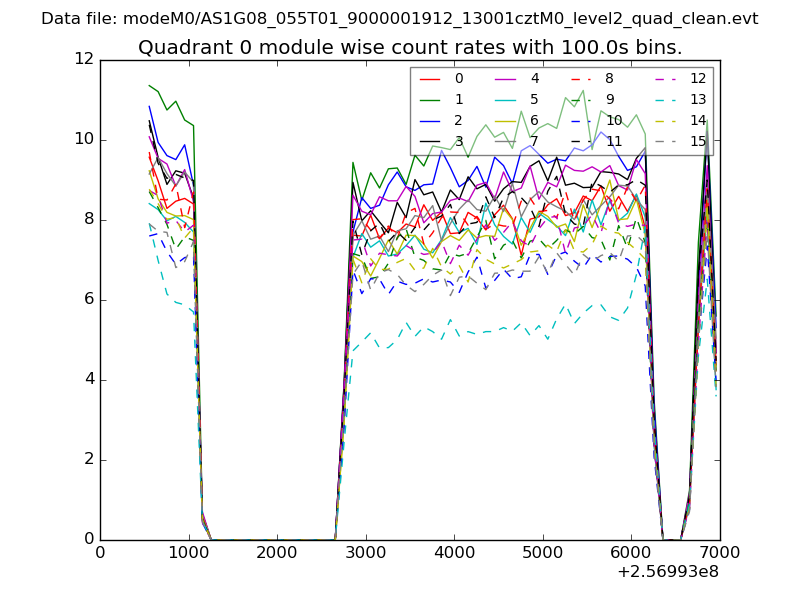 |
 |
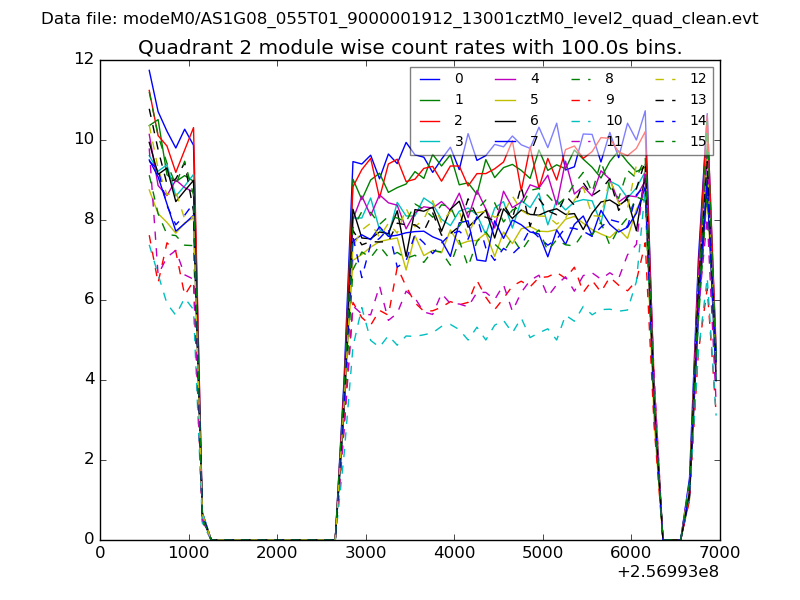
| Module-wise count rates for Quadrant B Data is divided into 100 sec bins |
 |
 |
| Module-wise count rates for Quadrant C Data is divided into 100 sec bins |
 |
 |
| Module-wise count rates for Quadrant D Data is divided into 100 sec bins |
 |
 |
| Parameter | Plot |
|---|---|
| CZT HV Monitor | 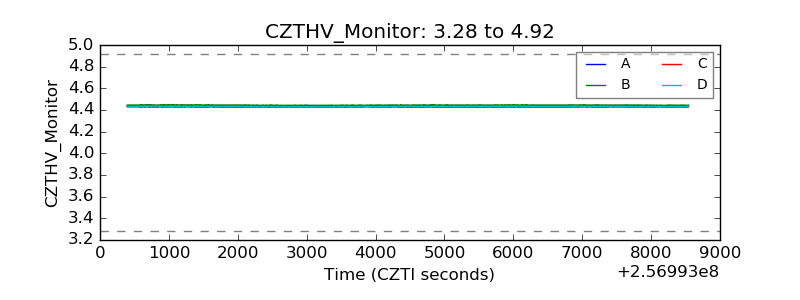 |
| D_VDD |  |
| Temperature 1 | 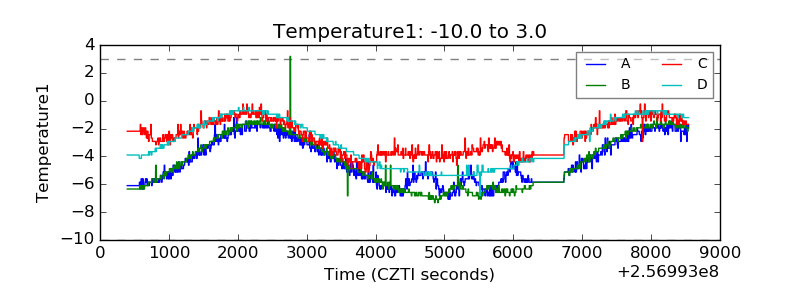 |
| Veto HV Monitor | 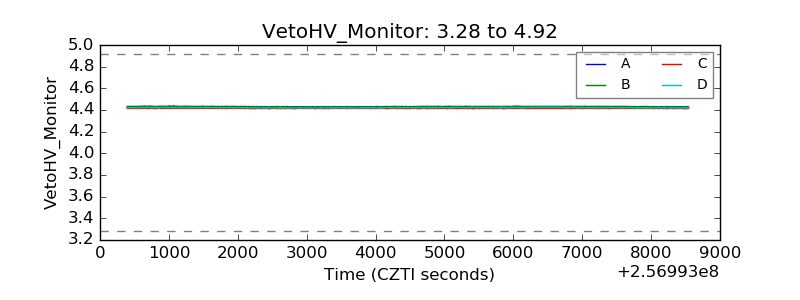 |
| Veto LLD |  |
| Alpha Counter | 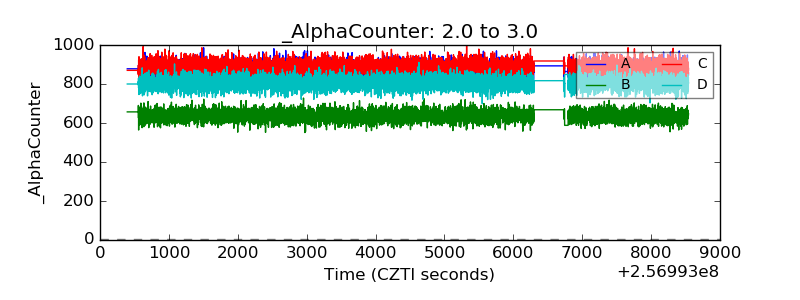 |
| _CPM_Rate | 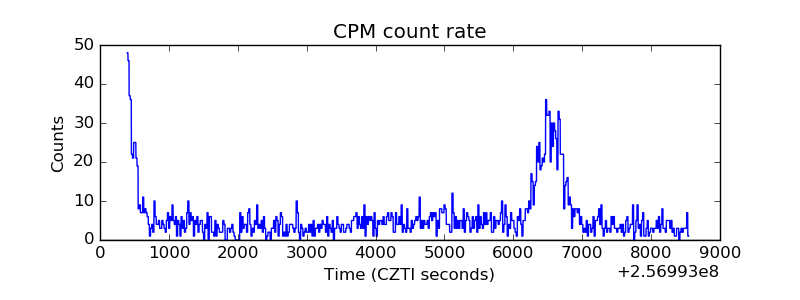 |
| CZT Counter |  |
| +2.5 Volts monitor |  |
| +5 Volts monitor |  |
| _ROLL_ROT | 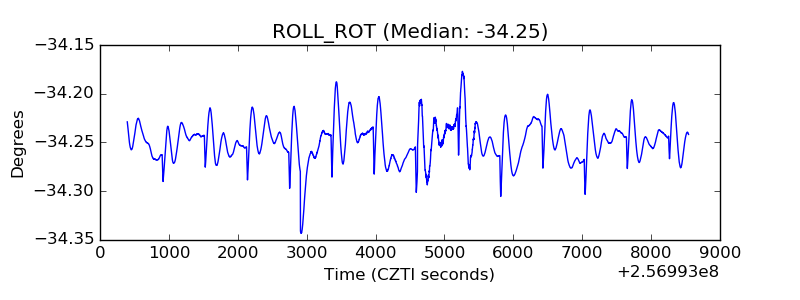 |
| _Roll_DEC | 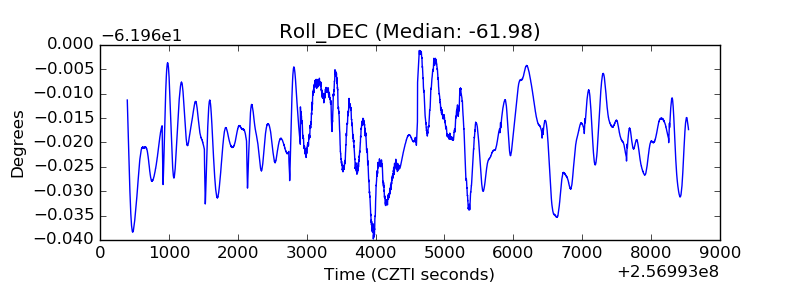 |
| _Roll_RA | 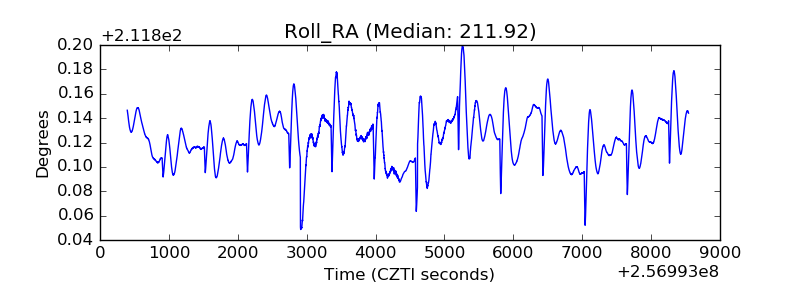 |
| Veto Counter | 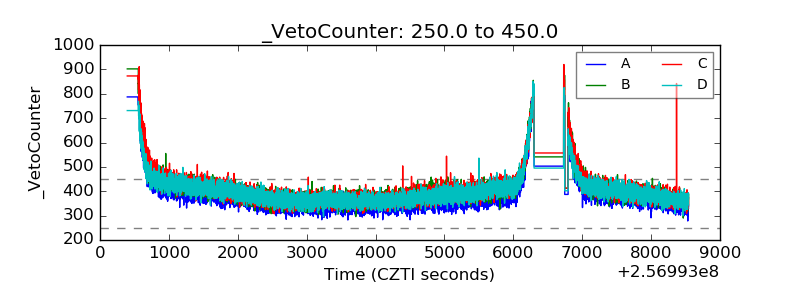 |