| Param | Original file | Final file |
|---|---|---|
| Filename | modeM0/AS1G08_055T01_9000001912_13002cztM0_level2.evt | modeM0/AS1G08_055T01_9000001912_13002cztM0_level2_quad_clean.evt |
| Size (bytes) | 610,741,440 | 89,870,400 |
| Size | 582.4 MB | 85.7 MB |
| Events in quadrant A | 3,854,522 | 567,550 |
| Events in quadrant B | 6,309,087 | 508,586 |
| Events in quadrant C | 3,549,028 | 570,551 |
| Events in quadrant D | 4,260,737 | 538,255 |
| Mode M9 | |||
|---|---|---|---|
| Quadrant | BADHDUFLAG | Total packets | Discarded packets |
| A | 0 | 7 | 0 |
| B | 0 | 7 | 0 |
| C | 0 | 7 | 0 |
| D | 0 | 7 | 0 |
| Mode SS | |||
|---|---|---|---|
| Quadrant | BADHDUFLAG | Total packets | Discarded packets |
| A | 0 | 156 | 0 |
| B | 0 | 156 | 0 |
| C | 0 | 156 | 0 |
| D | 0 | 156 | 0 |
| Mode M0 | |||
|---|---|---|---|
| Quadrant | BADHDUFLAG | Total packets | Discarded packets |
| A | 0 | 16406 | 3 |
| B | 0 | 23672 | 2 |
| C | 0 | 15959 | 2 |
| D | 0 | 17925 | 2 |
| Quadrant | Total seconds | Saturated seconds | Saturation percentage |
|---|---|---|---|
| A | 7715 | 111 | 1.438756% |
| B | 7715 | 1296 | 16.798445% |
| C | 7715 | 50 | 0.648088% |
| D | 7715 | 225 | 2.916397% |
Noise dominated data is calculated using 1-second bins in cleaned event files. If a bin has >2000 counts, and if more than 50% of those come from <1% of pixels, then it is considered to be noise-dominated and hence unusable.
| Quadrant | # 1 sec bins | Bins with >0 counts | Bins with >2000 counts | High rate bins dominated by noise | Noise dominated (total time) | Noise dominated (detector-on time) | Marked lightcurve |
|---|---|---|---|---|---|---|---|
| A | 8056 | 7718 | 6 | 6 | 0.07% | 0.08% | 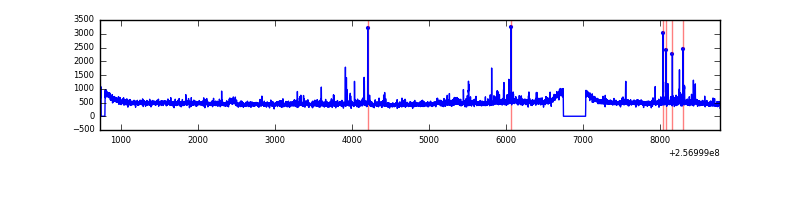 |
| B | 8055 | 7717 | 736 | 736 | 9.14% | 9.54% |  |
| C | 8056 | 7718 | 4 | 4 | 0.05% | 0.05% | 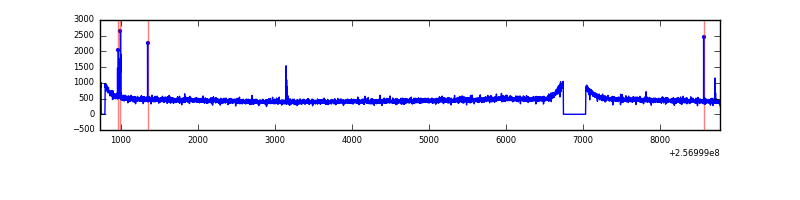 |
| D | 8056 | 7718 | 150 | 150 | 1.86% | 1.94% | 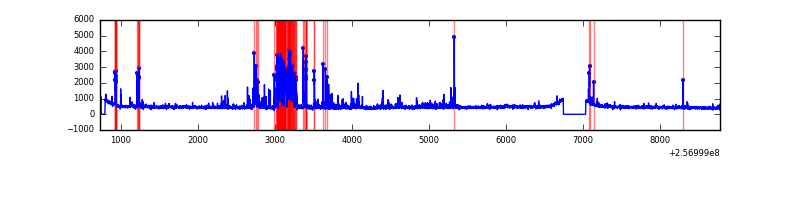 |
Top three noisy pixels from each quadrant. If the there are fewer than three noisy pixels in the level2.evt file, extra rows are filled as -1
| Pixel properties | Quadrant properties | ||||||
|---|---|---|---|---|---|---|---|
| Quadrant | DetID | PixID | Counts | Sigma | Mean | Median | Sigma |
| A | 12 | 189 | 182233 | 963.21 | 919 | 897 | 188.3 |
| A | 9 | 143 | 59486 | 311.21 | 919 | 897 | 188.3 |
| A | 1 | 162 | 38550 | 200.0 | 919 | 897 | 188.3 |
| B | 4 | 239 | 2511865 | 15932.67 | 834 | 813 | 157.6 |
| B | 3 | 64 | 228408 | 1444.09 | 834 | 813 | 157.6 |
| B | 0 | 219 | 77919 | 489.24 | 834 | 813 | 157.6 |
| C | 14 | 234 | 32606 | 153.44 | 899 | 900 | 206.6 |
| C | 13 | 61 | 6594 | 27.55 | 899 | 900 | 206.6 |
| C | 8 | 128 | 4517 | 17.5 | 899 | 900 | 206.6 |
| D | 1 | 52 | 838641 | 3922.13 | 890 | 864 | 213.6 |
| D | 8 | 195 | 48174 | 221.49 | 890 | 864 | 213.6 |
| D | 2 | 234 | 32778 | 149.41 | 890 | 864 | 213.6 |
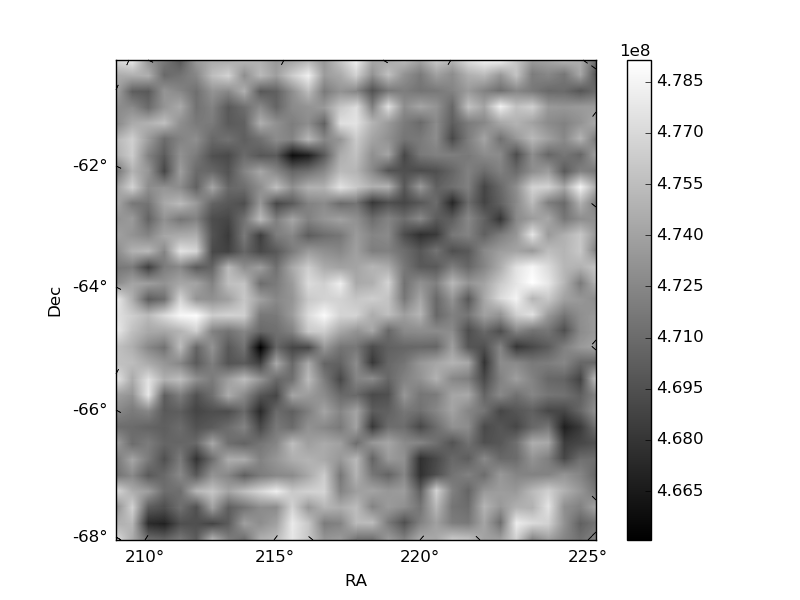
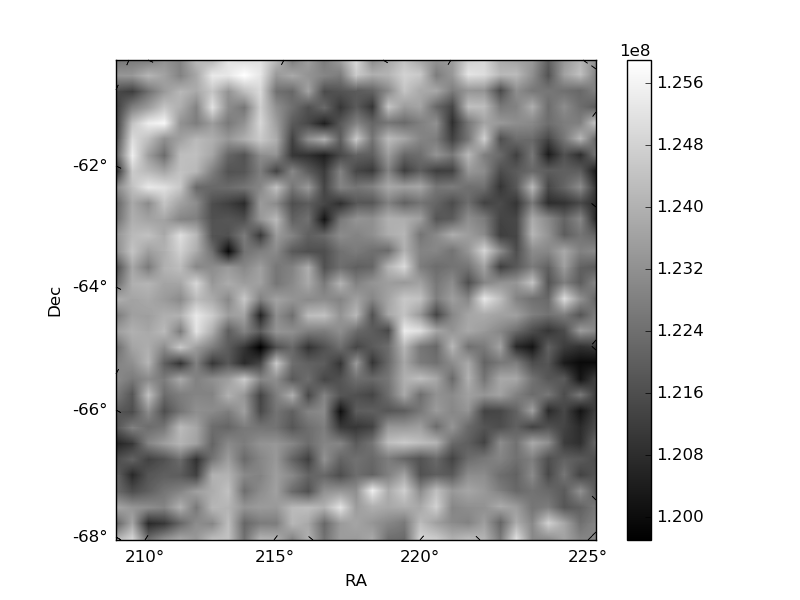
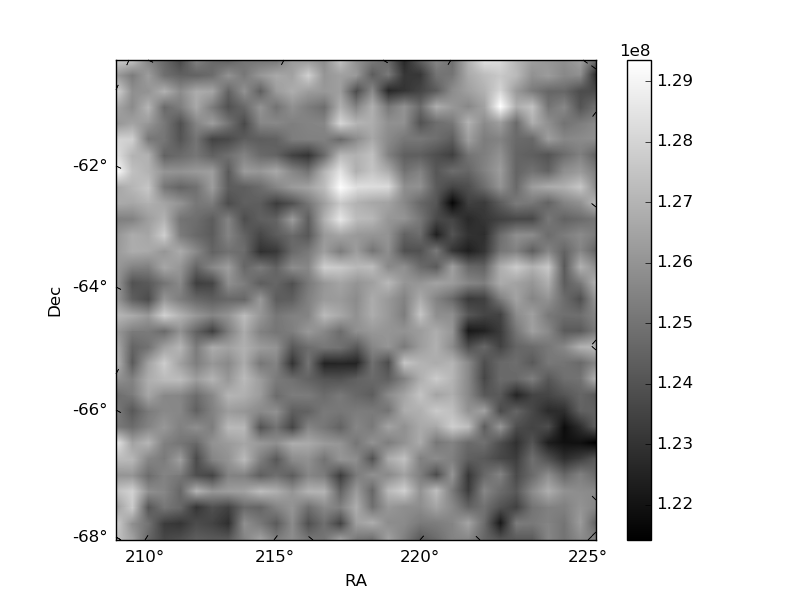
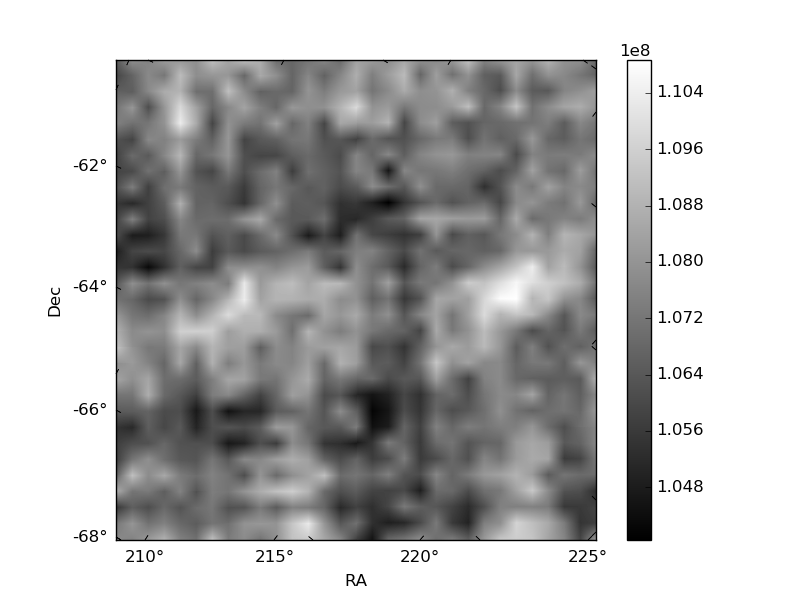
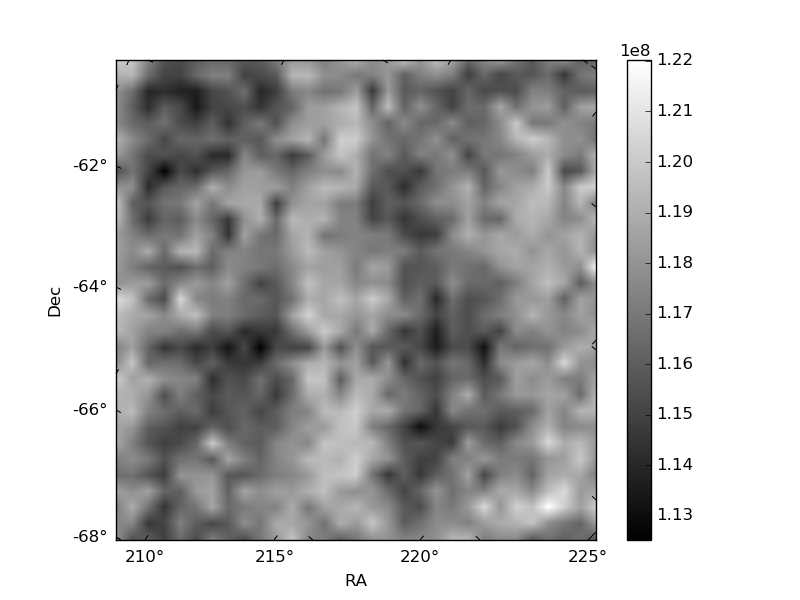
Histogram calculated using DETX and DETY for each event in the final _common_clean file
| Quadrant A | 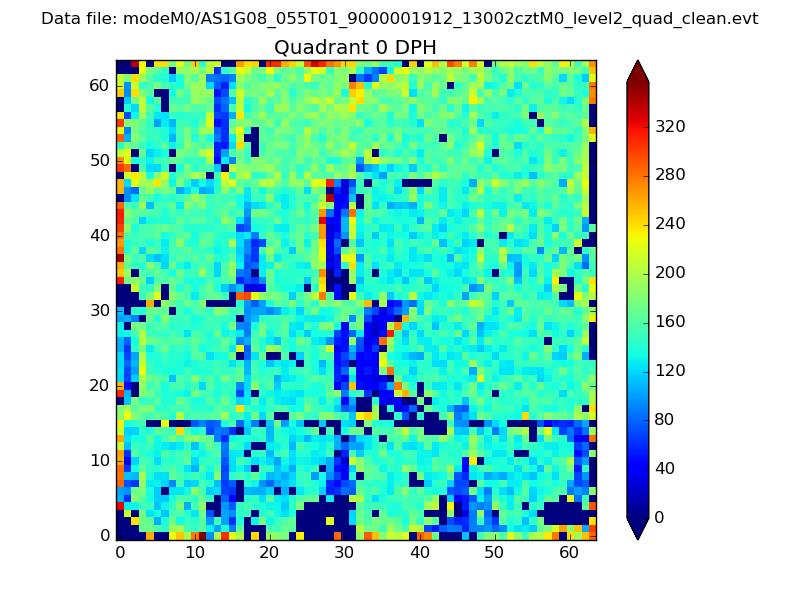 |
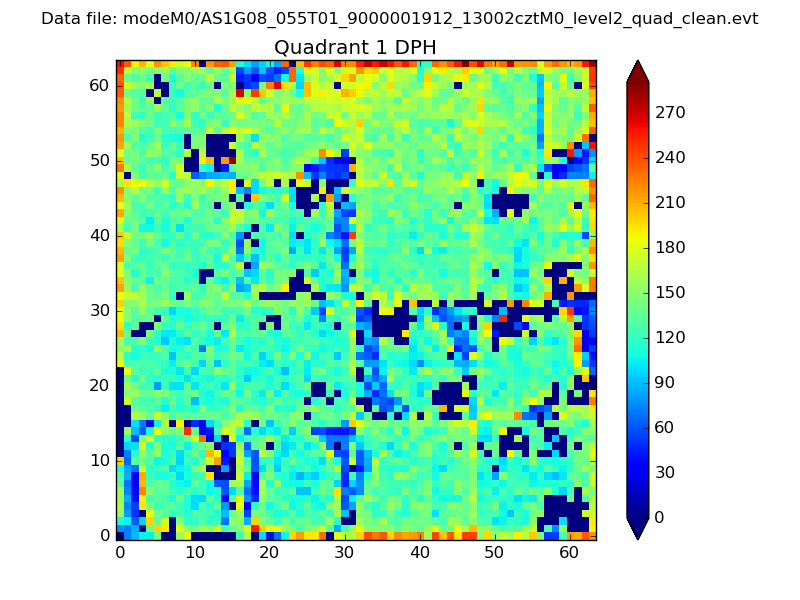 |
Quadrant B |
|---|---|---|---|
| Quadrant D | 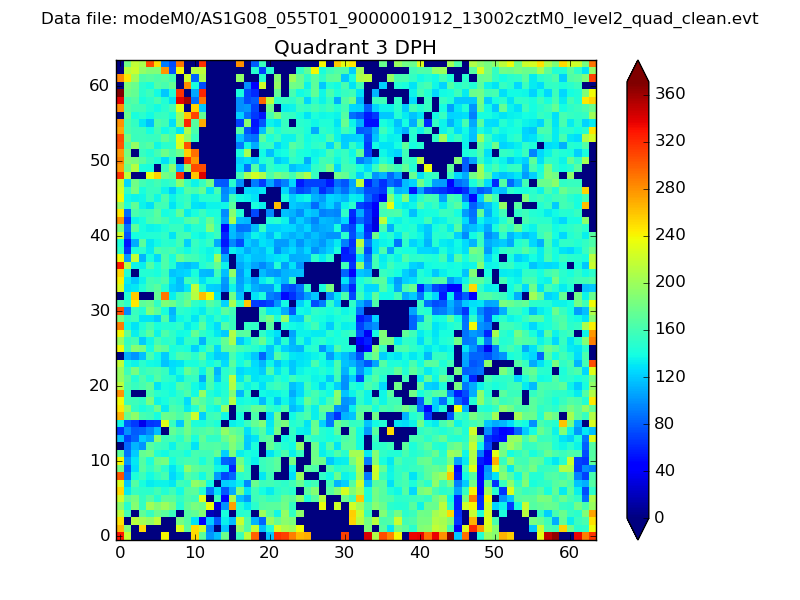 |
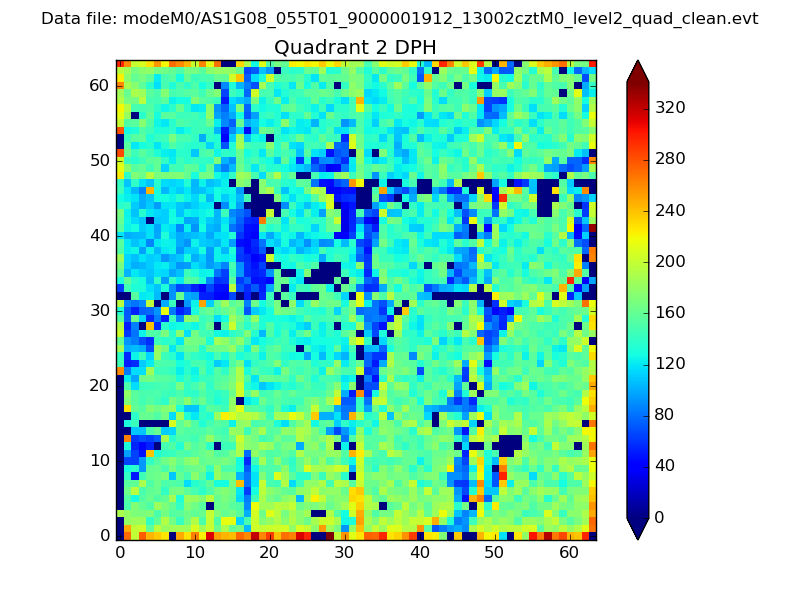 |
Quadrant C |
| Plot type | Count rate plots | Images |
|---|---|---|
| Comparison with Poisson distribution Blue bars denote a histogram of data divided into 1 sec bins. Red curve is a Poisson curve with rate = median count rate of data. |
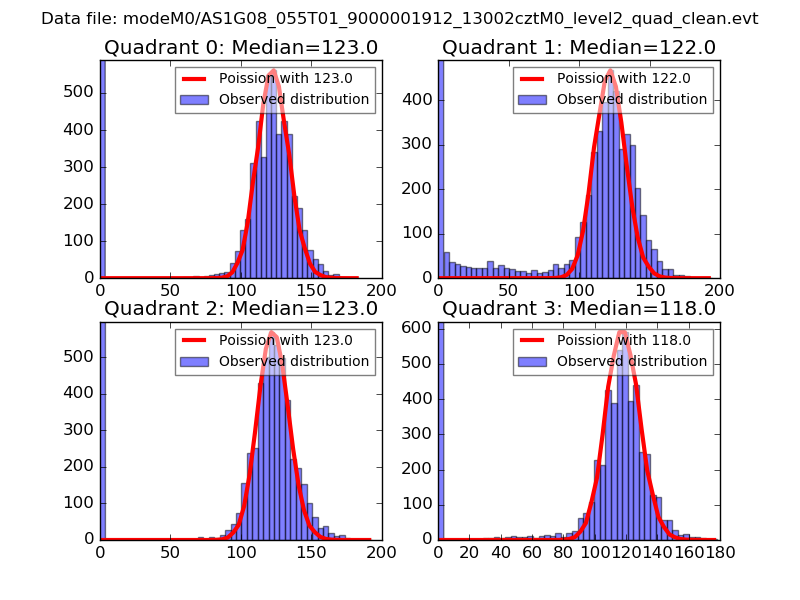 |
 |
| Quadrant-wise count rates Data is divided into 100 sec bins |
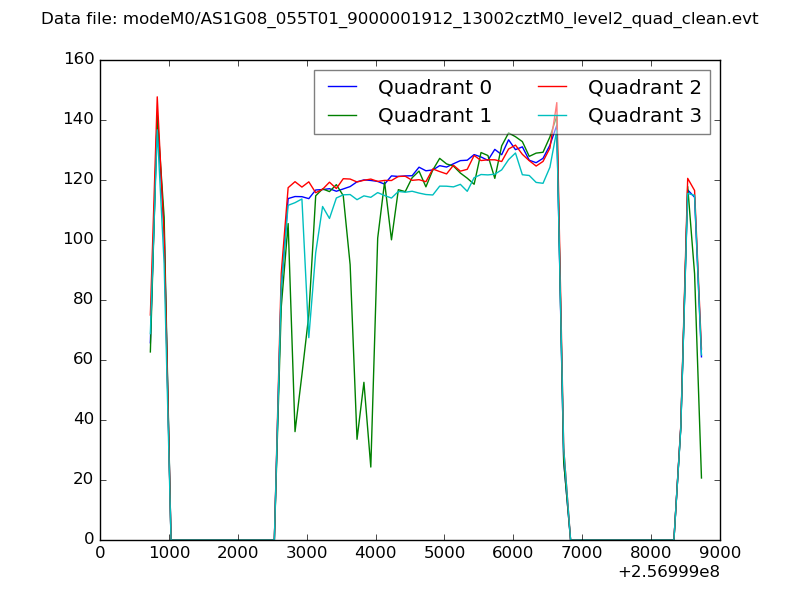 |
|
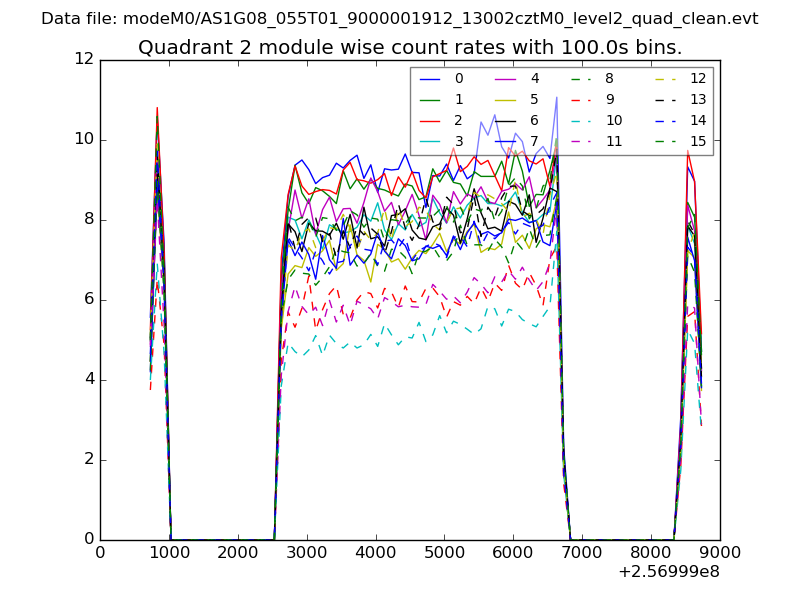
| Module-wise count rates for Quadrant A Data is divided into 100 sec bins |
 |
 |
| Module-wise count rates for Quadrant B Data is divided into 100 sec bins |
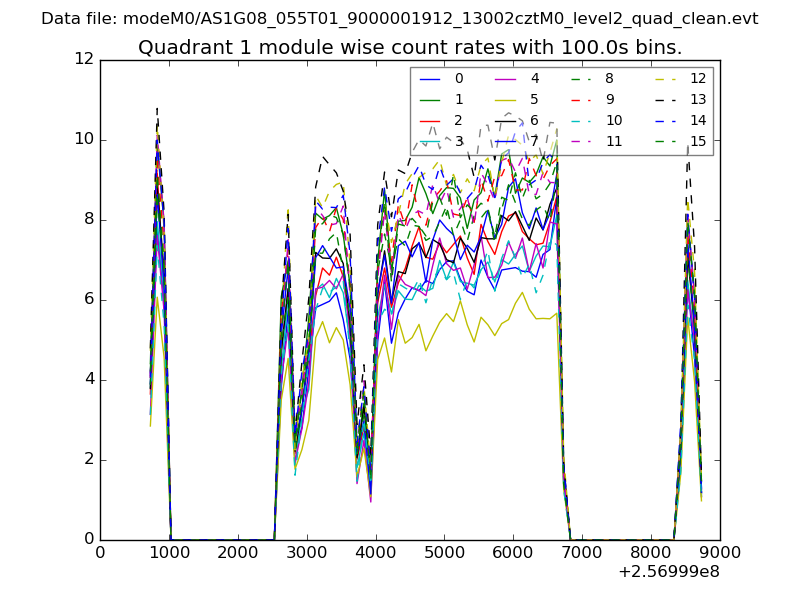 |
 |
| Module-wise count rates for Quadrant C Data is divided into 100 sec bins |
 |
 |
| Module-wise count rates for Quadrant D Data is divided into 100 sec bins |
 |
 |
| Parameter | Plot |
|---|---|
| CZT HV Monitor | 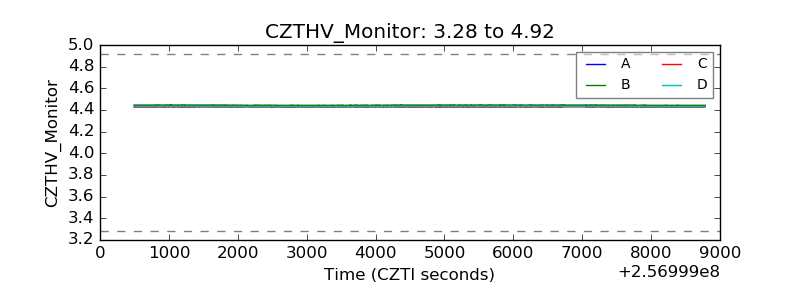 |
| D_VDD | 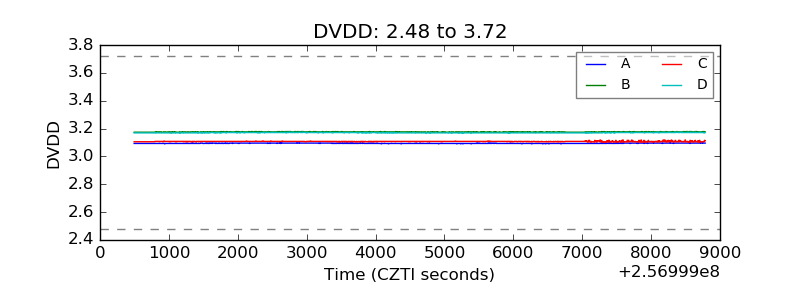 |
| Temperature 1 | 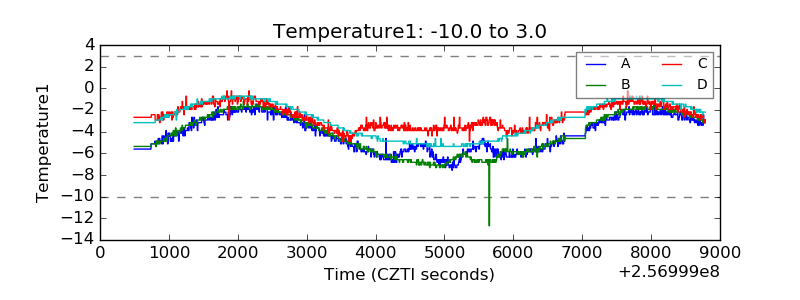 |
| Veto HV Monitor | 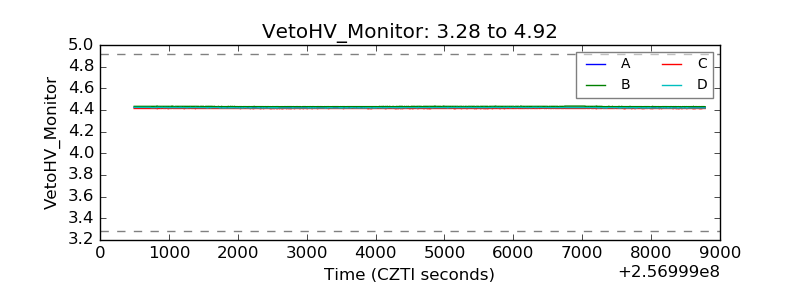 |
| Veto LLD |  |
| Alpha Counter | 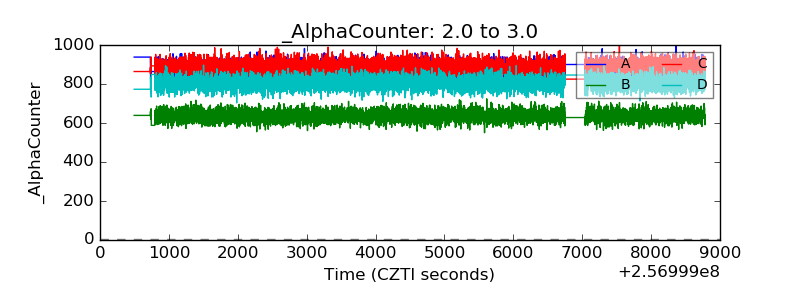 |
| _CPM_Rate | 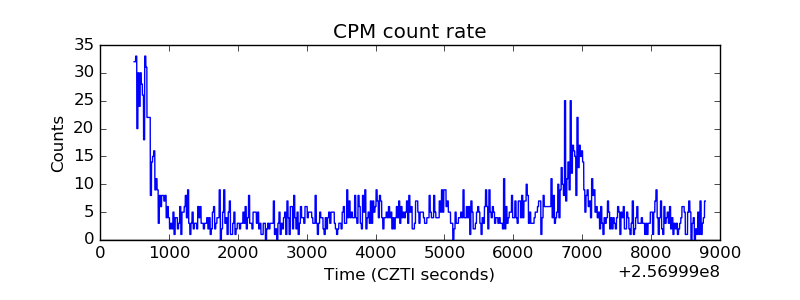 |
| CZT Counter | 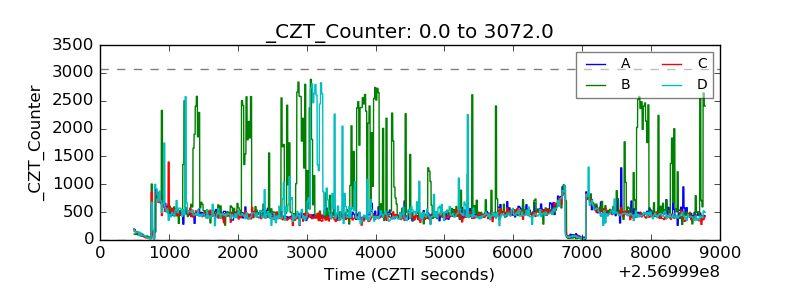 |
| +2.5 Volts monitor |  |
| +5 Volts monitor |  |
| _ROLL_ROT |  |
| _Roll_DEC | 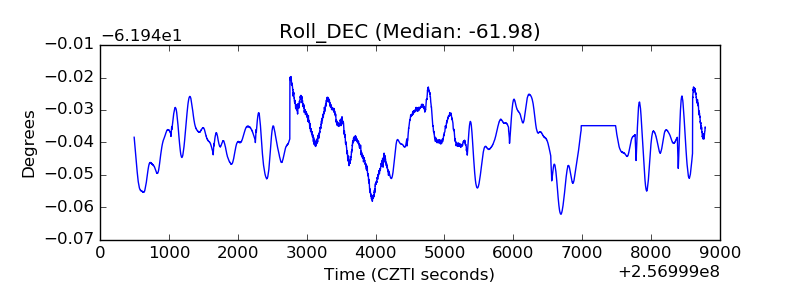 |
| _Roll_RA | 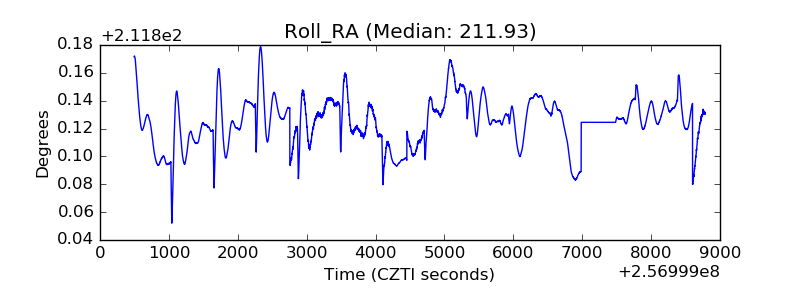 |
| Veto Counter |  |