| Param | Original file | Final file |
|---|---|---|
| Filename | modeM0/AS1G08_055T01_9000001912_13003cztM0_level2.evt | modeM0/AS1G08_055T01_9000001912_13003cztM0_level2_quad_clean.evt |
| Size (bytes) | 558,506,880 | 91,238,400 |
| Size | 532.6 MB | 87.0 MB |
| Events in quadrant A | 3,694,852 | 583,049 |
| Events in quadrant B | 5,630,971 | 536,771 |
| Events in quadrant C | 3,250,891 | 583,871 |
| Events in quadrant D | 3,845,609 | 554,529 |
| Mode M9 | |||
|---|---|---|---|
| Quadrant | BADHDUFLAG | Total packets | Discarded packets |
| A | 0 | 3 | 0 |
| B | 0 | 3 | 0 |
| C | 0 | 3 | 0 |
| D | 0 | 3 | 0 |
| Mode SS | |||
|---|---|---|---|
| Quadrant | BADHDUFLAG | Total packets | Discarded packets |
| A | 0 | 148 | 0 |
| B | 0 | 148 | 0 |
| C | 0 | 148 | 0 |
| D | 0 | 148 | 0 |
| Mode M0 | |||
|---|---|---|---|
| Quadrant | BADHDUFLAG | Total packets | Discarded packets |
| A | 0 | 15649 | 2 |
| B | 0 | 21452 | 1 |
| C | 0 | 14800 | 1 |
| D | 0 | 16522 | 1 |
| Quadrant | Total seconds | Saturated seconds | Saturation percentage |
|---|---|---|---|
| A | 7242 | 144 | 1.988401% |
| B | 7242 | 1034 | 14.277824% |
| C | 7242 | 54 | 0.745650% |
| D | 7242 | 224 | 3.093068% |
Noise dominated data is calculated using 1-second bins in cleaned event files. If a bin has >2000 counts, and if more than 50% of those come from <1% of pixels, then it is considered to be noise-dominated and hence unusable.
| Quadrant | # 1 sec bins | Bins with >0 counts | Bins with >2000 counts | High rate bins dominated by noise | Noise dominated (total time) | Noise dominated (detector-on time) | Marked lightcurve |
|---|---|---|---|---|---|---|---|
| A | 7513 | 7244 | 21 | 21 | 0.28% | 0.29% | 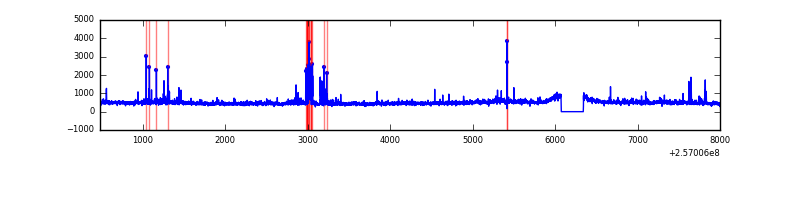 |
| B | 7513 | 7244 | 579 | 579 | 7.71% | 7.99% | 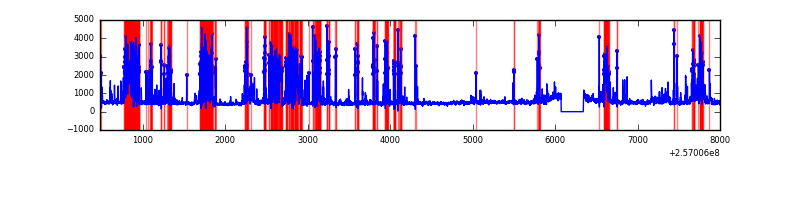 |
| C | 7513 | 7244 | 1 | 1 | 0.01% | 0.01% |  |
| D | 7513 | 7244 | 160 | 160 | 2.13% | 2.21% | 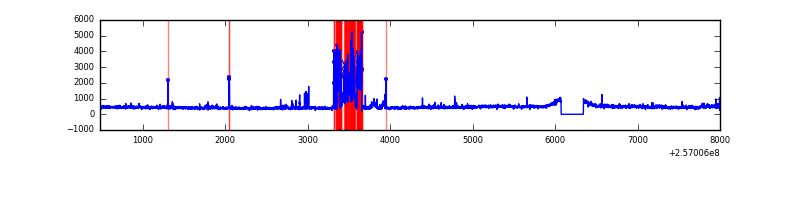 |
Top three noisy pixels from each quadrant. If the there are fewer than three noisy pixels in the level2.evt file, extra rows are filled as -1
| Pixel properties | Quadrant properties | ||||||
|---|---|---|---|---|---|---|---|
| Quadrant | DetID | PixID | Counts | Sigma | Mean | Median | Sigma |
| A | 12 | 189 | 94977 | 547.87 | 846 | 827 | 171.8 |
| A | 15 | 223 | 75225 | 432.93 | 846 | 827 | 171.8 |
| A | 1 | 162 | 67269 | 386.64 | 846 | 827 | 171.8 |
| B | 4 | 239 | 1999655 | 13464.05 | 784 | 763 | 148.5 |
| B | 3 | 64 | 298806 | 2007.54 | 784 | 763 | 148.5 |
| B | 0 | 85 | 96170 | 642.64 | 784 | 763 | 148.5 |
| C | 8 | 128 | 10333 | 49.66 | 827 | 830 | 191.4 |
| C | 14 | 234 | 7604 | 35.4 | 827 | 830 | 191.4 |
| C | 8 | 112 | 5976 | 26.89 | 827 | 830 | 191.4 |
| D | 1 | 52 | 688371 | 3486.9 | 818 | 793 | 197.2 |
| D | 8 | 195 | 50071 | 249.9 | 818 | 793 | 197.2 |
| D | 2 | 234 | 32835 | 162.49 | 818 | 793 | 197.2 |
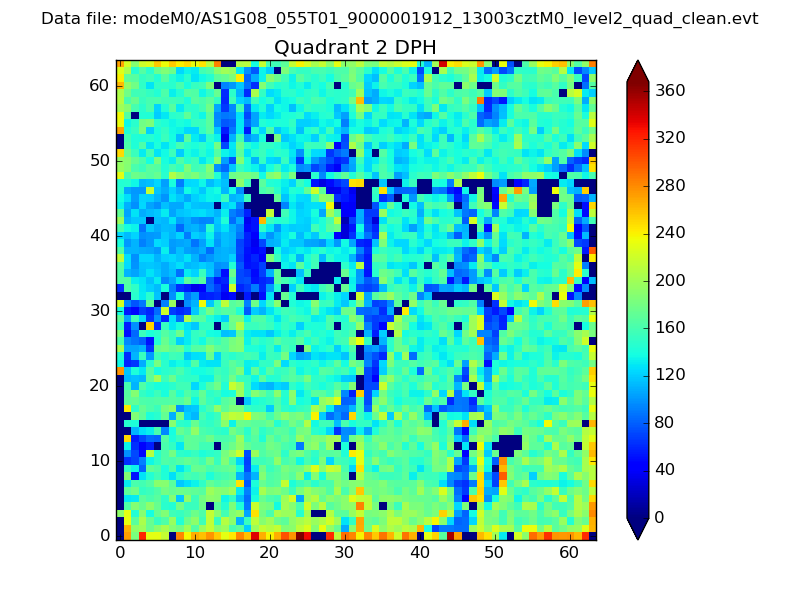
Histogram calculated using DETX and DETY for each event in the final _common_clean file
| Quadrant A | 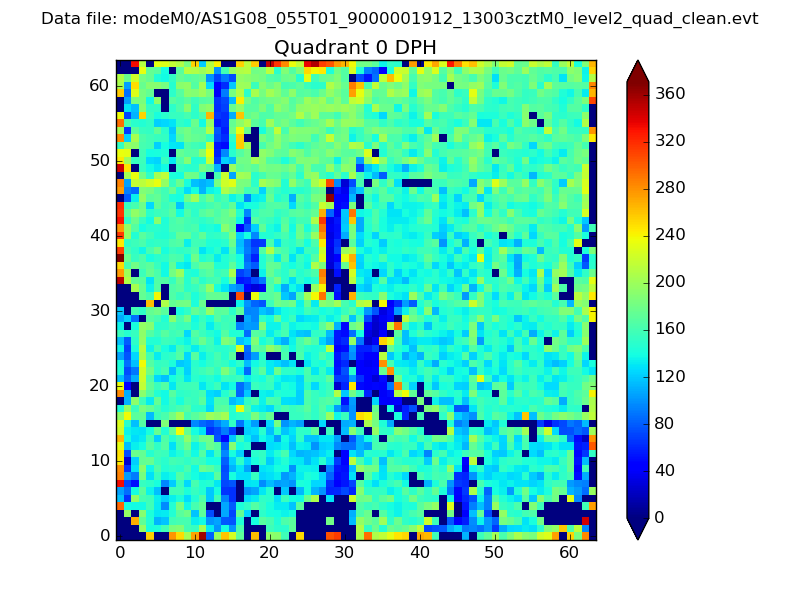 |
 |
Quadrant B |
|---|---|---|---|
| Quadrant D | 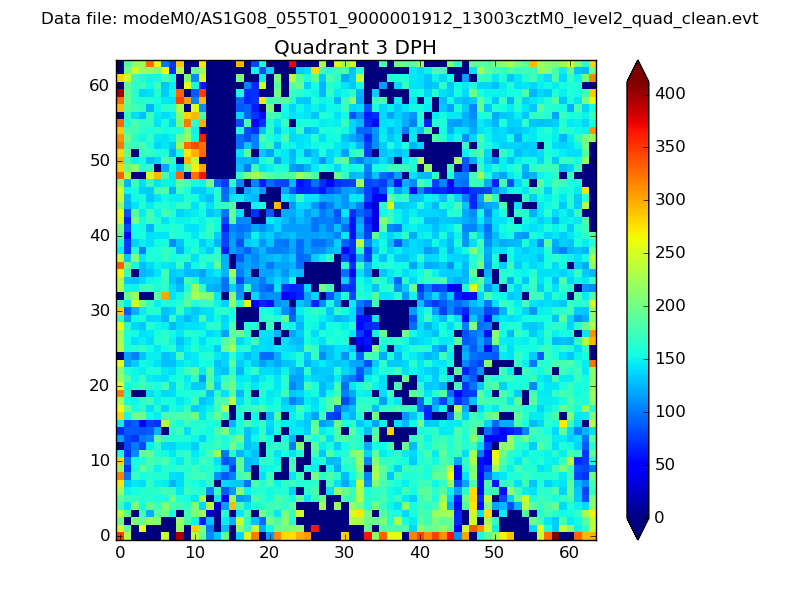 |
 |
Quadrant C |
| Plot type | Count rate plots | Images |
|---|---|---|
| Comparison with Poisson distribution Blue bars denote a histogram of data divided into 1 sec bins. Red curve is a Poisson curve with rate = median count rate of data. |
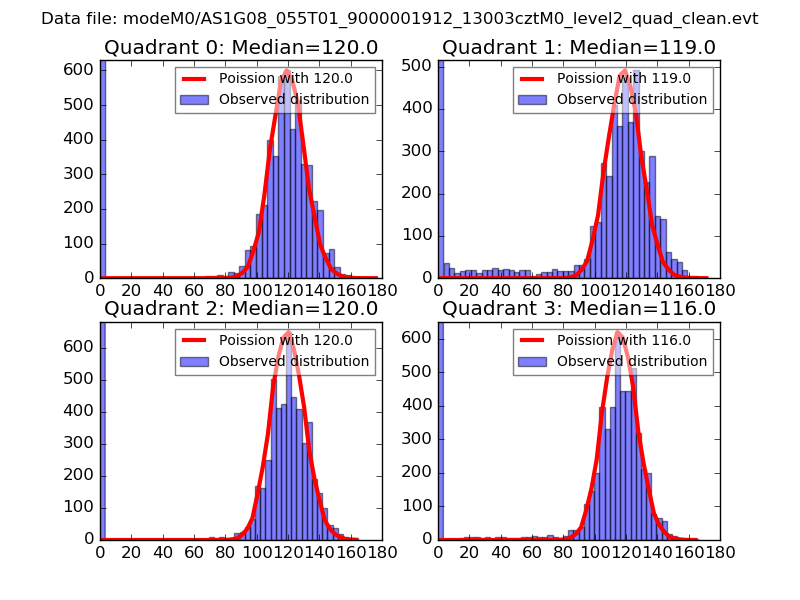 |
 |
| Quadrant-wise count rates Data is divided into 100 sec bins |
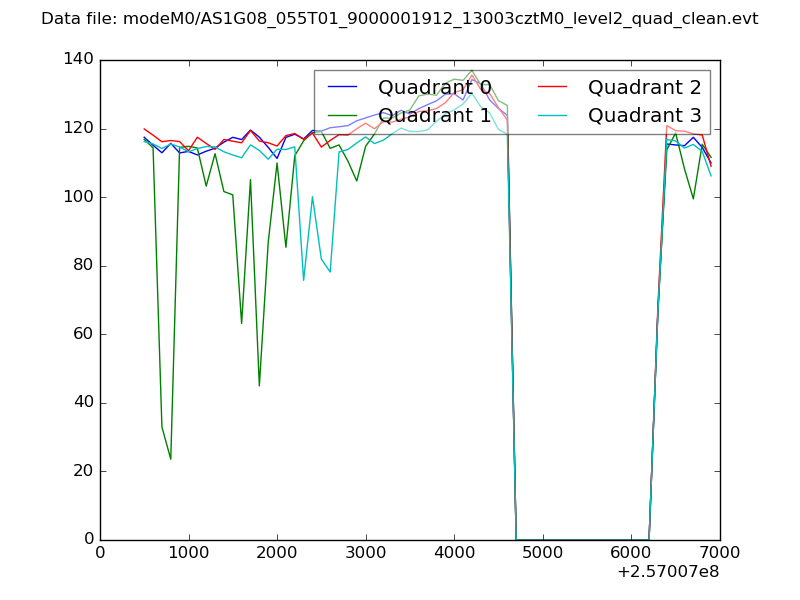 |
|
| Module-wise count rates for Quadrant A Data is divided into 100 sec bins |
 |
 |
| Module-wise count rates for Quadrant B Data is divided into 100 sec bins |
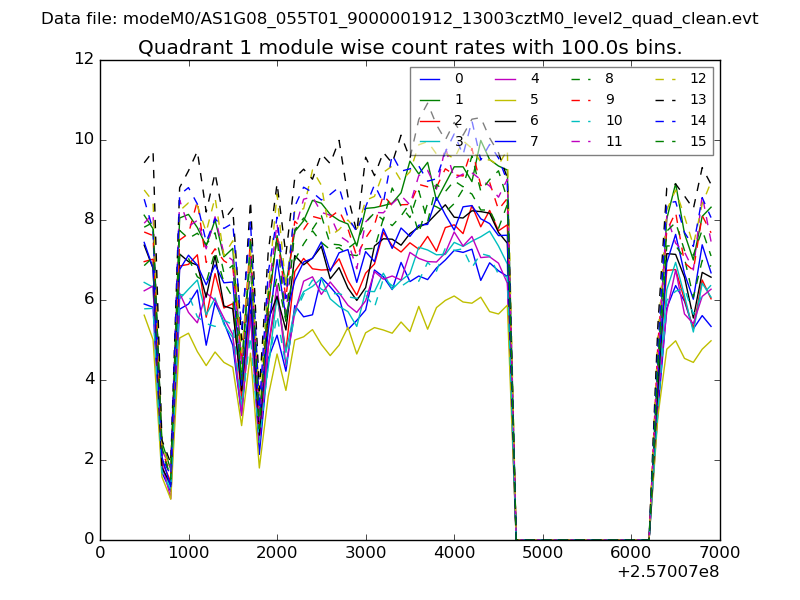 |
 |
| Module-wise count rates for Quadrant C Data is divided into 100 sec bins |
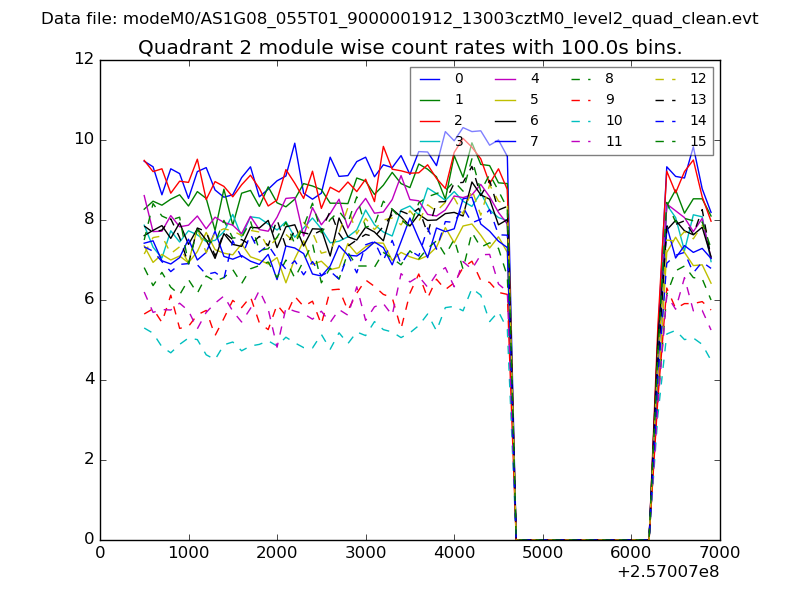 |
 |
| Module-wise count rates for Quadrant D Data is divided into 100 sec bins |
 |
 |
| Parameter | Plot |
|---|---|
| CZT HV Monitor |  |
| D_VDD | 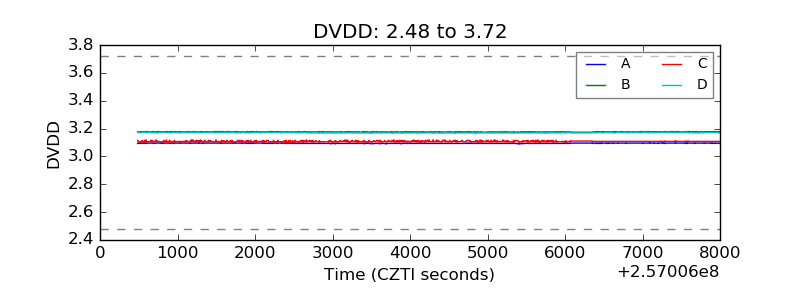 |
| Temperature 1 |  |
| Veto HV Monitor | 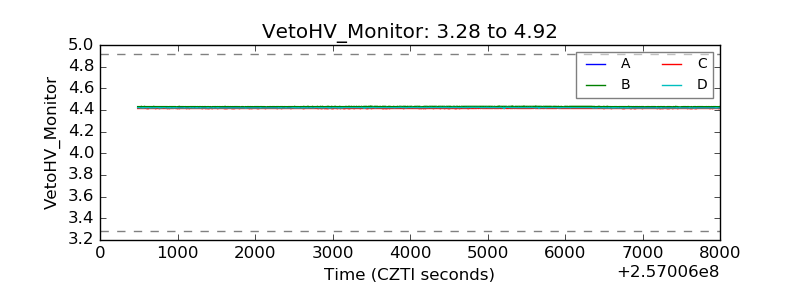 |
| Veto LLD | 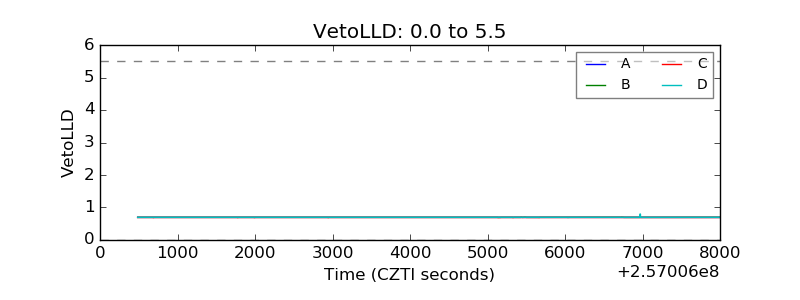 |
| Alpha Counter | 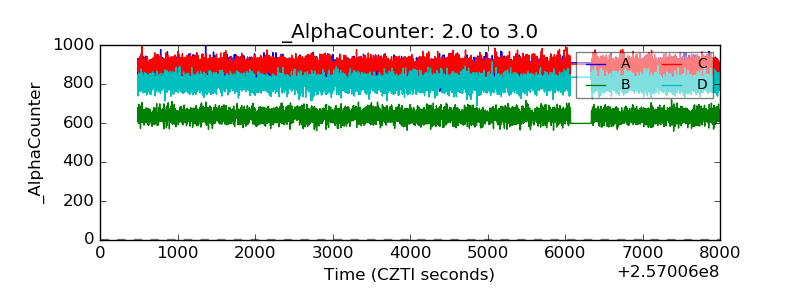 |
| _CPM_Rate | 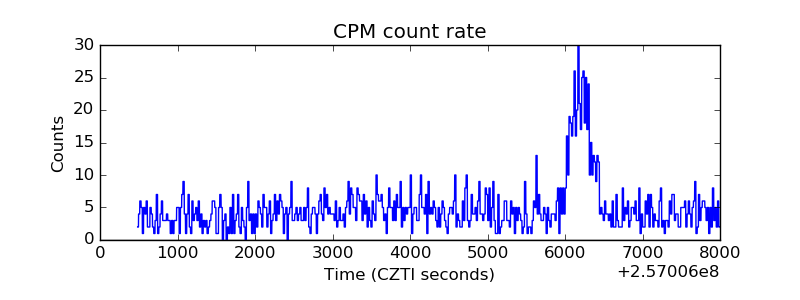 |
| CZT Counter | 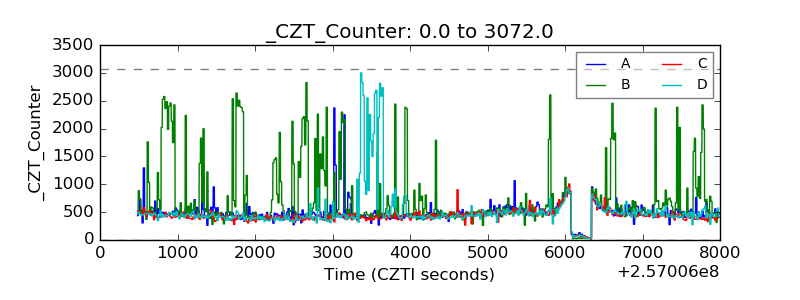 |
| +2.5 Volts monitor |  |
| +5 Volts monitor |  |
| _ROLL_ROT | 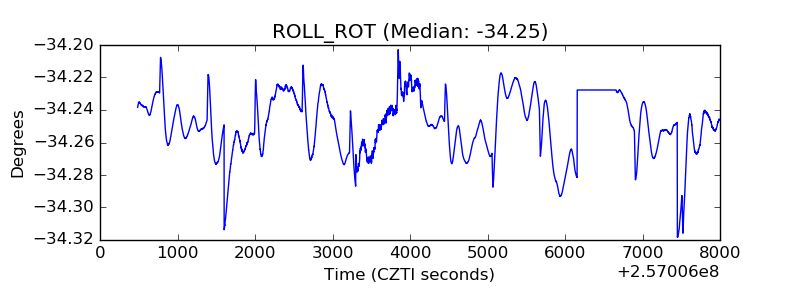 |
| _Roll_DEC |  |
| _Roll_RA | 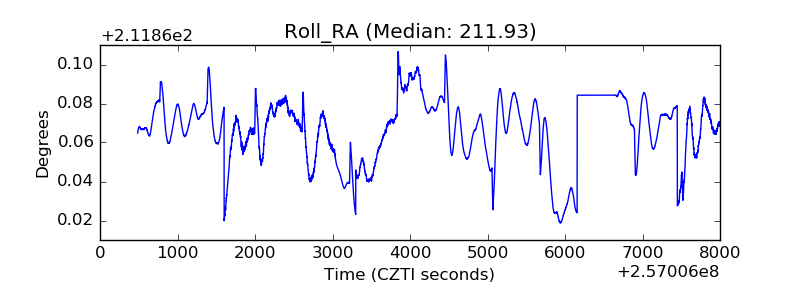 |
| Veto Counter | 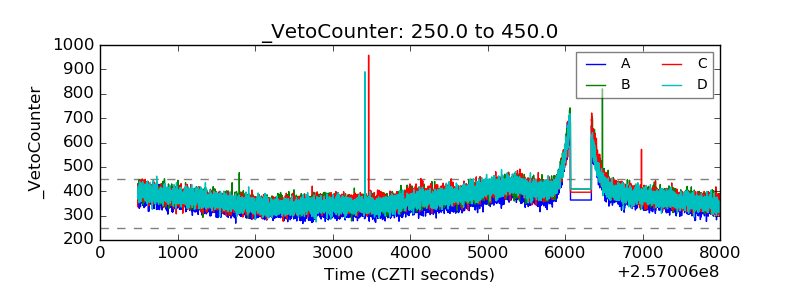 |