| Param | Original file | Final file |
|---|---|---|
| Filename | modeM0/AS1G08_055T01_9000001912_13006cztM0_level2.evt | modeM0/AS1G08_055T01_9000001912_13006cztM0_level2_quad_clean.evt |
| Size (bytes) | 221,143,680 | 46,054,080 |
| Size | 210.9 MB | 43.9 MB |
| Events in quadrant A | 1,579,399 | 296,851 |
| Events in quadrant B | 2,176,677 | 282,343 |
| Events in quadrant C | 1,334,066 | 297,650 |
| Events in quadrant D | 1,384,564 | 286,857 |
| Mode SS | |||
|---|---|---|---|
| Quadrant | BADHDUFLAG | Total packets | Discarded packets |
| A | 0 | 66 | 0 |
| B | 0 | 66 | 0 |
| C | 0 | 66 | 0 |
| D | 0 | 66 | 0 |
| Mode M0 | |||
|---|---|---|---|
| Quadrant | BADHDUFLAG | Total packets | Discarded packets |
| A | 0 | 6860 | 0 |
| B | 0 | 8630 | 0 |
| C | 0 | 6498 | 0 |
| D | 0 | 6573 | 0 |
| Quadrant | Total seconds | Saturated seconds | Saturation percentage |
|---|---|---|---|
| A | 3240 | 16 | 0.493827% |
| B | 3240 | 209 | 6.450617% |
| C | 3240 | 0 | 0.000000% |
| D | 3240 | 0 | 0.000000% |
Noise dominated data is calculated using 1-second bins in cleaned event files. If a bin has >2000 counts, and if more than 50% of those come from <1% of pixels, then it is considered to be noise-dominated and hence unusable.
| Quadrant | # 1 sec bins | Bins with >0 counts | Bins with >2000 counts | High rate bins dominated by noise | Noise dominated (total time) | Noise dominated (detector-on time) | Marked lightcurve |
|---|---|---|---|---|---|---|---|
| A | 3241 | 3241 | 6 | 6 | 0.19% | 0.19% | 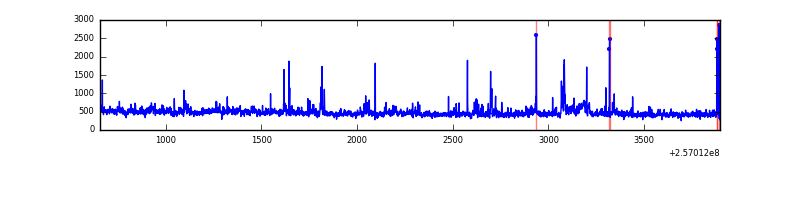 |
| B | 3241 | 3241 | 133 | 133 | 4.10% | 4.10% | 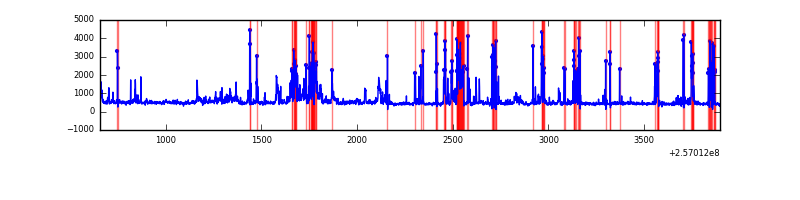 |
| C | 3241 | 3241 | 0 | 0 | 0.00% | 0.00% | 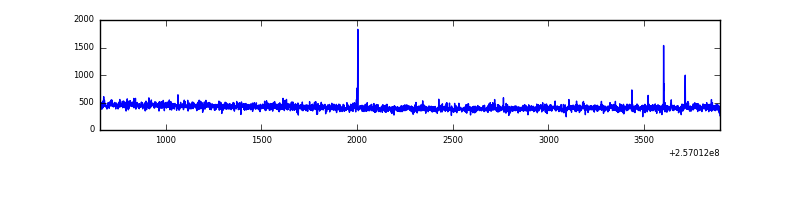 |
| D | 3241 | 3241 | 0 | 0 | 0.00% | 0.00% | 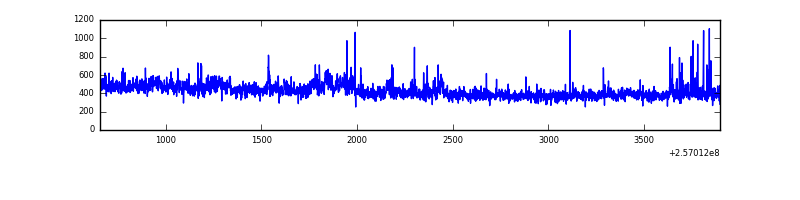 |
Top three noisy pixels from each quadrant. If the there are fewer than three noisy pixels in the level2.evt file, extra rows are filled as -1
| Pixel properties | Quadrant properties | ||||||
|---|---|---|---|---|---|---|---|
| Quadrant | DetID | PixID | Counts | Sigma | Mean | Median | Sigma |
| A | 12 | 189 | 71315 | 961.98 | 353 | 345 | 73.8 |
| A | 15 | 223 | 37577 | 504.67 | 353 | 345 | 73.8 |
| A | 8 | 15 | 28680 | 384.07 | 353 | 345 | 73.8 |
| B | 4 | 239 | 541020 | 8181.85 | 343 | 335 | 66.1 |
| B | 3 | 64 | 181326 | 2738.82 | 343 | 335 | 66.1 |
| B | 3 | 209 | 60282 | 907.14 | 343 | 335 | 66.1 |
| C | 12 | 4 | 7523 | 89.99 | 340 | 342 | 79.8 |
| C | 13 | 61 | 2586 | 28.12 | 340 | 342 | 79.8 |
| C | 14 | 234 | 1169 | 10.36 | 340 | 342 | 79.8 |
| D | 1 | 52 | 58637 | 700.99 | 337 | 327 | 83.2 |
| D | 8 | 195 | 43299 | 516.6 | 337 | 327 | 83.2 |
| D | 2 | 234 | 13101 | 153.57 | 337 | 327 | 83.2 |
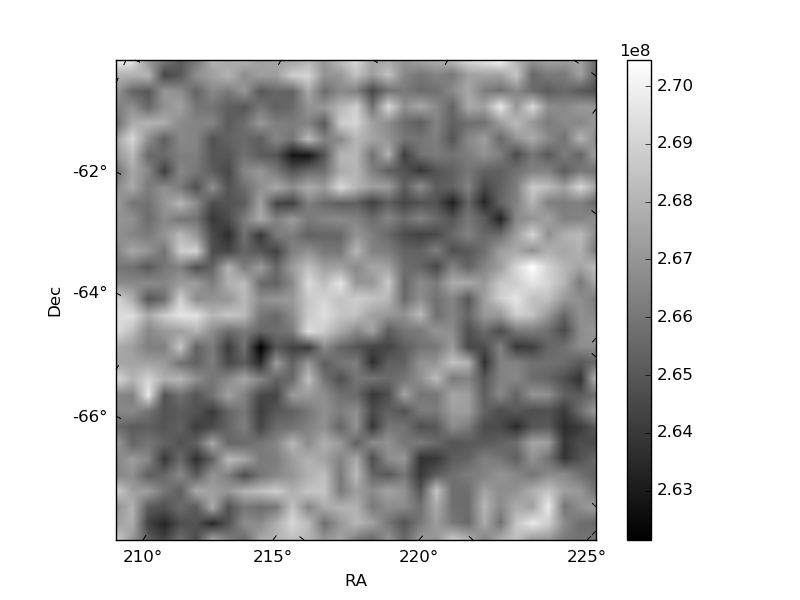
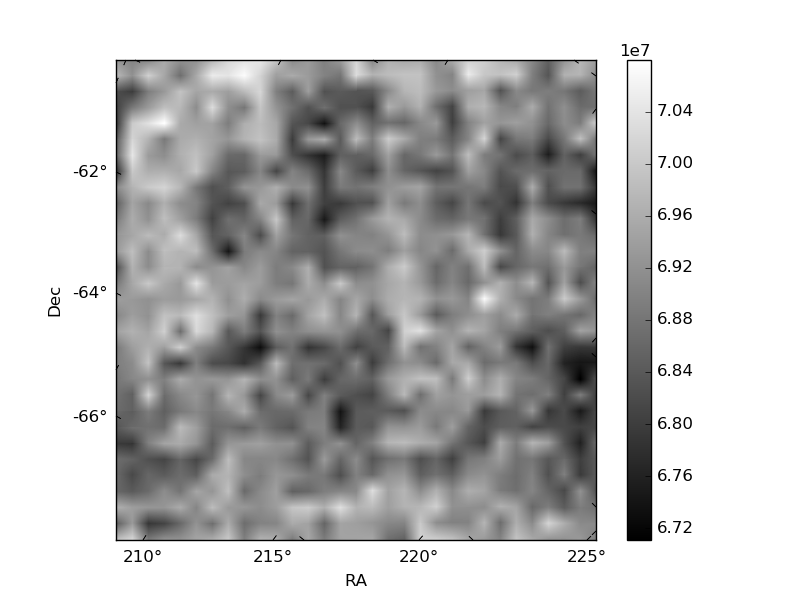
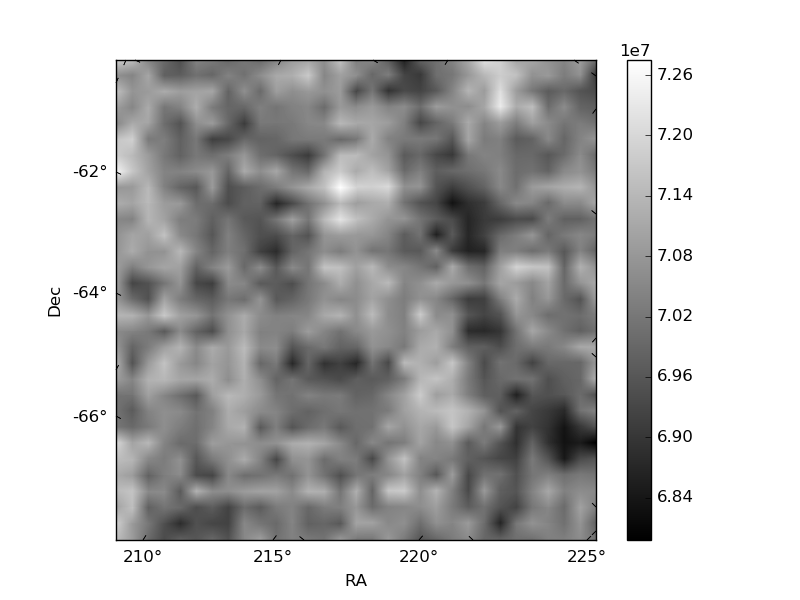
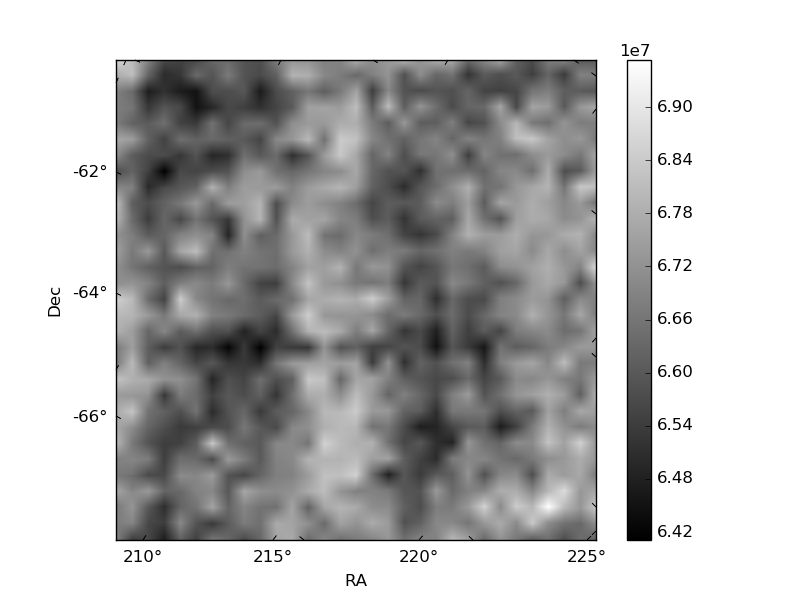
Histogram calculated using DETX and DETY for each event in the final _common_clean file
| Quadrant A | 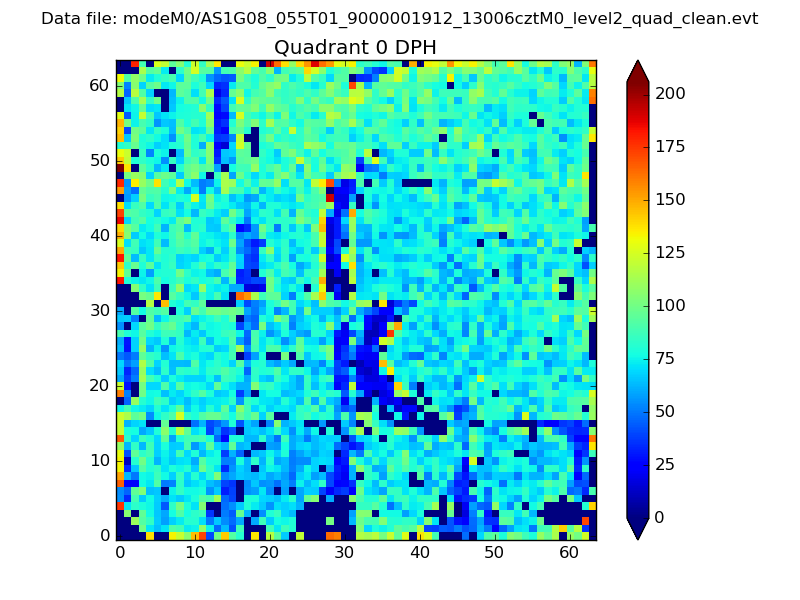 |
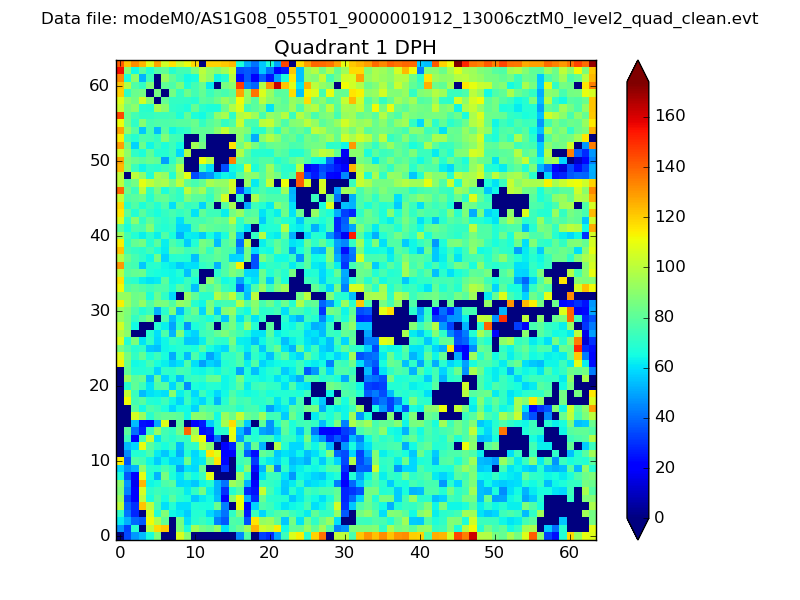 |
Quadrant B |
|---|---|---|---|
| Quadrant D | 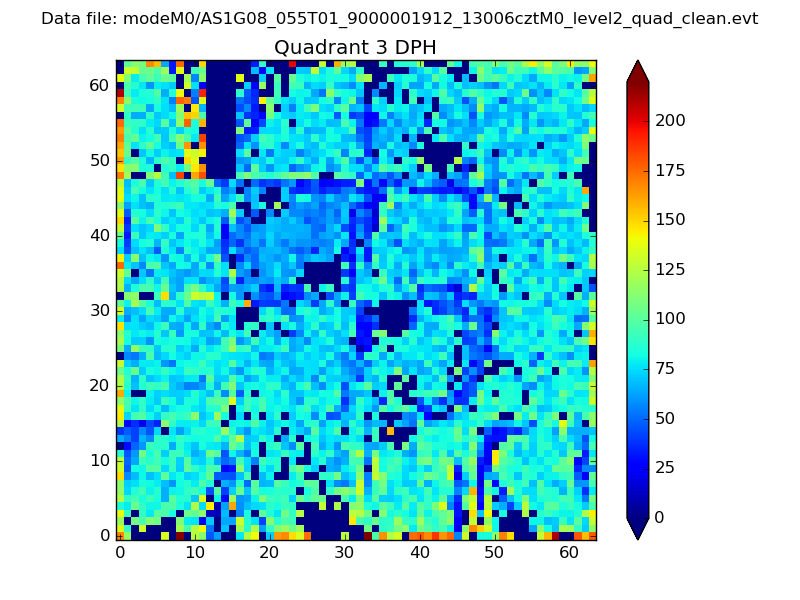 |
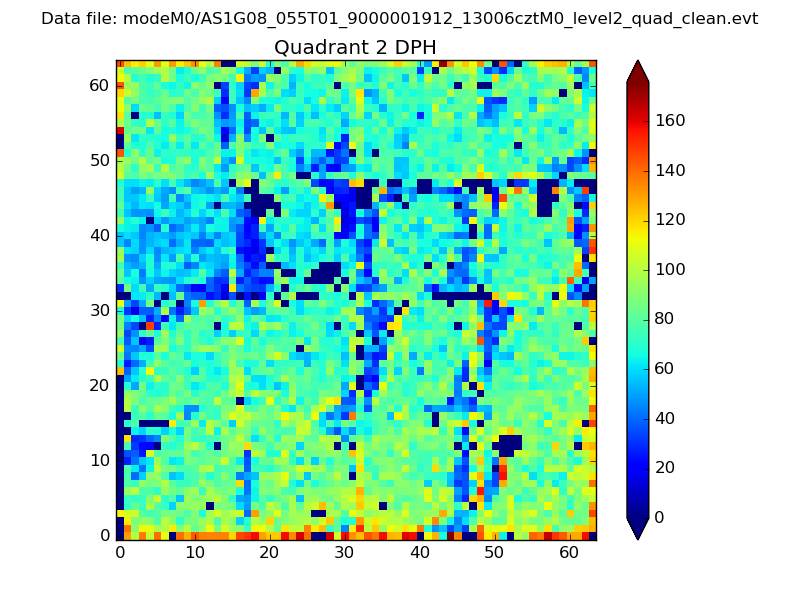 |
Quadrant C |
| Plot type | Count rate plots | Images |
|---|---|---|
| Comparison with Poisson distribution Blue bars denote a histogram of data divided into 1 sec bins. Red curve is a Poisson curve with rate = median count rate of data. |
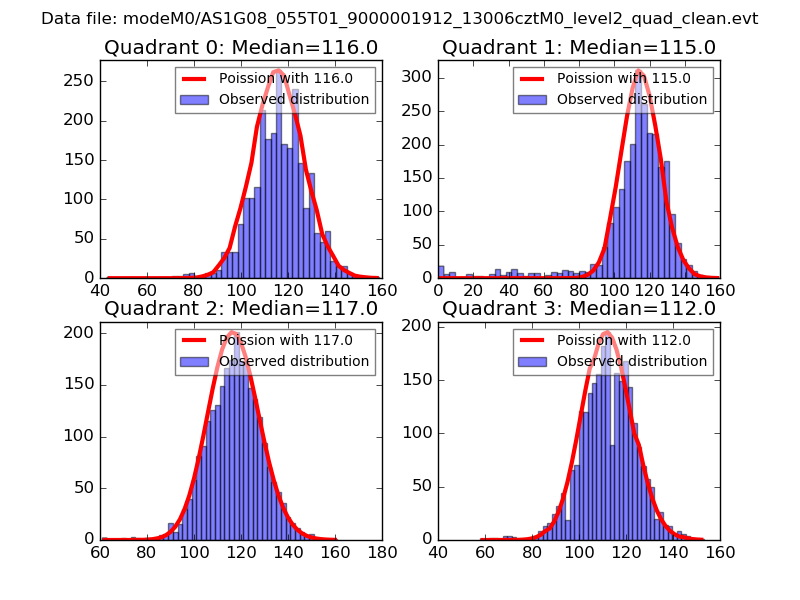 |
 |
| Quadrant-wise count rates Data is divided into 100 sec bins |
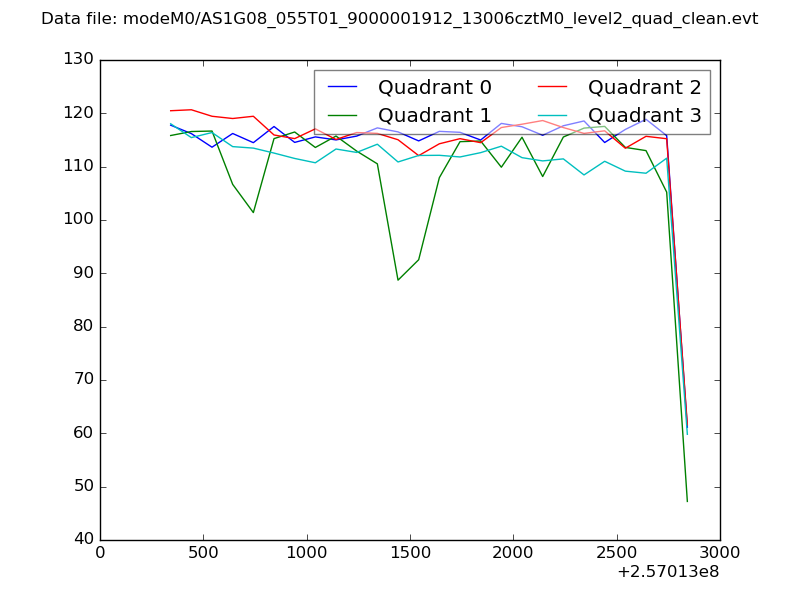 |
|
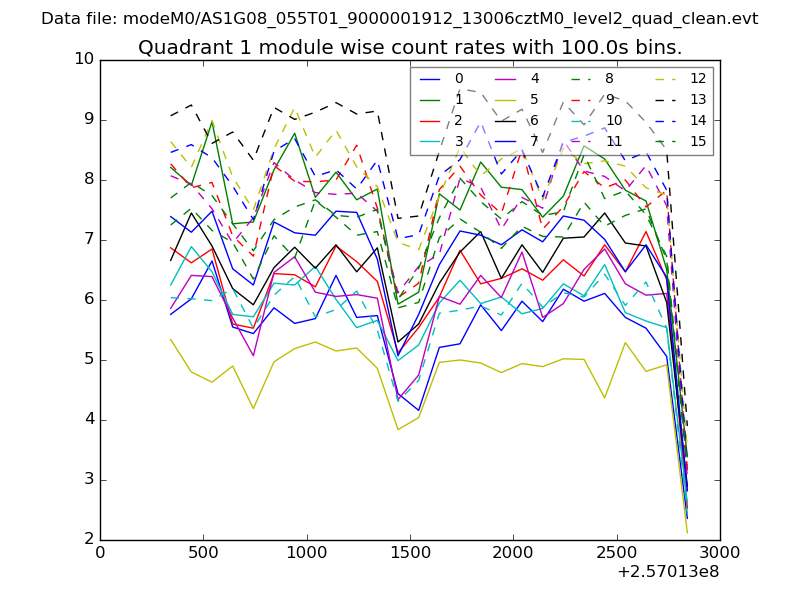
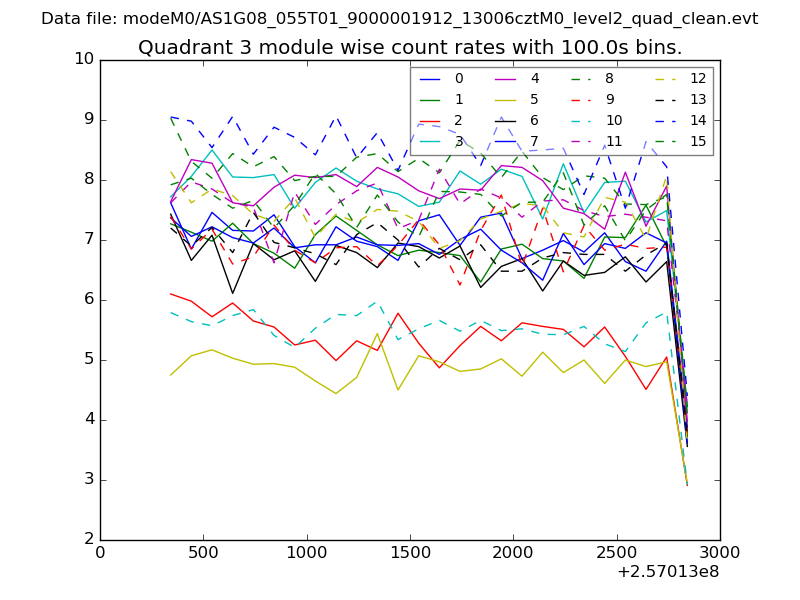
| Module-wise count rates for Quadrant A Data is divided into 100 sec bins |
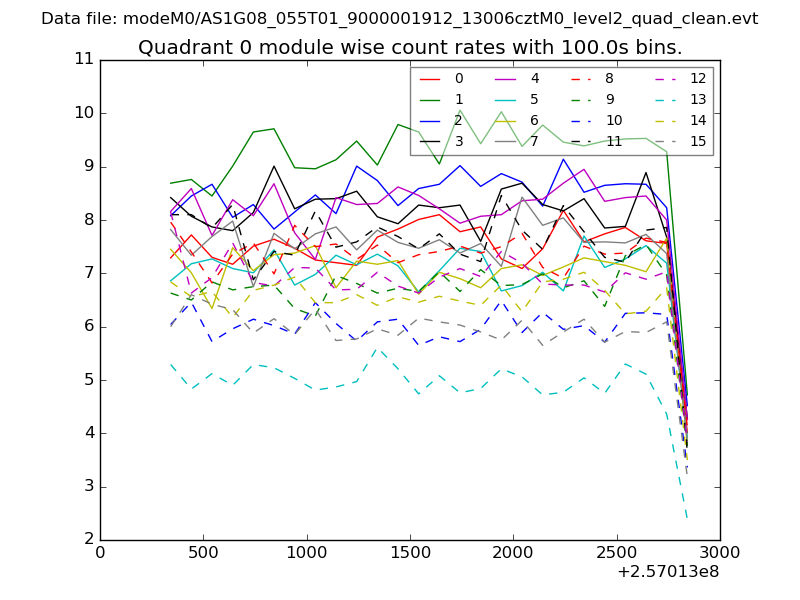 |
 |
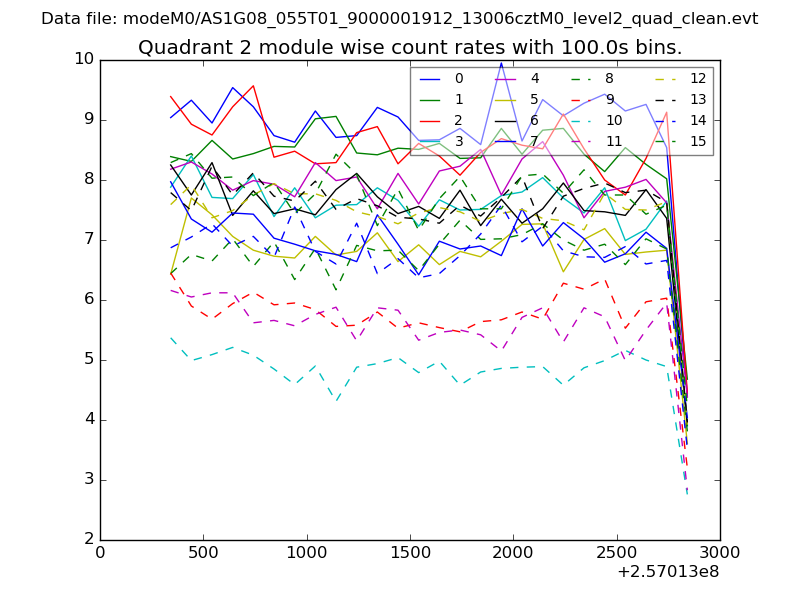
| Module-wise count rates for Quadrant B Data is divided into 100 sec bins |
 |
 |
| Module-wise count rates for Quadrant C Data is divided into 100 sec bins |
 |
 |
| Module-wise count rates for Quadrant D Data is divided into 100 sec bins |
 |
 |
| Parameter | Plot |
|---|---|
| CZT HV Monitor | 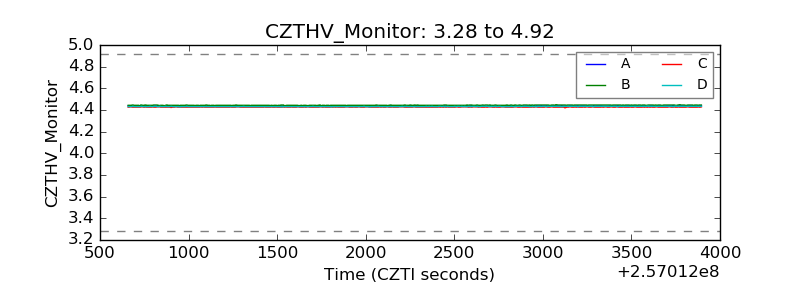 |
| D_VDD | 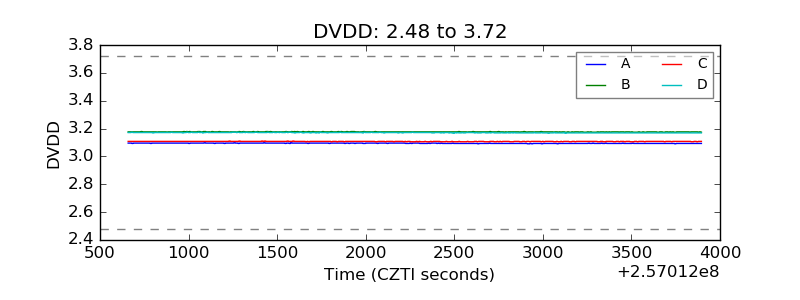 |
| Temperature 1 |  |
| Veto HV Monitor | 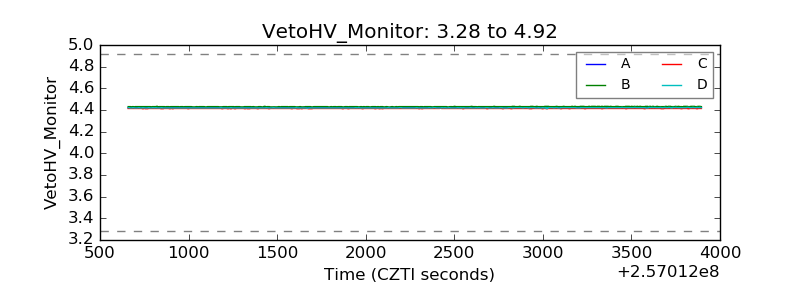 |
| Veto LLD | 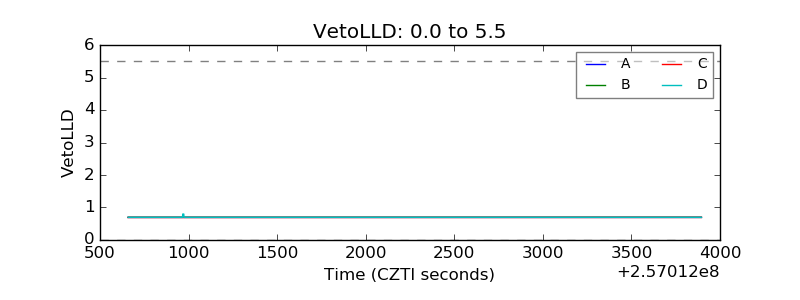 |
| Alpha Counter | 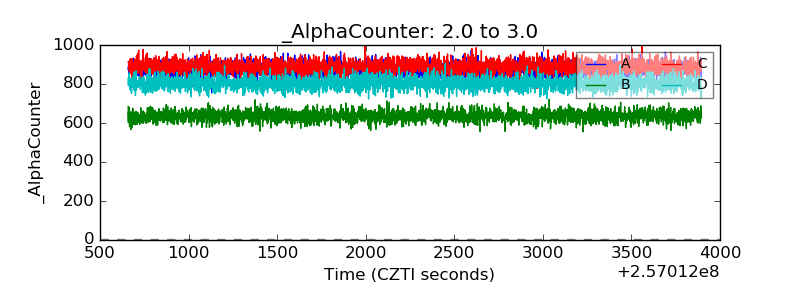 |
| _CPM_Rate | 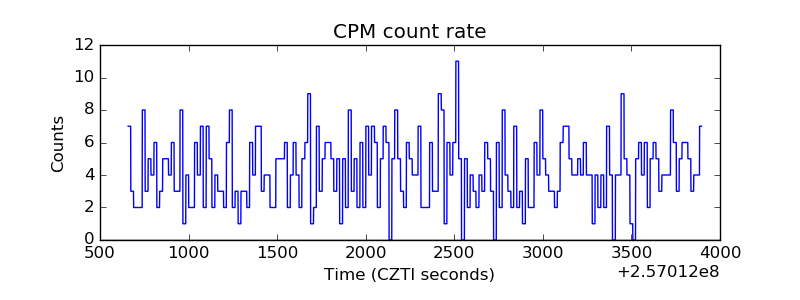 |
| CZT Counter | 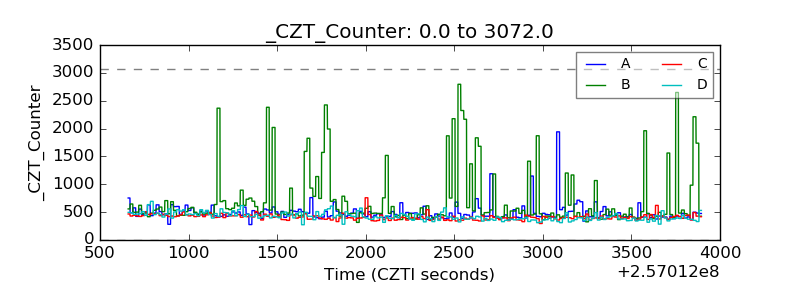 |
| +2.5 Volts monitor |  |
| +5 Volts monitor |  |
| _ROLL_ROT | 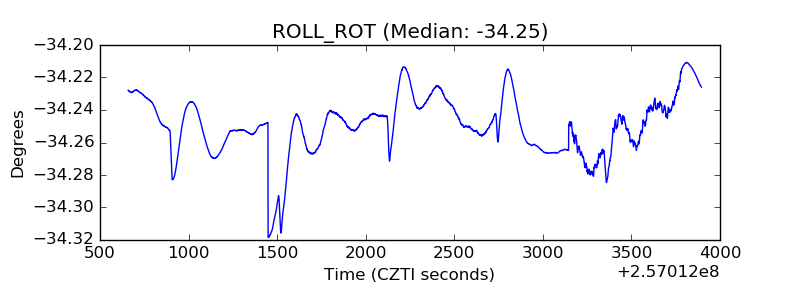 |
| _Roll_DEC |  |
| _Roll_RA | 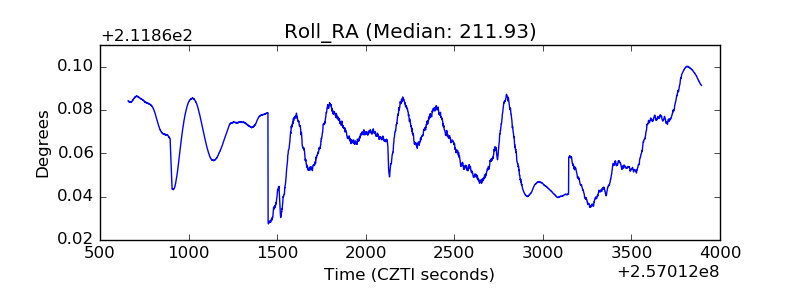 |
| Veto Counter | 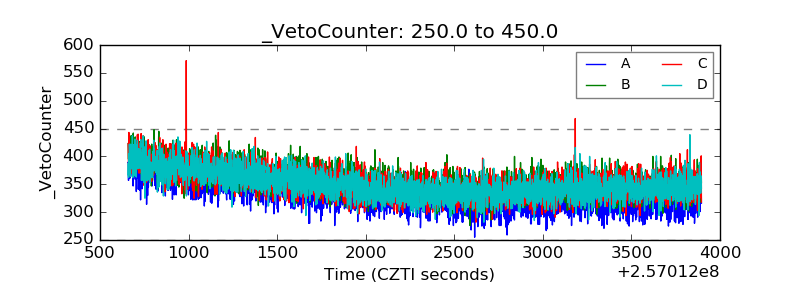 |