| Param | Original file | Final file |
|---|---|---|
| Filename | modeM0/AS1T02_002T01_9000001914cztM0_level2.fits | modeM0/AS1T02_002T01_9000001914cztM0_level2_quad_clean.evt |
| Size (bytes) | 561,242,880 | 757,846,080 |
| Size | 535.2 MB | 722.7 MB |
| Events in quadrant A | 3,465,466 | 5,091,379 |
| Events in quadrant B | 2,936,724 | 4,209,515 |
| Events in quadrant C | 3,432,640 | 4,942,888 |
| Events in quadrant D | 2,933,988 | 4,487,589 |
| Mode M9 | |||
|---|---|---|---|
| Quadrant | BADHDUFLAG | Total packets | Discarded packets |
| A | 0 | 113 | 0 |
| B | 0 | 113 | 0 |
| C | 0 | 113 | 0 |
| D | 0 | 113 | 0 |
| Mode M0 | |||
|---|---|---|---|
| Quadrant | BADHDUFLAG | Total packets | Discarded packets |
| A | 0 | 134315 | 0 |
| B | 0 | 195022 | 0 |
| C | 0 | 126040 | 0 |
| D | 0 | 152021 | 0 |
| Mode SS | |||
|---|---|---|---|
| Quadrant | BADHDUFLAG | Total packets | Discarded packets |
| A | 0 | 1252 | 0 |
| B | 0 | 1252 | 0 |
| C | 0 | 1252 | 0 |
| D | 0 | 1252 | 0 |
| Quadrant | Total seconds | Saturated seconds | Saturation percentage |
|---|---|---|---|
| A | 61570 | 916 | 1.487738% |
| B | 61570 | 11484 | 18.651941% |
| C | 61570 | 297 | 0.482378% |
| D | 61570 | 2389 | 3.880136% |
Noise dominated data is calculated using 1-second bins in cleaned event files. If a bin has >2000 counts, and if more than 50% of those come from <1% of pixels, then it is considered to be noise-dominated and hence unusable.
| Quadrant | # 1 sec bins | Bins with >0 counts | Bins with >2000 counts | High rate bins dominated by noise | Noise dominated (total time) | Noise dominated (detector-on time) | Marked lightcurve |
|---|---|---|---|---|---|---|---|
| A | 72716 | 61518 | 0 | 0 | 0.00% | 0.00% |  |
| B | 72713 | 59513 | 0 | 0 | 0.00% | 0.00% |  |
| C | 72716 | 61573 | 0 | 0 | 0.00% | 0.00% | 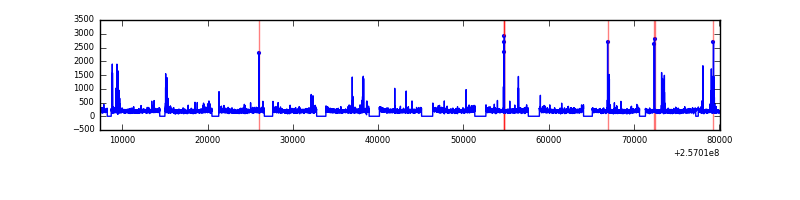 |
| D | 72716 | 61486 | 0 | 0 | 0.00% | 0.00% |  |
Top three noisy pixels from each quadrant. If the there are fewer than three noisy pixels in the level2.evt file, extra rows are filled as -1
| Pixel properties | Quadrant properties | ||||||
|---|---|---|---|---|---|---|---|
| Quadrant | DetID | PixID | Counts | Sigma | Mean | Median | Sigma |
| A | 0 | 29 | 3305 | 10.96 | 903 | 852 | 223.7 |
| A | 7 | 110 | 2751 | 8.49 | 903 | 852 | 223.7 |
| A | 9 | 19 | 2633 | 7.96 | 903 | 852 | 223.7 |
| B | 2 | 9 | 2542 | 11.89 | 774 | 741 | 151.4 |
| B | 14 | 254 | 2021 | 8.45 | 774 | 741 | 151.4 |
| B | 3 | 17 | 1973 | 8.14 | 774 | 741 | 151.4 |
| C | 12 | 241 | 2422 | 6.66 | 907 | 848 | 236.4 |
| C | 9 | 188 | 2327 | 6.26 | 907 | 848 | 236.4 |
| C | 2 | 191 | 2286 | 6.08 | 907 | 848 | 236.4 |
| D | 3 | 14 | 2165 | 6.25 | 836 | 761 | 224.7 |
| D | 6 | 231 | 2146 | 6.16 | 836 | 761 | 224.7 |
| D | 7 | 3 | 2063 | 5.79 | 836 | 761 | 224.7 |
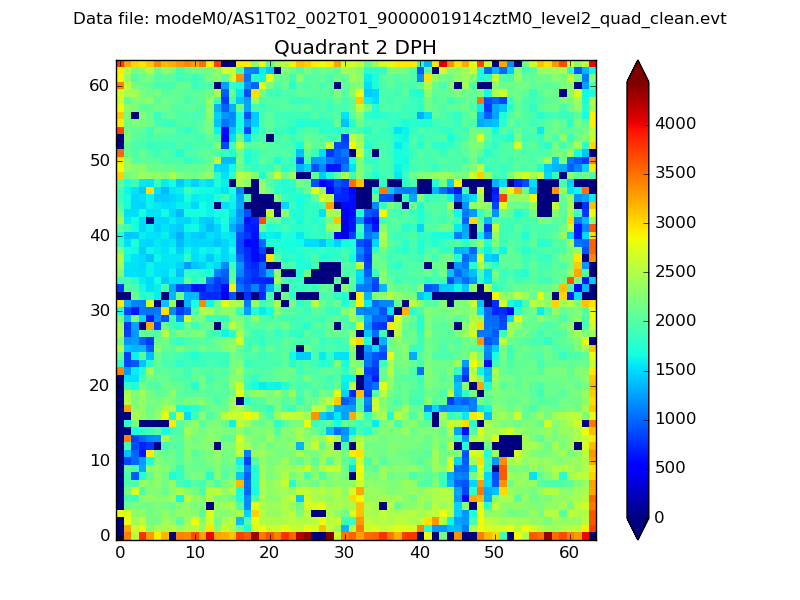
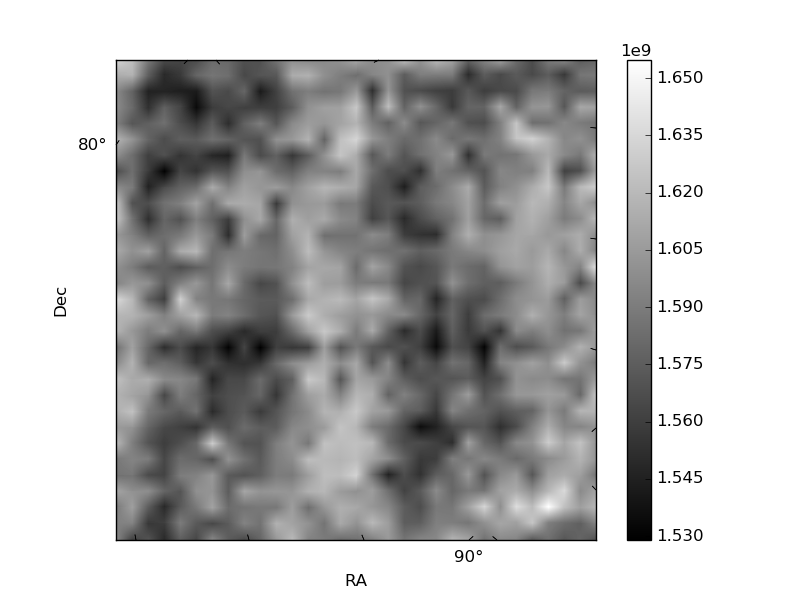
Histogram calculated using DETX and DETY for each event in the final _common_clean file
| Quadrant A |  |
 |
Quadrant B |
|---|---|---|---|
| Quadrant D |  |
 |
Quadrant C |
| Plot type | Count rate plots | Images |
|---|---|---|
| Comparison with Poisson distribution Blue bars denote a histogram of data divided into 1 sec bins. Red curve is a Poisson curve with rate = median count rate of data. |
 |
 |
| Quadrant-wise count rates Data is divided into 100 sec bins |
 |
|
| Module-wise count rates for Quadrant A Data is divided into 100 sec bins |
 |
 |
| Module-wise count rates for Quadrant B Data is divided into 100 sec bins |
 |
 |
| Module-wise count rates for Quadrant C Data is divided into 100 sec bins |
 |
 |
| Module-wise count rates for Quadrant D Data is divided into 100 sec bins |
 |
 |
| Parameter | Plot |
|---|---|
| CZT HV Monitor | 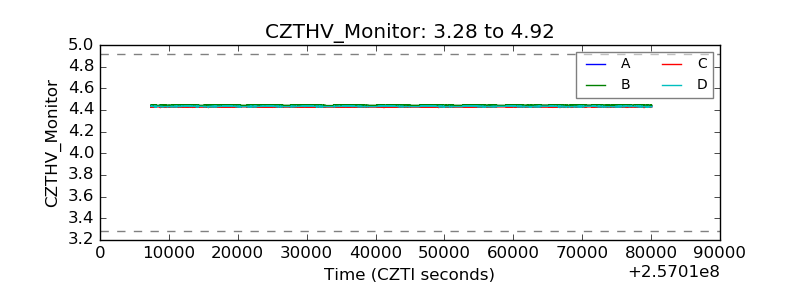 |
| D_VDD | 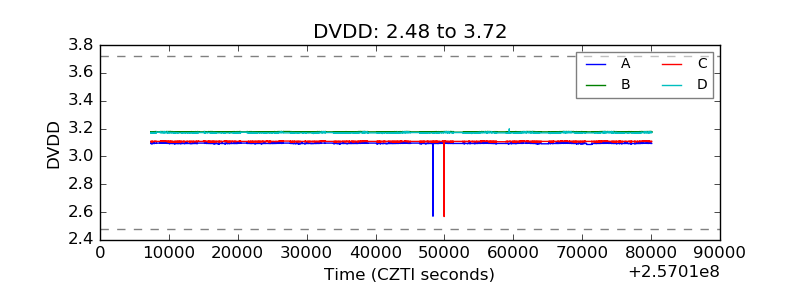 |
| Temperature 1 | 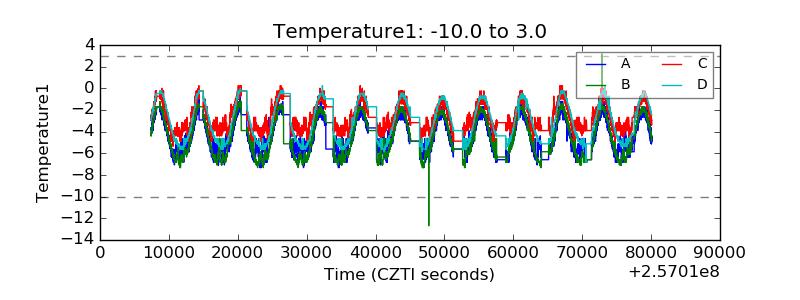 |
| Veto HV Monitor |  |
| Veto LLD |  |
| Alpha Counter |  |
| _CPM_Rate |  |
| CZT Counter |  |
| +2.5 Volts monitor | 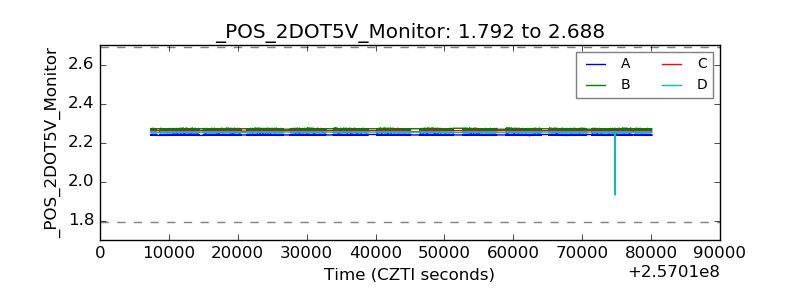 |
| +5 Volts monitor |  |
| _ROLL_ROT |  |
| _Roll_DEC |  |
| _Roll_RA | 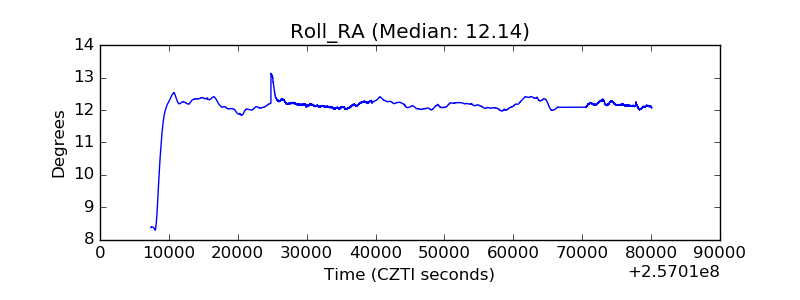 |
| Veto Counter | 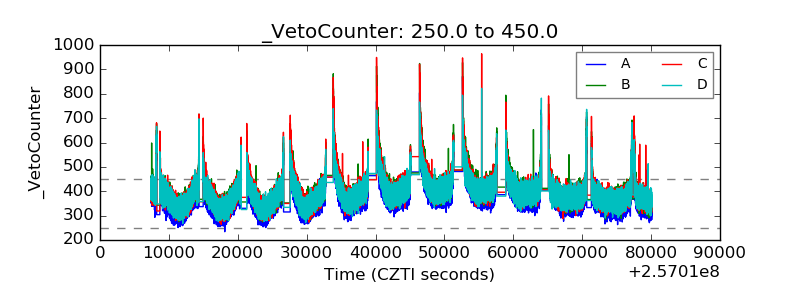 |