| Param | Original file | Final file |
|---|---|---|
| Filename | modeM0/AS1T02_002T01_9000001914_13006cztM0_level2.evt | modeM0/AS1T02_002T01_9000001914_13006cztM0_level2_quad_clean.evt |
| Size (bytes) | 1,126,229,760 | 238,340,160 |
| Size | 1.0 GB | 227.3 MB |
| Events in quadrant A | 6,910,197 | 1,628,050 |
| Events in quadrant B | 11,317,738 | 1,459,497 |
| Events in quadrant C | 6,099,978 | 1,664,356 |
| Events in quadrant D | 8,868,560 | 1,535,027 |
| Mode M9 | |||
|---|---|---|---|
| Quadrant | BADHDUFLAG | Total packets | Discarded packets |
| A | 0 | 19 | 0 |
| B | 0 | 19 | 0 |
| C | 0 | 19 | 0 |
| D | 0 | 19 | 0 |
| Mode M0 | |||
|---|---|---|---|
| Quadrant | BADHDUFLAG | Total packets | Discarded packets |
| A | 0 | 29562 | 4 |
| B | 0 | 42809 | 3 |
| C | 0 | 27561 | 3 |
| D | 0 | 35600 | 3 |
| Mode SS | |||
|---|---|---|---|
| Quadrant | BADHDUFLAG | Total packets | Discarded packets |
| A | 0 | 276 | 0 |
| B | 0 | 276 | 0 |
| C | 0 | 276 | 0 |
| D | 0 | 276 | 0 |
| Quadrant | Total seconds | Saturated seconds | Saturation percentage |
|---|---|---|---|
| A | 13477 | 195 | 1.446910% |
| B | 13477 | 2422 | 17.971359% |
| C | 13477 | 68 | 0.504563% |
| D | 13477 | 775 | 5.750538% |
Noise dominated data is calculated using 1-second bins in cleaned event files. If a bin has >2000 counts, and if more than 50% of those come from <1% of pixels, then it is considered to be noise-dominated and hence unusable.
| Quadrant | # 1 sec bins | Bins with >0 counts | Bins with >2000 counts | High rate bins dominated by noise | Noise dominated (total time) | Noise dominated (detector-on time) | Marked lightcurve |
|---|---|---|---|---|---|---|---|
| A | 15363 | 13481 | 99 | 99 | 0.64% | 0.73% | 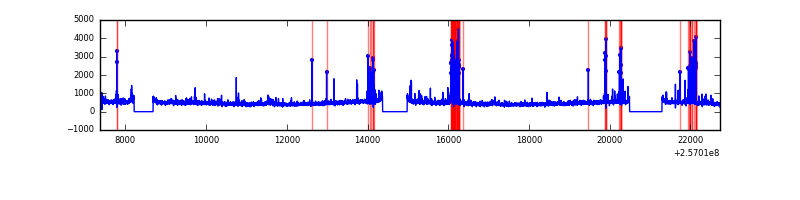 |
| B | 15363 | 13480 | 1405 | 1405 | 9.15% | 10.42% | 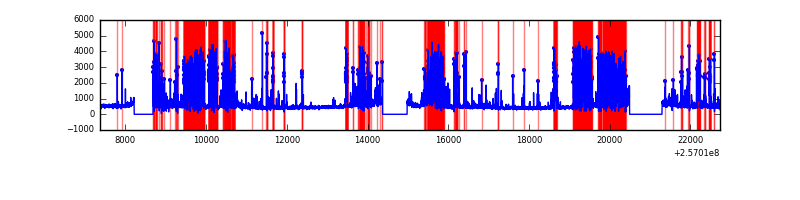 |
| C | 15363 | 13481 | 7 | 7 | 0.05% | 0.05% | 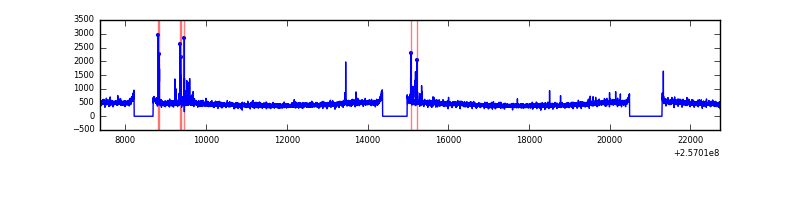 |
| D | 15363 | 13481 | 649 | 649 | 4.22% | 4.81% | 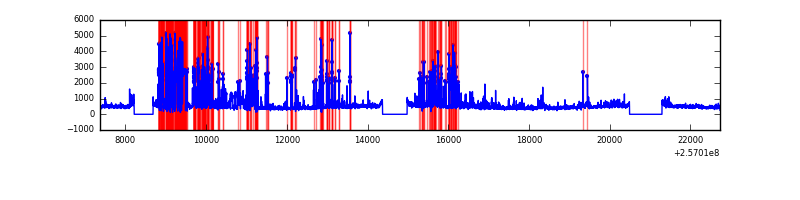 |
Top three noisy pixels from each quadrant. If the there are fewer than three noisy pixels in the level2.evt file, extra rows are filled as -1
| Pixel properties | Quadrant properties | ||||||
|---|---|---|---|---|---|---|---|
| Quadrant | DetID | PixID | Counts | Sigma | Mean | Median | Sigma |
| A | 13 | 248 | 314250 | 994.31 | 1561 | 1525 | 314.5 |
| A | 12 | 189 | 152946 | 481.44 | 1561 | 1525 | 314.5 |
| A | 15 | 223 | 147017 | 462.59 | 1561 | 1525 | 314.5 |
| B | 4 | 239 | 4887355 | 18497.09 | 1401 | 1363 | 264.1 |
| B | 3 | 64 | 400070 | 1509.4 | 1401 | 1363 | 264.1 |
| B | 0 | 219 | 161822 | 607.45 | 1401 | 1363 | 264.1 |
| C | 0 | 207 | 83921 | 234.66 | 1540 | 1545 | 351.0 |
| C | 13 | 61 | 11193 | 27.48 | 1540 | 1545 | 351.0 |
| C | 14 | 234 | 9865 | 23.7 | 1540 | 1545 | 351.0 |
| D | 1 | 52 | 3157530 | 8972.41 | 1480 | 1437 | 351.8 |
| D | 2 | 234 | 47413 | 130.7 | 1480 | 1437 | 351.8 |
| D | 8 | 195 | 45272 | 124.62 | 1480 | 1437 | 351.8 |
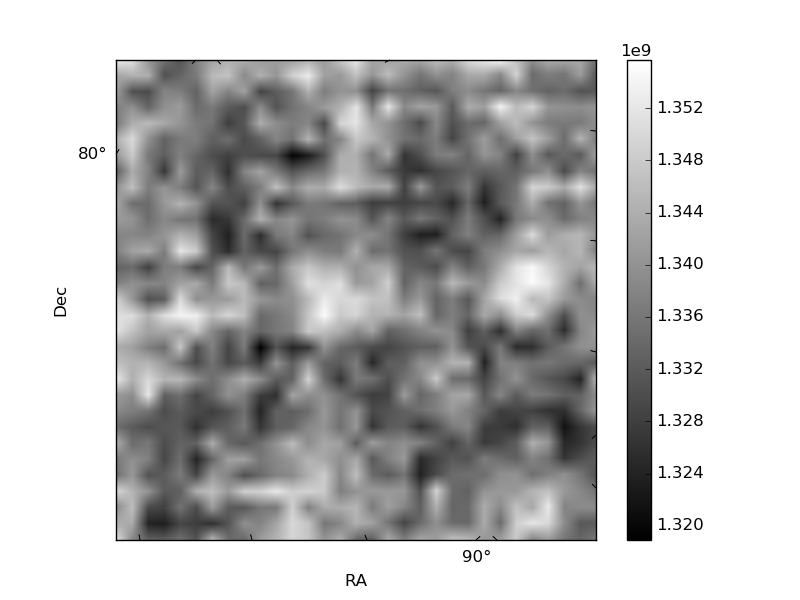
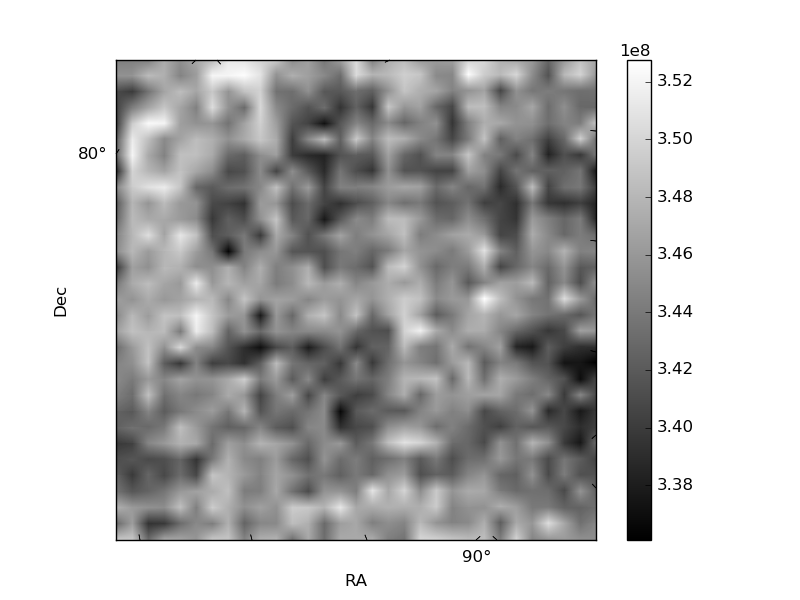
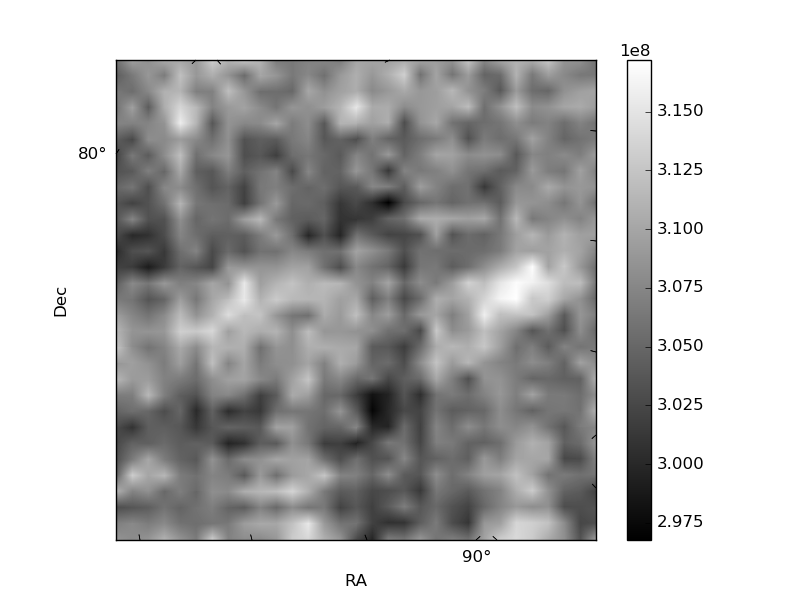
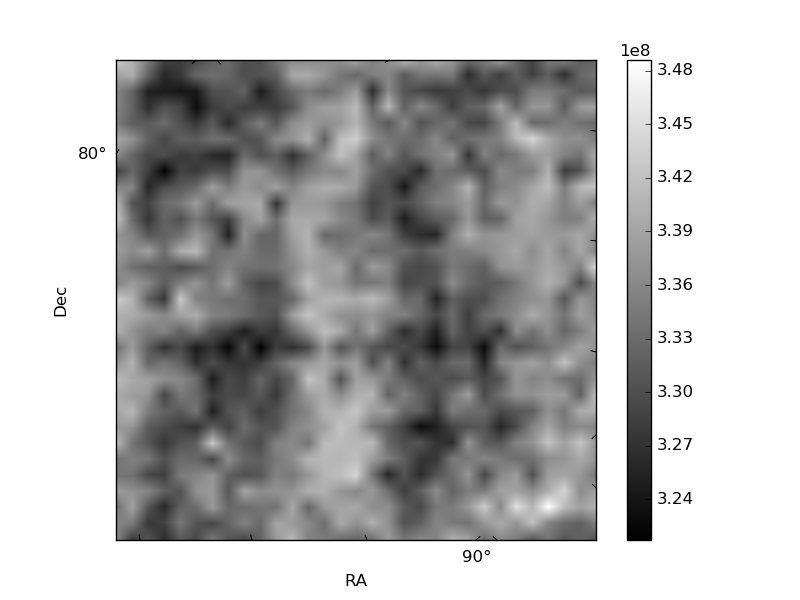
Histogram calculated using DETX and DETY for each event in the final _common_clean file
| Quadrant A | 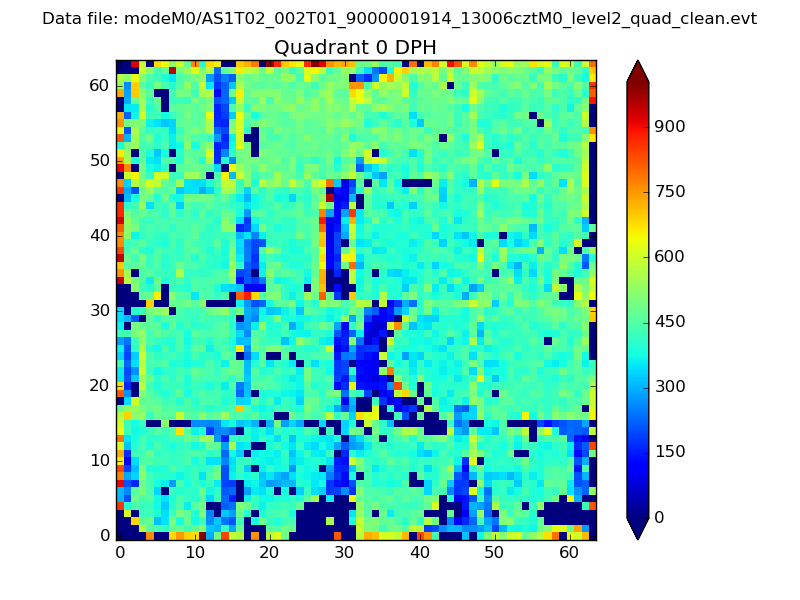 |
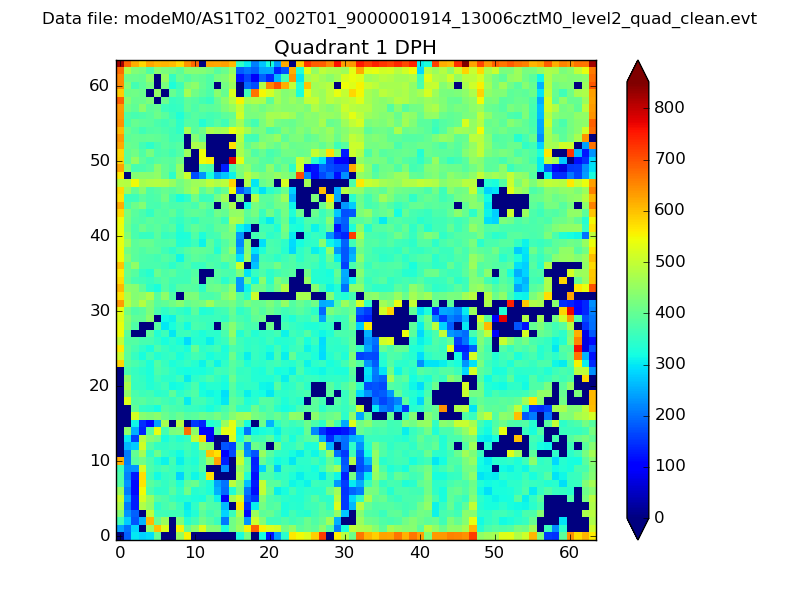 |
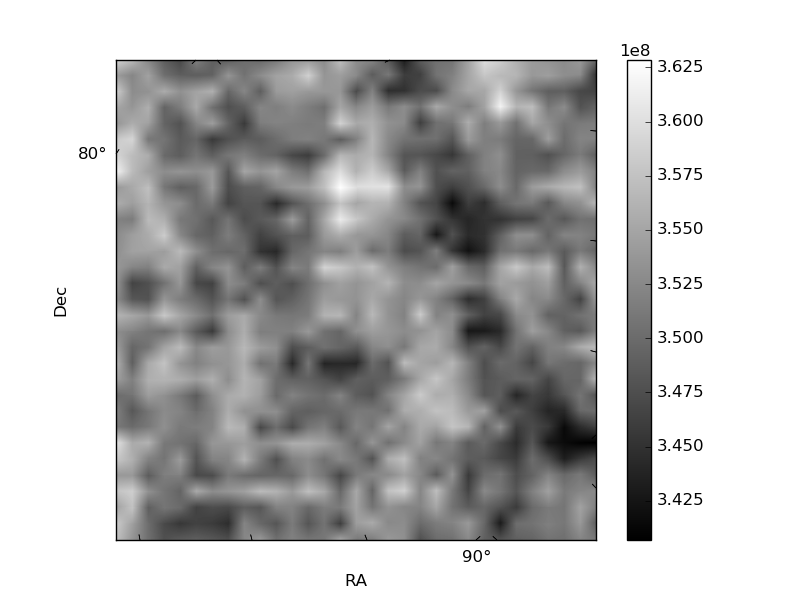
Quadrant B |
|---|---|---|---|
| Quadrant D | 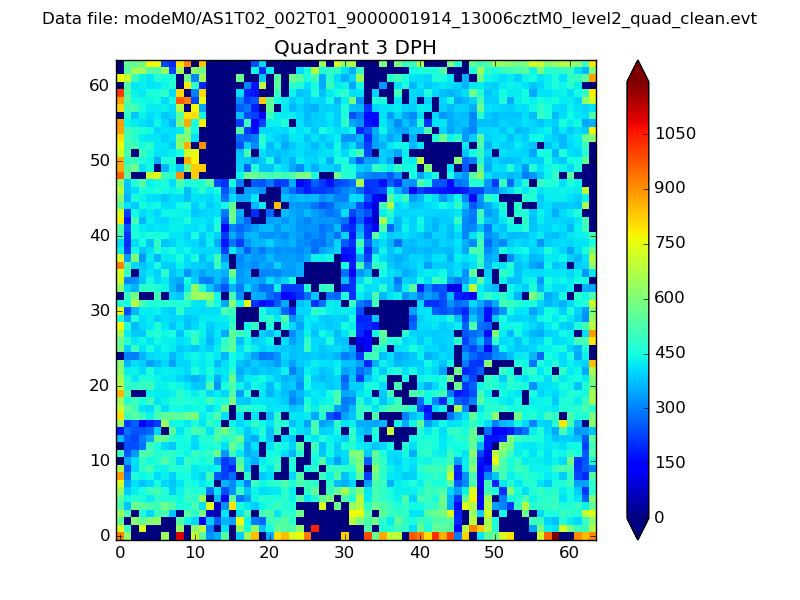 |
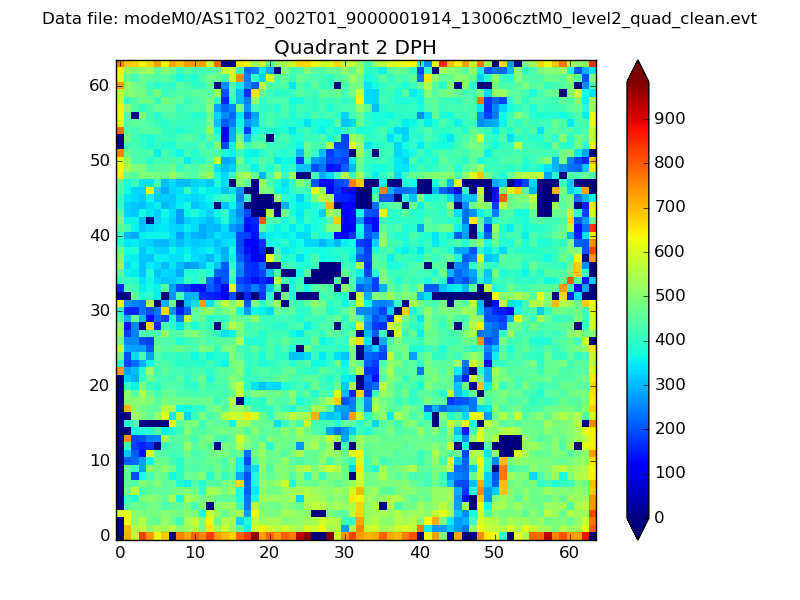 |
Quadrant C |
| Plot type | Count rate plots | Images |
|---|---|---|
| Comparison with Poisson distribution Blue bars denote a histogram of data divided into 1 sec bins. Red curve is a Poisson curve with rate = median count rate of data. |
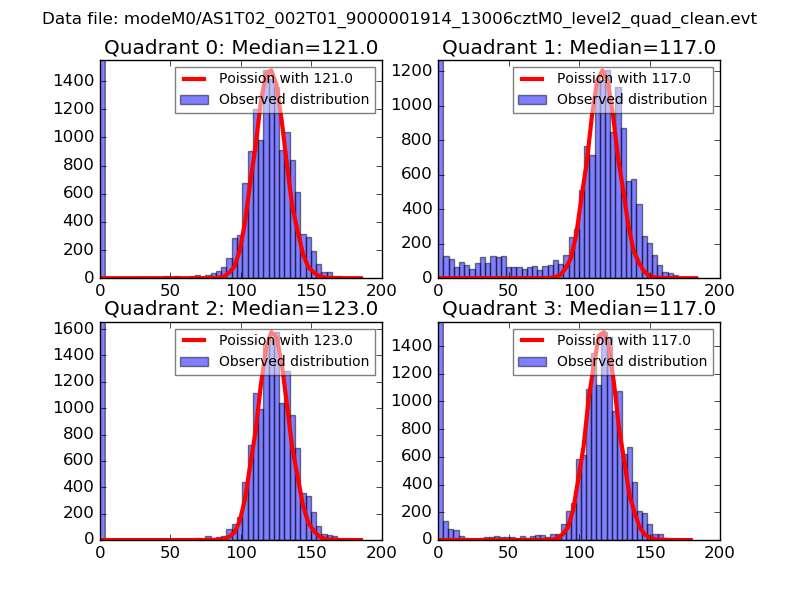 |
 |
| Quadrant-wise count rates Data is divided into 100 sec bins |
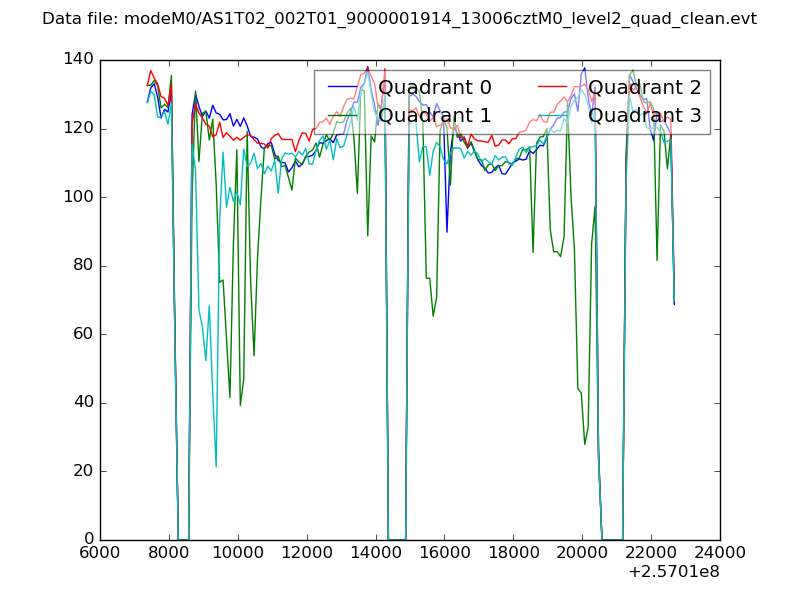 |
|
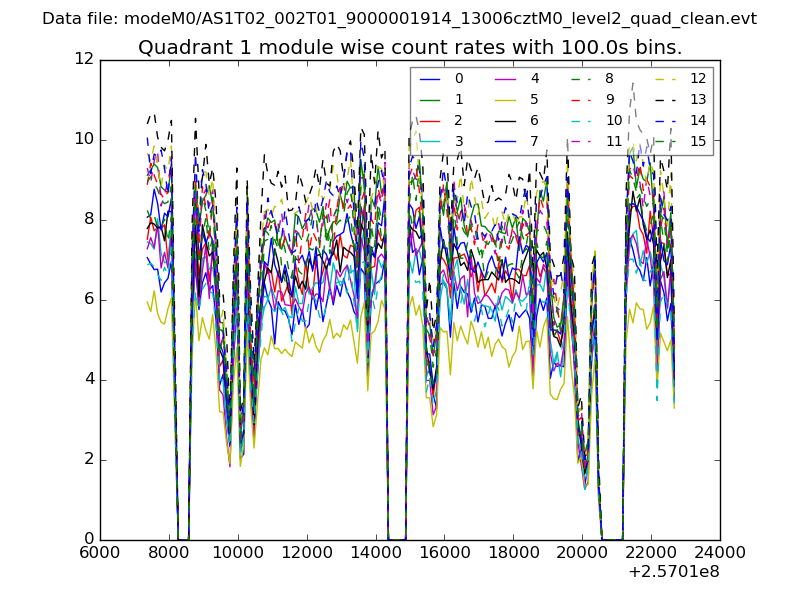
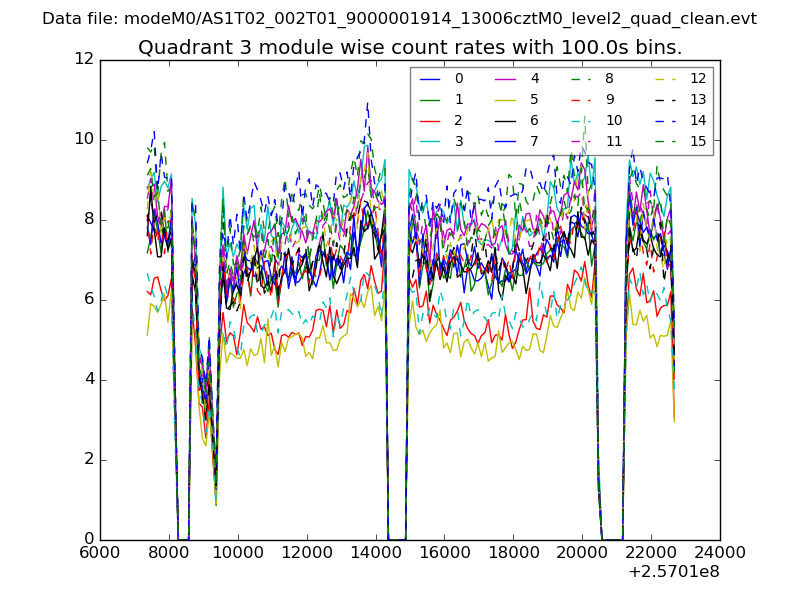
| Module-wise count rates for Quadrant A Data is divided into 100 sec bins |
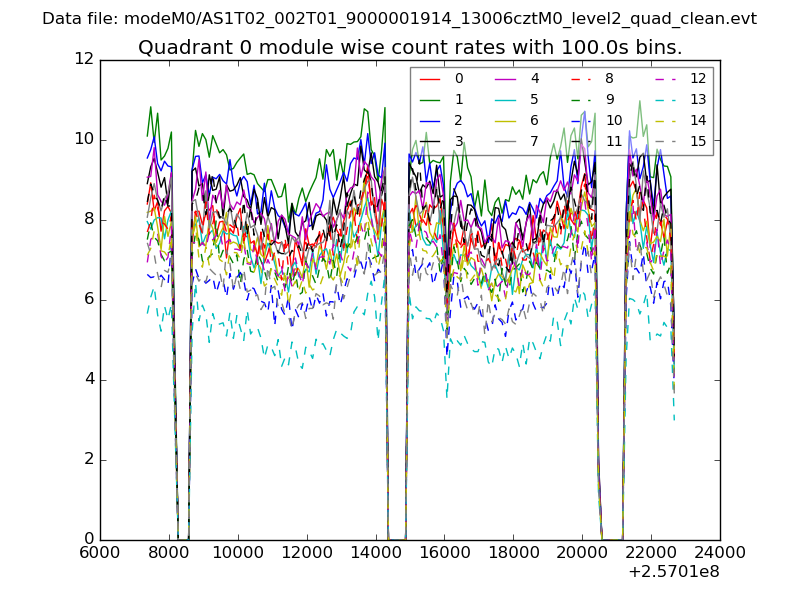 |
 |
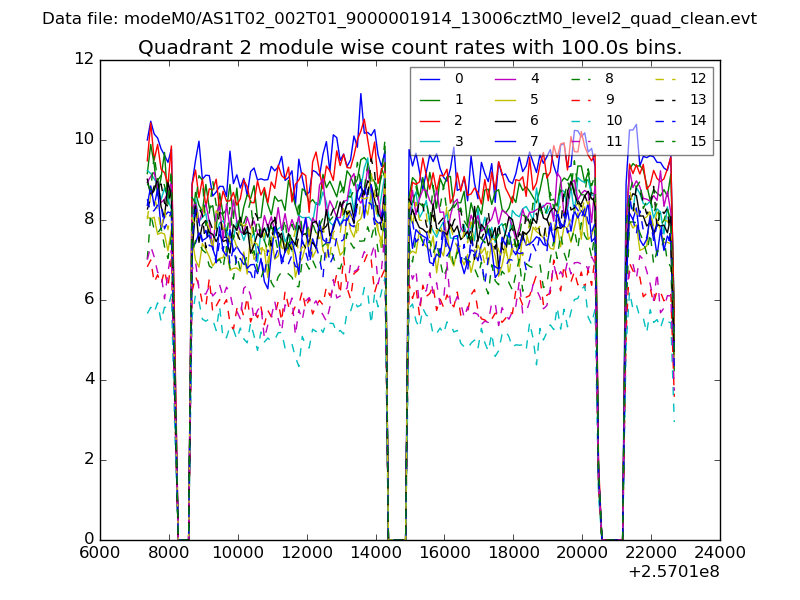
| Module-wise count rates for Quadrant B Data is divided into 100 sec bins |
 |
 |
| Module-wise count rates for Quadrant C Data is divided into 100 sec bins |
 |
 |
| Module-wise count rates for Quadrant D Data is divided into 100 sec bins |
 |
 |
| Parameter | Plot |
|---|---|
| CZT HV Monitor | 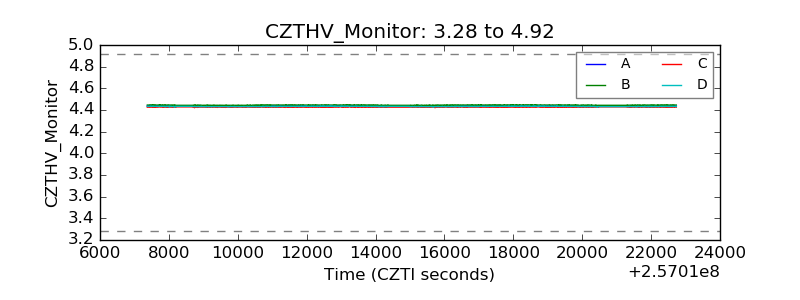 |
| D_VDD |  |
| Temperature 1 | 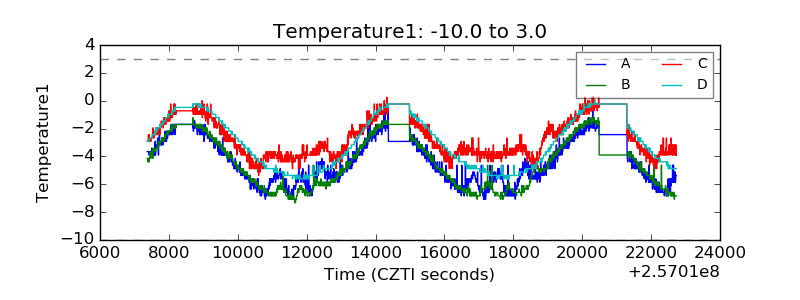 |
| Veto HV Monitor | 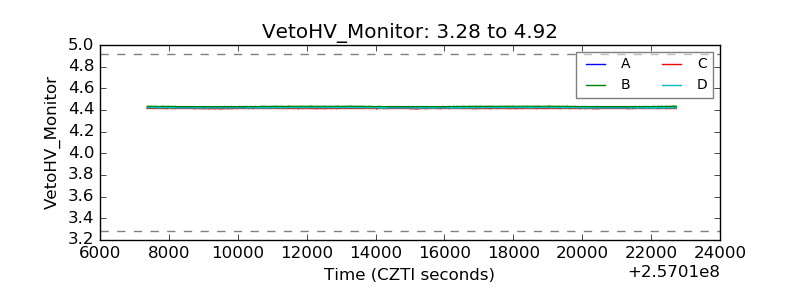 |
| Veto LLD | 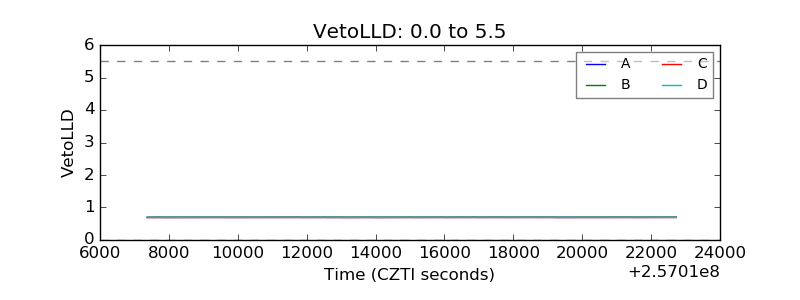 |
| Alpha Counter | 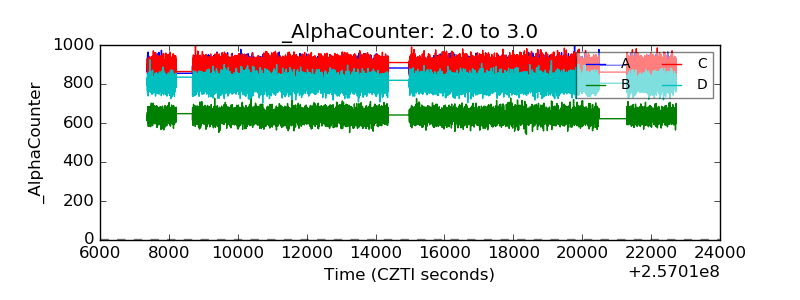 |
| _CPM_Rate | 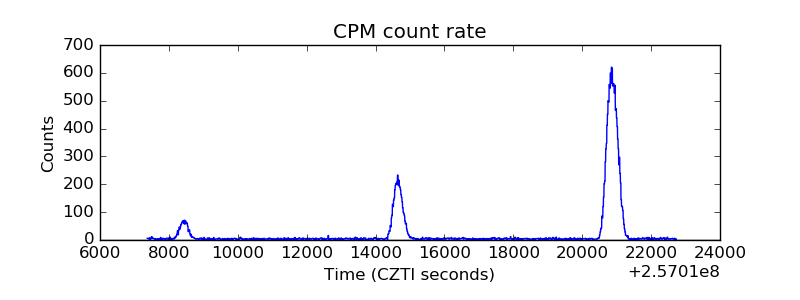 |
| CZT Counter | 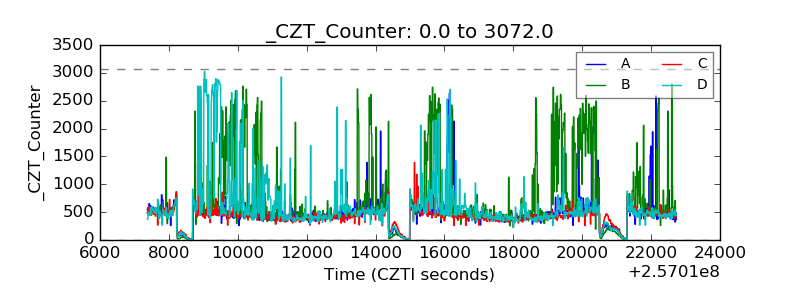 |
| +2.5 Volts monitor |  |
| +5 Volts monitor | 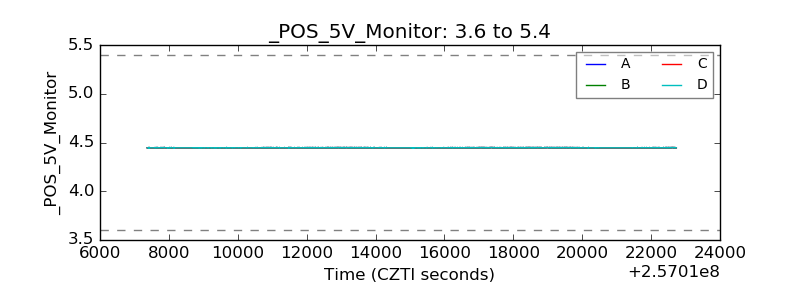 |
| _ROLL_ROT | 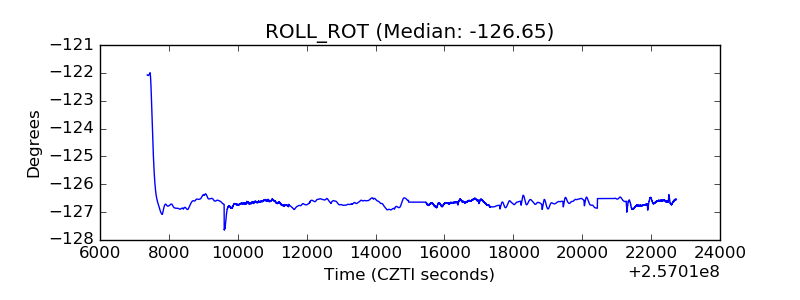 |
| _Roll_DEC | 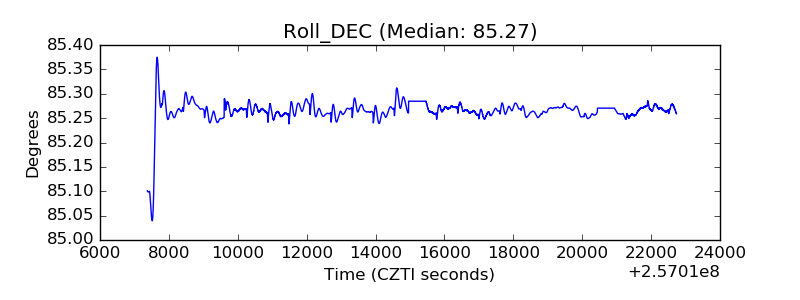 |
| _Roll_RA | 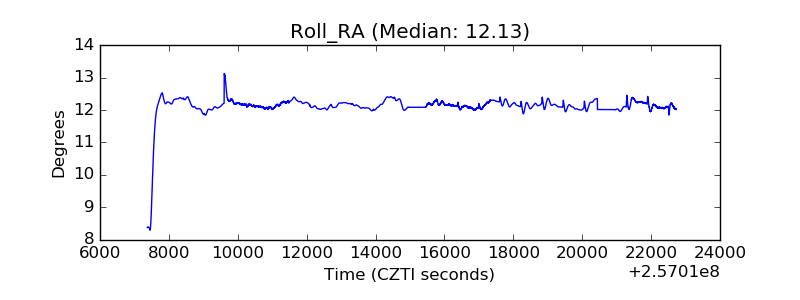 |
| Veto Counter | 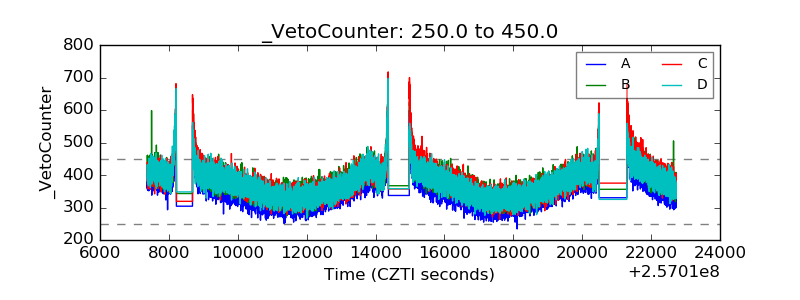 |